Commentary - Equity Outlook
Mr. Anoop Bhaskar
Head - Equity

WHAT WENT BY
“Where were you?” - is a question usually reserved for days when events which took place have a bearing for a long
period of time, 22nd November 1963, 25th June 1975, 25th June 1983, 9th November 1989, 11th September 2001. For
Financial investors, March 9th 2009 was THE day that has been etched in investors’ memory, when the S&P posted a
low of 666, down almost 45% from the highs set in Dec-07. So how has Indian markets fared since March 2009? How
many would have predicted US markets – S&P 500 moving up 4x from those lows? How have the Indian markets fared
during this time?
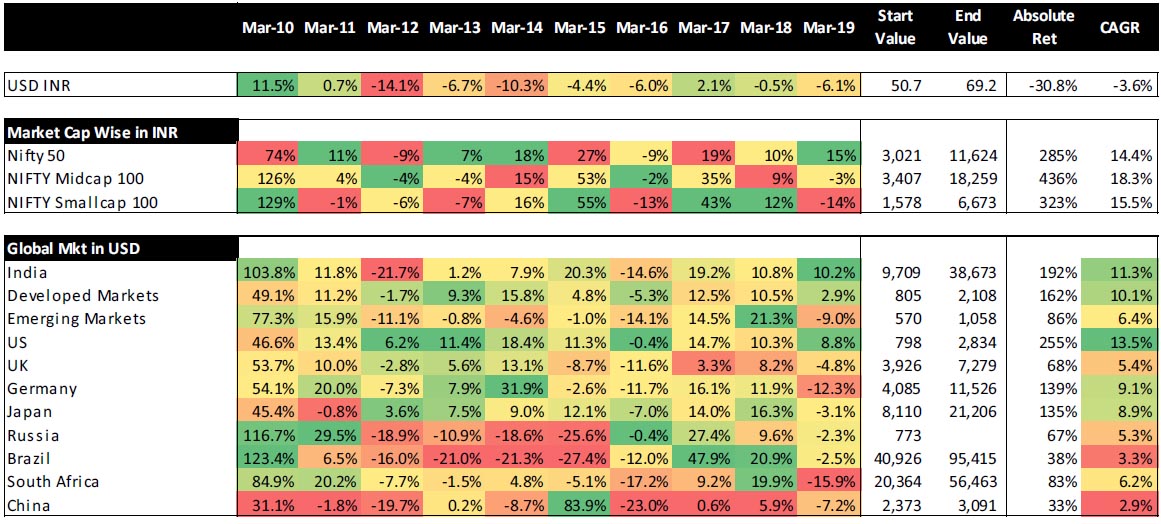
The table below depicts the performance of key markets during this decade of low cost money. Clearly, US market has been the market which has generated the highest returns, especially when compared in US$ terms. US emerged as the best performing market four out of the last 10 years, a track record which would make a Nadal or Federer proud. The strength of its track record during the last decade was so strong, it did not report the worst annual return even once. Clearly, QE and Operation Twist made US markets the rocking star of the decade since March’09.

While US market has been the best performing market over the decade, has it been supported by a similar strength in earnings growth? Bloomberg data shows that from CY 08 to CY 18, S&P 500 has registered an earnings growth of 11% as compared to Nifty’s earnings growth of 6%. However, a significant portion was on account of the starting point Cy 08, which registered a sharp decline in earnings as compared to CY 07, a drop of 44%, this was just 9.5% for Nifty. For CY 07-18 period S&P 500 and Nifty reported an earnings growth of 6% and 5% respectively. Thus, growth in earnings has been at a premium across the world.
Contrary to misconceived notion, Small Caps haven’t galloped away (Attention Mr. Dangi) in India. Over the decade, Small Caps actually lagged Mid Cap returns. Of the market cap indices, one trend which needs to be highlighted (also reported in our CY 19 Market outlook) is the inverse relationship between the movement of INR and Small Cap index returns. Except for 12m ending Mar-14 (pre-election rally?), when the INR was negative and Small cap was positive, in all other periods when INR has fallen by over 5% - 12m ending March (March 14, March 16 and March 19), Small cap registered double digit negative returns. Interestingly, Mid cap Index despite generating the best annual returns only twice during the last decade had the highest CAGR amongst the three indices. On the Large Cap front, Nifty has been an outstanding performer, registering negative returns just twice, while Mid and Small cap indices registered negative returns four times. Another matter of national pride is how quickly Nifty went past its 2008 highs, earlier than China, Emerging Markets and Europe.

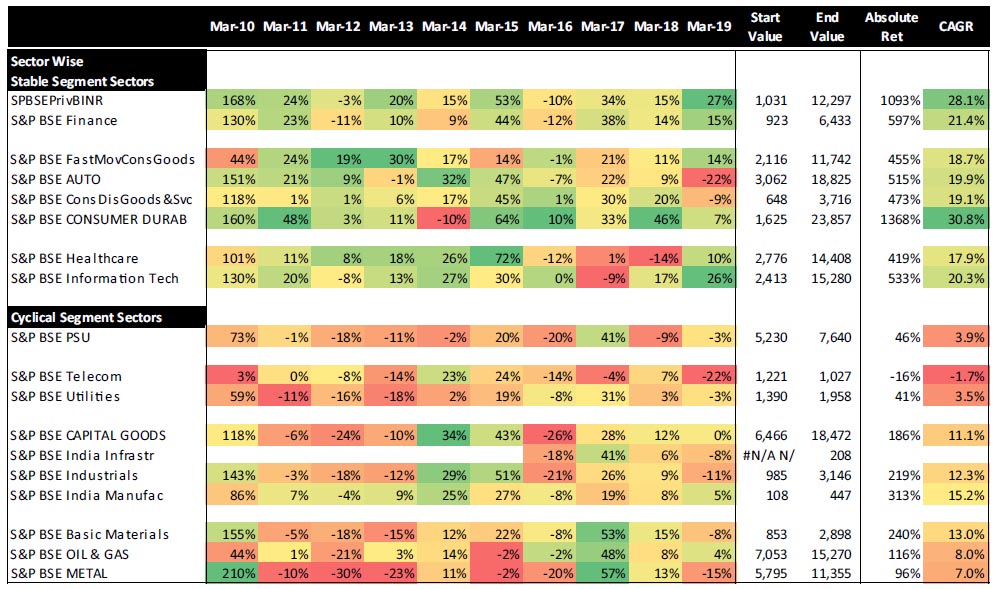
For cyclicals, the story, as expected, was a mixed bag. PSU banks reported positive annual returns only thrice during the last decade. Similarly, metals reported positive annual returns only thrice. However, twice these were the best performing returns amongst all sectors! Interestingly, only telecom and Utilities were the only cyclical sectors not to register the best performing annual returns during this decade, while generating the worst return four out of the last ten years.
Final Word
US has been the best performing market since March’09 benefitting from Quantitative Easing (QE). India, surprisingly, has done well too. Both markets have registered tepid earnings growth. Valuations have been boosted by loose monetary policies followed by Central Bankers across. Earnings, it appears, will be disproportionately rewarded wherever it occurs. Within India, the euphoria of small caps has not been matched by a consistent performance throughout the decade. Among sectors, the search for consistent growth has made sectors like Private Banks, NBFC, Consumer Staples, Consumer Discretionary and IT Services outperform cyclical sectors more often than not. Cyclicals, as the name goes, have registered short bursts of outperformance during this period, making them difficult to ignore.
How will returns pan out for the next 10 years? At a global level – flows will be impacted by the continuation or reversal of the current monetary policies. Hike in interest rates and/or tightening of Central bank balance sheets, as was evident in CY 18, should boost US$ versus global currencies, hitting emerging countries with weaker macros – in 2013 it was India, in 2018 - Argentina and Turkey. The other critical question is on China. The size of Chinese economy at $12-14 trillion “dwarfs” the next biggest economies in the world, Germany and Japan, whose economies range between $4.5-5.5 trillion (UK, France, India and South Korea follow with $2.0-2.8 trillion).
At a country level, micro factors will play an important role – pace at which Tax/GDP ratio continues to increase and Government’s fiscal position as derived from this will be a critical component of how the macro plays out. During the last 10 years, growth has been driven mainly by domestic consumption. If tax collection and compliance improves, this would make fiscal more comfortable. Would these gains be used to invest to create long term assets across sectors – Infrastructure, education, health or will they be used to increase subsidy through direct benefit transfer to the poor and needy, in a way, again stimulating consumption? While the former, would make the India story more balanced and winners will be placed more evenly within stable and cyclical segments, the latter could continue to reward the winners of the past decade. India, as usual, is at crossroads.
Market Commentary
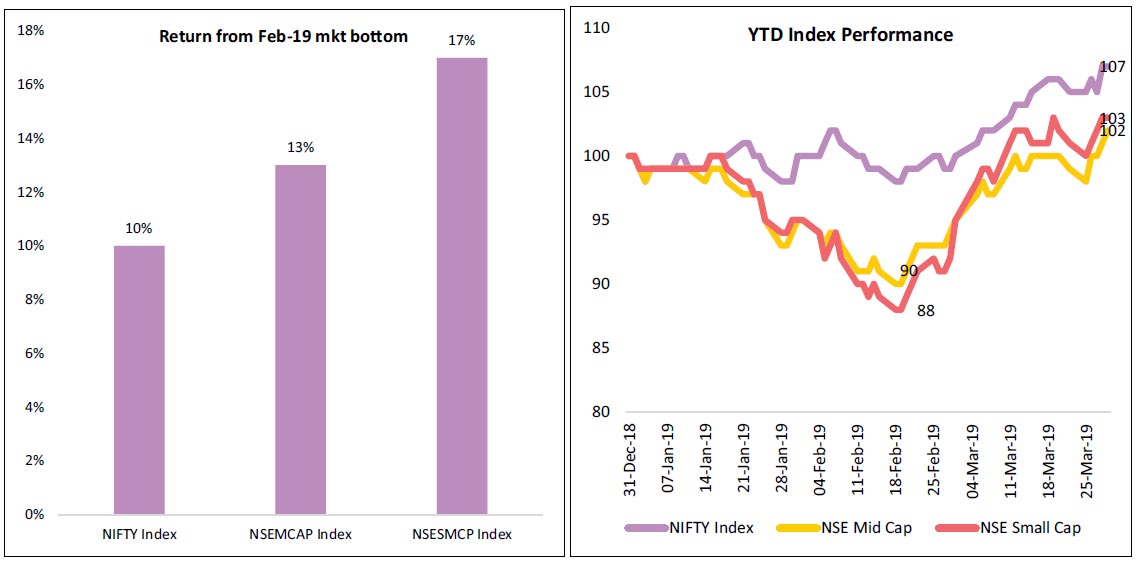
A year, they say, is a long time in politics. A month, it seems could redefine a Fund Manager’s career! If this quarter was viewed in totality, then it would be unremarkable by the end results, a continuation of the trend of the previous three quarters of FY 19. However, this may be far from the view for most market participants. For the quarter, Nifty continued its dominance, registering a move of 7.0%, while Nifty Midcap was up 2.1% and Nifty Smallcap was up 3.5%. For the year, the gap between Nifty and Nifty Smallcap narrowed from 33% to 29.3%, with Nifty being + 14.9% and Nifty Small cap registering -14.4% decline. However, from the low of Feb’19 till the end of March’19, Nifty Small cap recovered smartly by +17% while Nifty rose by +10%. While to most this would appear to be driven by geopolitical standoff with Pakistan and the strong action of the Modi Government, it could also be attributed to a rally in small cap stocks across major Asian markets led by China. Either way, no one is trying to pinpoint the reason. With the end of fiscal year looming, help from any quarter for the beleaguered fund Manager was welcome. Increasingly, the sentiment of a return of Modi government and hope for a more “reformist” approach in the second term is increasingly finding favour – political uncertainty in the minds of investors appears to have reduced significantly. The consensus view, barring some unlikely event, would be betting on a return of NDA Government.

The table below depicts the performance of key markets during this decade of low cost money. Clearly, US market has been the market which has generated the highest returns, especially when compared in US$ terms. US emerged as the best performing market four out of the last 10 years, a track record which would make a Nadal or Federer proud. The strength of its track record during the last decade was so strong, it did not report the worst annual return even once. Clearly, QE and Operation Twist made US markets the rocking star of the decade since March’09.

While US market has been the best performing market over the decade, has it been supported by a similar strength in earnings growth? Bloomberg data shows that from CY 08 to CY 18, S&P 500 has registered an earnings growth of 11% as compared to Nifty’s earnings growth of 6%. However, a significant portion was on account of the starting point Cy 08, which registered a sharp decline in earnings as compared to CY 07, a drop of 44%, this was just 9.5% for Nifty. For CY 07-18 period S&P 500 and Nifty reported an earnings growth of 6% and 5% respectively. Thus, growth in earnings has been at a premium across the world.
Contrary to misconceived notion, Small Caps haven’t galloped away (Attention Mr. Dangi) in India. Over the decade, Small Caps actually lagged Mid Cap returns. Of the market cap indices, one trend which needs to be highlighted (also reported in our CY 19 Market outlook) is the inverse relationship between the movement of INR and Small Cap index returns. Except for 12m ending Mar-14 (pre-election rally?), when the INR was negative and Small cap was positive, in all other periods when INR has fallen by over 5% - 12m ending March (March 14, March 16 and March 19), Small cap registered double digit negative returns. Interestingly, Mid cap Index despite generating the best annual returns only twice during the last decade had the highest CAGR amongst the three indices. On the Large Cap front, Nifty has been an outstanding performer, registering negative returns just twice, while Mid and Small cap indices registered negative returns four times. Another matter of national pride is how quickly Nifty went past its 2008 highs, earlier than China, Emerging Markets and Europe.

For cyclicals, the story, as expected, was a mixed bag. PSU banks reported positive annual returns only thrice during the last decade. Similarly, metals reported positive annual returns only thrice. However, twice these were the best performing returns amongst all sectors! Interestingly, only telecom and Utilities were the only cyclical sectors not to register the best performing annual returns during this decade, while generating the worst return four out of the last ten years.
Final Word
US has been the best performing market since March’09 benefitting from Quantitative Easing (QE). India, surprisingly, has done well too. Both markets have registered tepid earnings growth. Valuations have been boosted by loose monetary policies followed by Central Bankers across. Earnings, it appears, will be disproportionately rewarded wherever it occurs. Within India, the euphoria of small caps has not been matched by a consistent performance throughout the decade. Among sectors, the search for consistent growth has made sectors like Private Banks, NBFC, Consumer Staples, Consumer Discretionary and IT Services outperform cyclical sectors more often than not. Cyclicals, as the name goes, have registered short bursts of outperformance during this period, making them difficult to ignore.
How will returns pan out for the next 10 years? At a global level – flows will be impacted by the continuation or reversal of the current monetary policies. Hike in interest rates and/or tightening of Central bank balance sheets, as was evident in CY 18, should boost US$ versus global currencies, hitting emerging countries with weaker macros – in 2013 it was India, in 2018 - Argentina and Turkey. The other critical question is on China. The size of Chinese economy at $12-14 trillion “dwarfs” the next biggest economies in the world, Germany and Japan, whose economies range between $4.5-5.5 trillion (UK, France, India and South Korea follow with $2.0-2.8 trillion).
At a country level, micro factors will play an important role – pace at which Tax/GDP ratio continues to increase and Government’s fiscal position as derived from this will be a critical component of how the macro plays out. During the last 10 years, growth has been driven mainly by domestic consumption. If tax collection and compliance improves, this would make fiscal more comfortable. Would these gains be used to invest to create long term assets across sectors – Infrastructure, education, health or will they be used to increase subsidy through direct benefit transfer to the poor and needy, in a way, again stimulating consumption? While the former, would make the India story more balanced and winners will be placed more evenly within stable and cyclical segments, the latter could continue to reward the winners of the past decade. India, as usual, is at crossroads.
Market Commentary
A year, they say, is a long time in politics. A month, it seems could redefine a Fund Manager’s career! If this quarter was viewed in totality, then it would be unremarkable by the end results, a continuation of the trend of the previous three quarters of FY 19. However, this may be far from the view for most market participants. For the quarter, Nifty continued its dominance, registering a move of 7.0%, while Nifty Midcap was up 2.1% and Nifty Smallcap was up 3.5%. For the year, the gap between Nifty and Nifty Smallcap narrowed from 33% to 29.3%, with Nifty being + 14.9% and Nifty Small cap registering -14.4% decline. However, from the low of Feb’19 till the end of March’19, Nifty Small cap recovered smartly by +17% while Nifty rose by +10%. While to most this would appear to be driven by geopolitical standoff with Pakistan and the strong action of the Modi Government, it could also be attributed to a rally in small cap stocks across major Asian markets led by China. Either way, no one is trying to pinpoint the reason. With the end of fiscal year looming, help from any quarter for the beleaguered fund Manager was welcome. Increasingly, the sentiment of a return of Modi government and hope for a more “reformist” approach in the second term is increasingly finding favour – political uncertainty in the minds of investors appears to have reduced significantly. The consensus view, barring some unlikely event, would be betting on a return of NDA Government.

If politics looks a lot clearer today than it was at the start of the last quarter, economic growth outlooks appears to be most
impacted. In a perverse fashion, weaker economic outlook should embolden RBI to take strong action in the forthcoming
policy meet on April 4th. The durability of economic data, whether GDP or CPI or job creation, continues to colour economic
outlook. Currently, a slowdown in Auto sales appears to be the most followed economic data point shaping view on the
economic outlook. How correct this may be the case remains unclear, but as one of the few data points available without any
“massaging” it may be warranting too much attention. El Nino warning of a sub-par monsoon in 2019 has already been made
by one forecaster. Unless economic activity nosedives dramatically, earnings growth forecast for FY 20 should hover around 18-
20%, driven by Corporate banks and Metal sectors. This takes into account a more subdued earnings growth across several of
the Stable segment sectors. Hence, slowdown in economic growth should not result in earnings growth slowdown for FY 20.
Data Source: Bloomberg
Data Source: Bloomberg
| Equity Markets | Index | % Change YTD | % Change MTD | P/E |
| Nifty | 11,623.90 | 7.01% | 7.70% | 18.24 |
| Sensex | 38,672.91 | 7.22% | 7.82% | 18.72 |
| Dow Jones | 25,928.68 | 11.15% | 0.05% | 16.03 |
| Shanghai | 3,090.76 | 23.93% | 5.09% | 12.15 |
| Nikkei | 21,205.81 | 5.95% | -0.84% | 14.96 |
| Hang Sang | 29,051.36 | 12.40% | 1.46% | 11.63 |
| FTSE | 7,279.19 | 8.19% | 2.89% | 12.98 |
| MSCI E.M. (USD) | 1,058.13 | 9.56% | 0.68% | 12.76 |
| MSCI D.M.(USD) | 2,107.74 | 11.88% | 1.05% | 15.95 |
| MSCI India (INR) | 1,338.65 | 6.01% | 6.27% | 18.29 |
| Currency & Commodities | Last Price % | Change YTD % | Change MTD |
| USD / INR | 69.161 | -0.87% | -2.24% |
| Dollar Index | 97.28 | 1.16% | 1.17% |
| Gold | 1,292.30 | 0.77% | -1.60% |
| WTI (Nymex) | 60.14 | 32.44% | 5.10% |
| Brent Crude | 68.39 | 27.12% | 3.57% |
| India Macro Analysis | Latest | Equity Flows | USD Mn |
| GDP | 6.60 | FII (USD mln) | |
| IIP | 1.70 | YTD | 6,845.75 |
| Inflation (WPI Monthly) | 2.93 | MTD | 4,767.84 |
| Inflation (CPI Monthly) | 2.57 | *DII (USD mln) | |
| Commodity (CRB Index) | 412.83 | YTD | 217.77 |
| Source: Bloomberg, SEBI | MTD | -1,097.46 | |
| *DII : Domestic Mutual Funds Data as on Data as on 31stMarch 2019 | |||

