Commentary - Equity Outlook
Mr. Anoop Bhaskar
Head - Equity

WHAT WENT BY
The year when hero became zero: After a sunshine filled 2017, 2018 could be best described a bleary, windy winter for Indian investors, especially those
investing through mutual funds. Across segments, out of the 180 odd open-ended equity funds only 20 open ended funds posted positive returns. Easily the
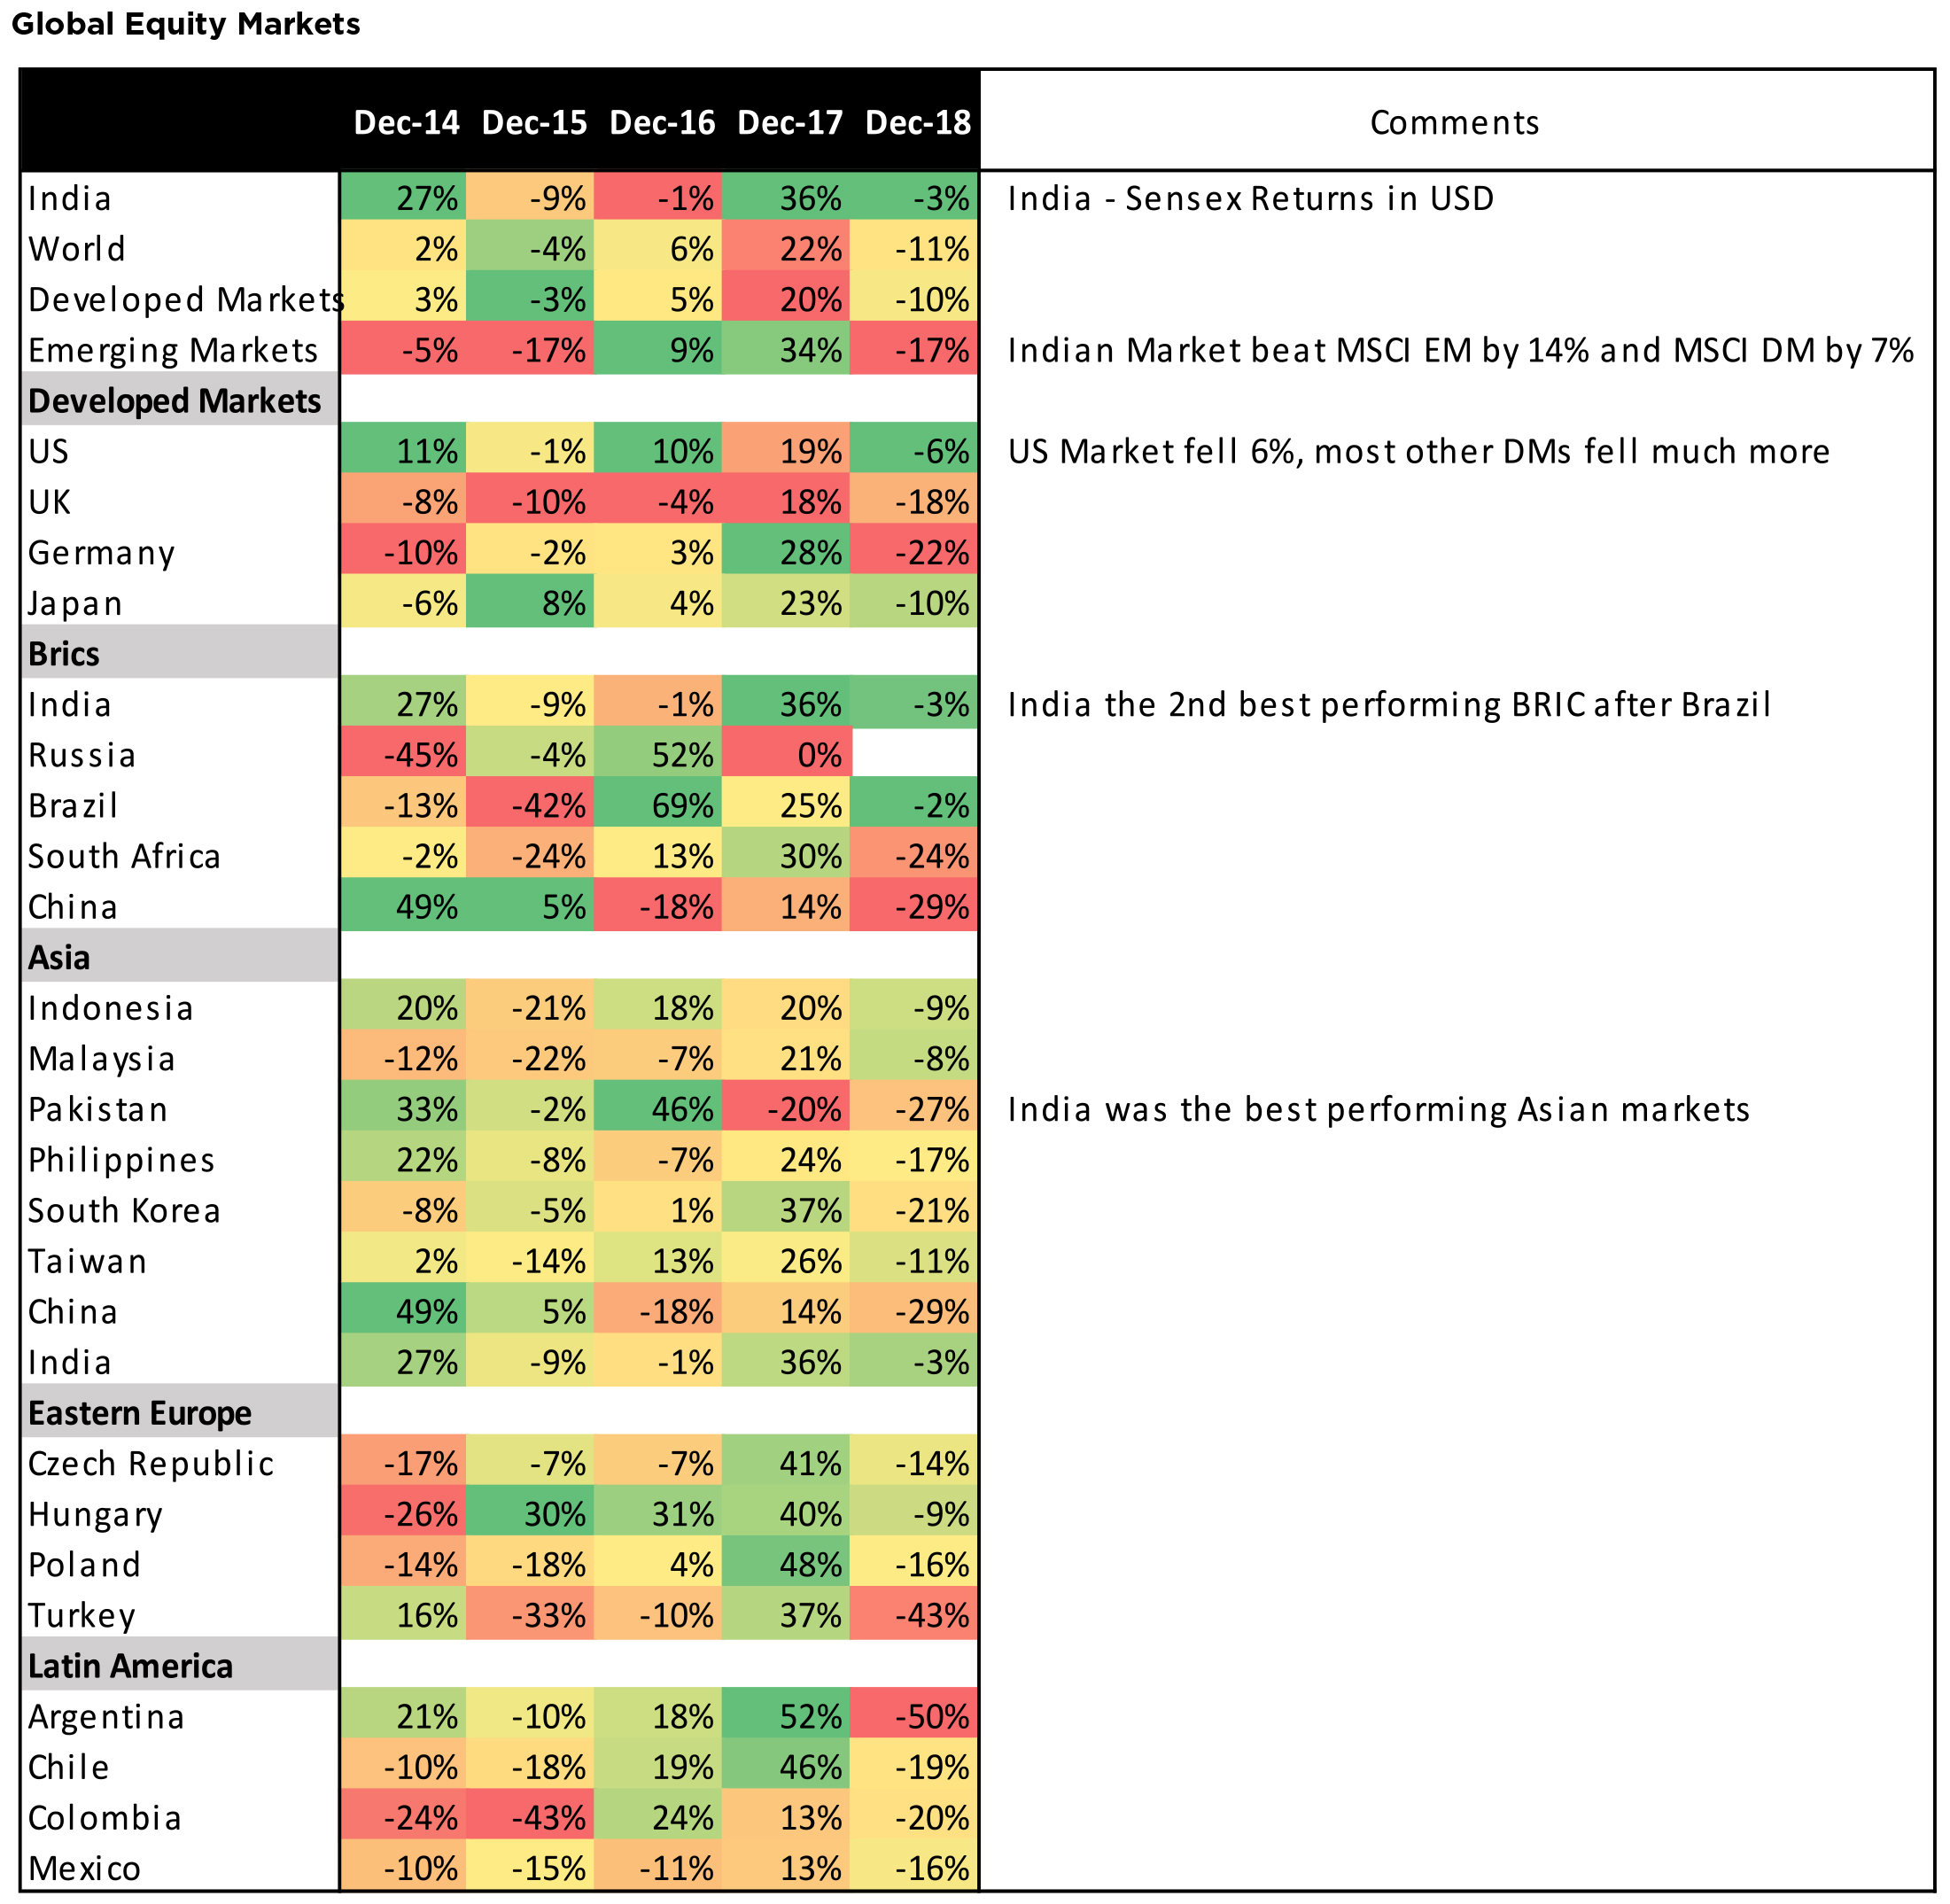
lowest percentage in a decade. To add salt to injury, SENSEX (even in US$ terms) emerged as the #2 Index across the world. SENSEX outperformance was
breathtaking, best performing index in Asia, outperforming MSCI emerging Market Index by a whopping 14%.
Most MF investors, unfortunately, were not celebrating this podium finish. Across MF categories, 20 funds (open ended diversified) reported positive returns
with 10 of them reporting less than +1% return. Even in the large cap category, only 6 out of the 27 funds reported positive returns. No fund beat the SENSEX
TRI and 2 funds beat the NIFTY TRI. No wonder, investors faced with the scale of underperformance across categories, renewed interest in Indexing/ETF
investing. On the PMS/AIF front, where most of the investments were made in small and mid-caps, the story should have been more acute; small solace for
the MF industry.
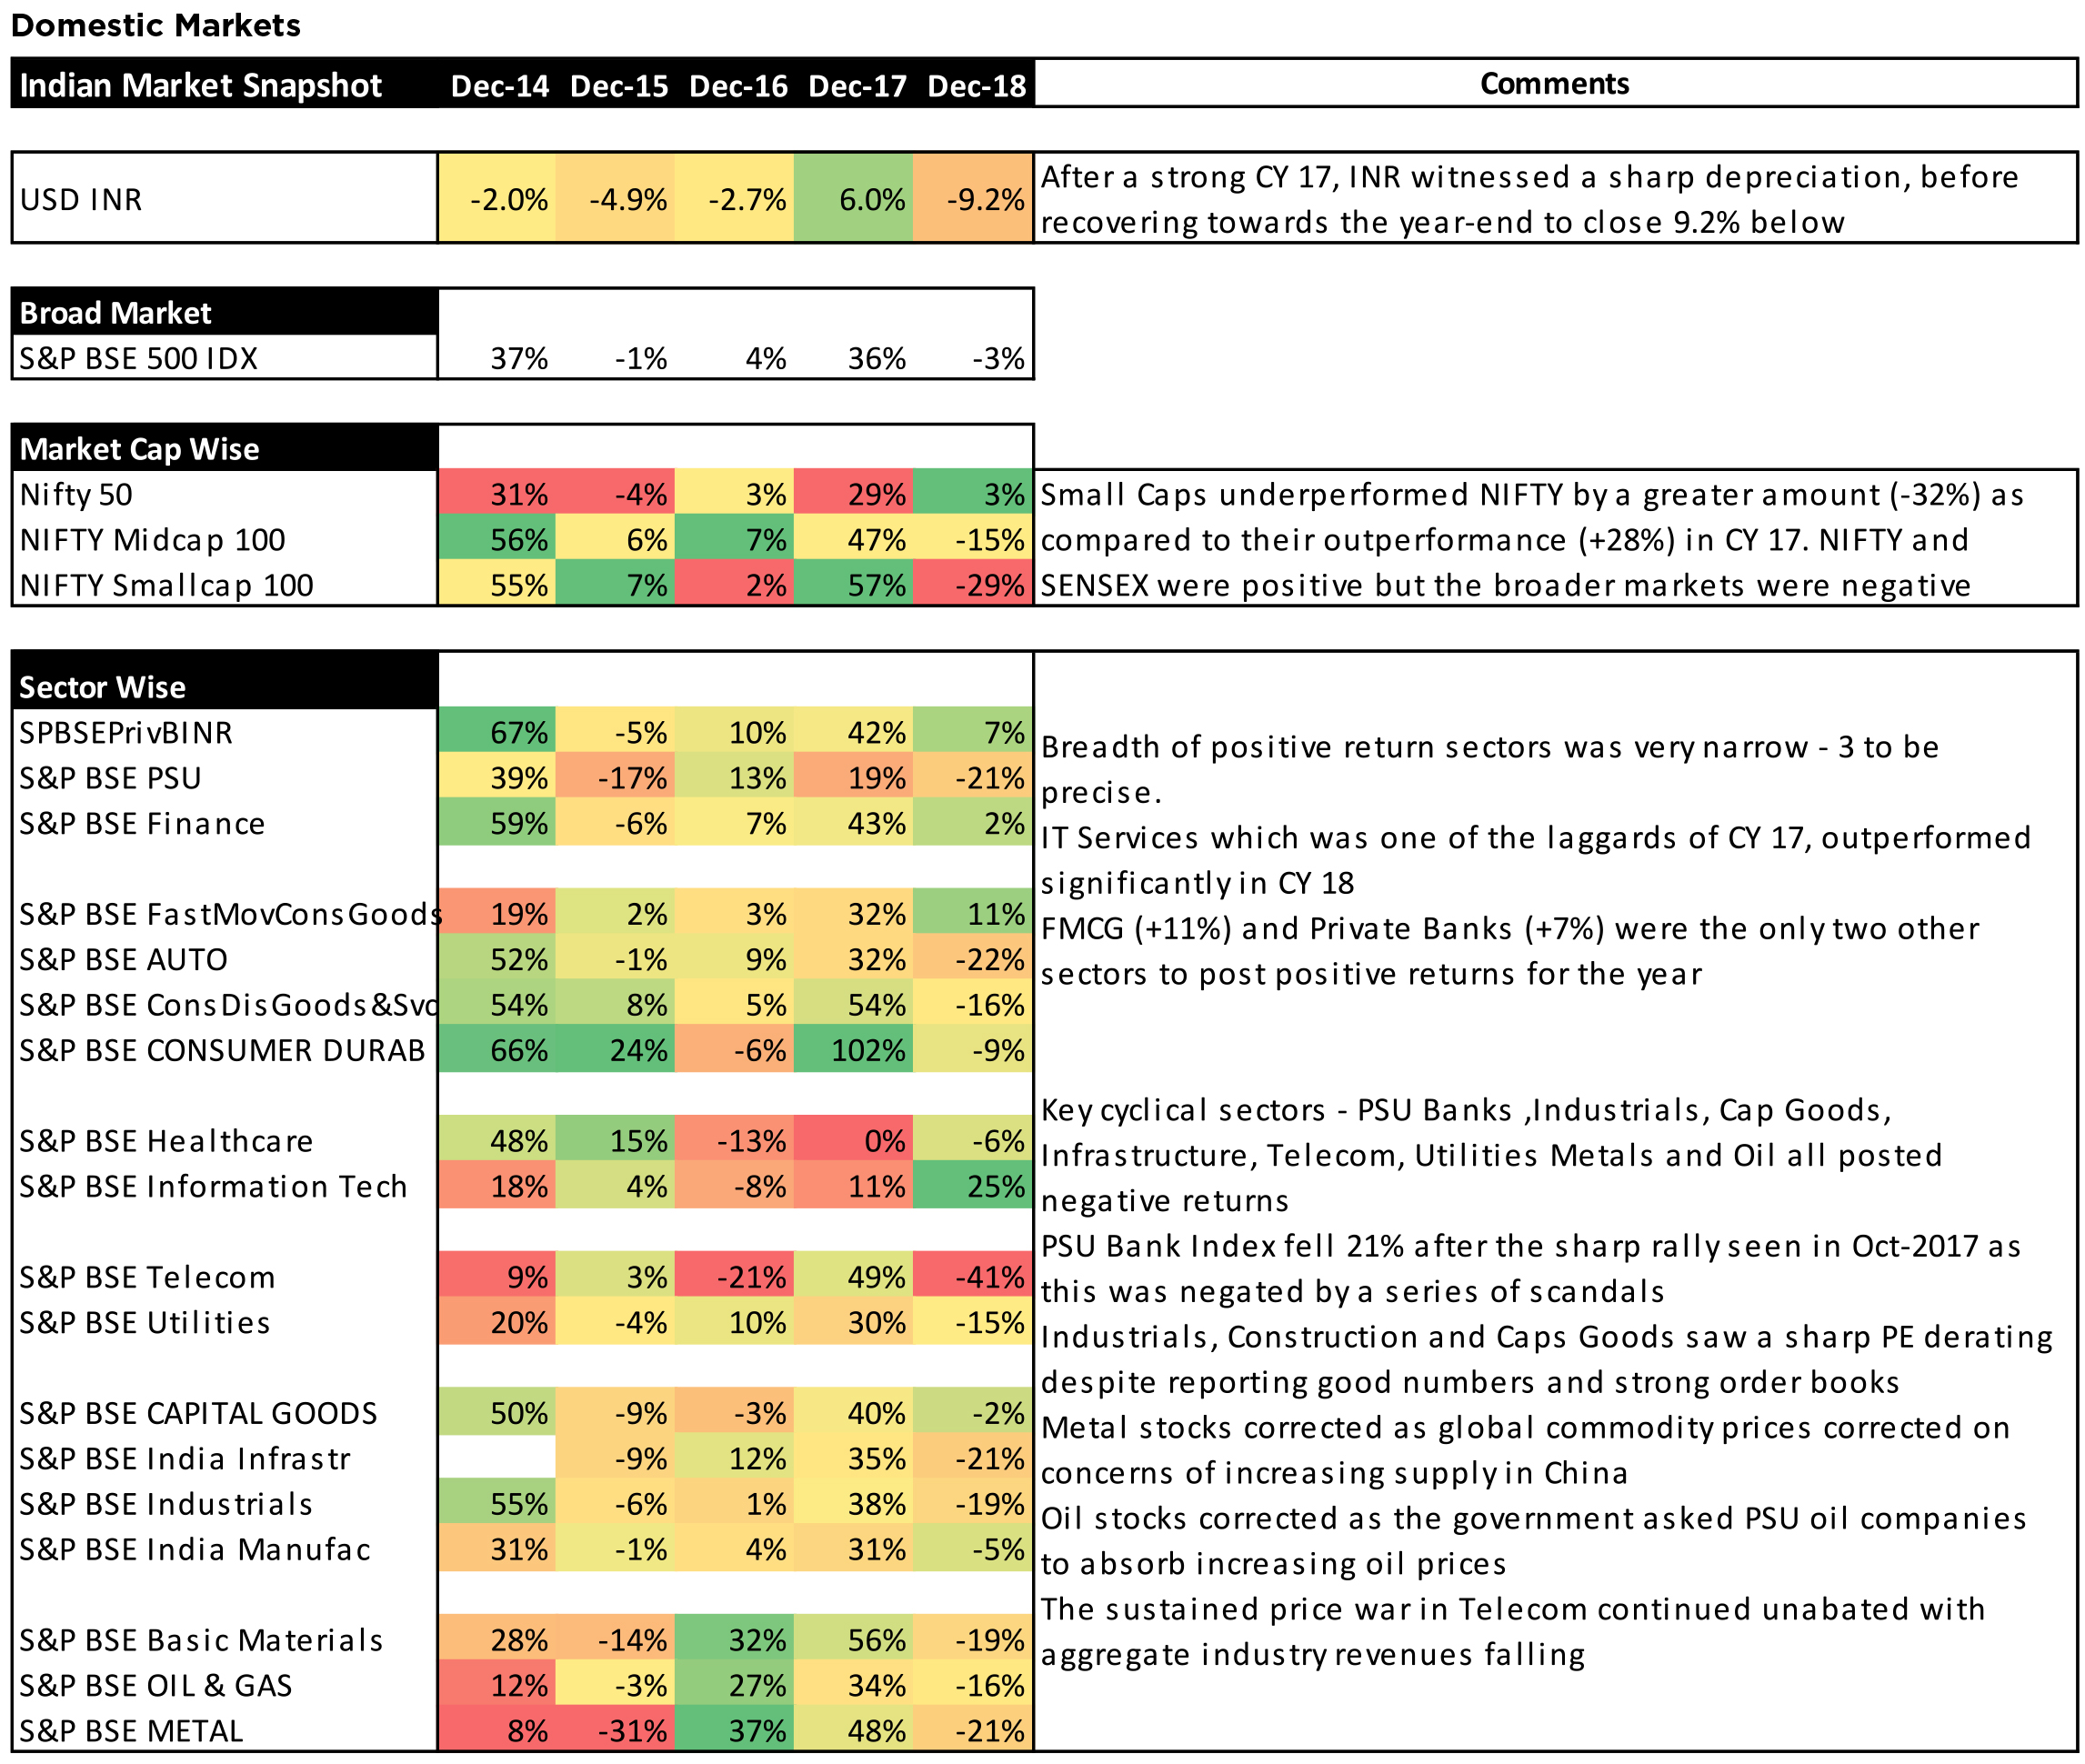
The key reason for the skewness in returns was the narrow contribution of stocks and sectors to returns. The largest 10 stocks in the NIFTY Index recorded a return of +15.0% as compared to 3.2% for the NIFTY Index. Only 3 sectors – IT Services, Private Banks and FMCG gave positive returns. The below tables depict the narrow distribution of returns
• At 34% of the total stocks, Large Caps had the highest proposition of positive returns followed by midcaps at 27% and small caps only 14%
• Most stocks and portfolios gave significant negative returns
• Only 21% of the BSE500 stocks gave positive returns
• 32% of Large Caps, 43% of Mid-Caps and 66% of Small Caps fell in excess of -20%
Given the last two year’s trend – 2017 was the year of small and mid-caps and 2018 belonged to the largest of the large caps. What augurs for investors going forward? While refraining from predicting, several issues need to be highlighted:
From the bottom of Sep’13 to the high of Jan’18, small caps were on a dream run. In the current fall, the excesses of small caps may have well endured a price correction, though markets could witness a reasonably long time correction. While price correction at the index level and individual stock level may be behind, the next few quarters will witness “Manthan” – churning of positions from older hands to newer - weaker to stronger. However, the concern on valuations, which on hindsight, appeared fairly straight forward in December 2017, is not any more the issue. While it is difficult to predict how long a time correction lasts, price destruction to a large extent is behind us.
Entwined with small caps is the debacle of “Cyclical” segment – Private sector corporate focused banks; PSU banks; Infrastructure related NBFCs; Cement;
Commodities; Telecom; Power Utilities; Construction & Capital Goods. This was the other segment which was pummeled by the markets after a shiny 2017.
Will this recover some of the lost sheen? Valuations appear to be in favour, though investor confidence may not be as supple as it was in 2017.
Politics will hold the center stage at least in the first half of 2019, and should reduce in relevance in the second half. This is based on the premise that the largest party in any coalition has over 180 seats and we have a modicum of a stable government.
Lastly, global markets are facing a headwind of “QT” Quantitative tightening, the reverse of QE. While the US Fed has already commenced the shrinkage of its balance sheet, down roughly $400bn and estimated to reduced further by $50bn per month. Tightening in Europe should be announced by the ECB in the second half of CY19. Japan, though, continues to maintain a loose monetary policy. China, given the slowdown, can hardly afford to tighten too quickly.
In this context, a “non-US trained Economist” at the RBI’s helm may be the much needed salve that Indian investors needed. We expect currencies to remain volatile.
Finally, for investors who are ruing their luck of not being in those 20 funds which registered positive returns, 10 funds were in the bottom quartile, 6 in Q3 and only 3 were in the top two quartiles in CY 2017.
Currencies and Commodities
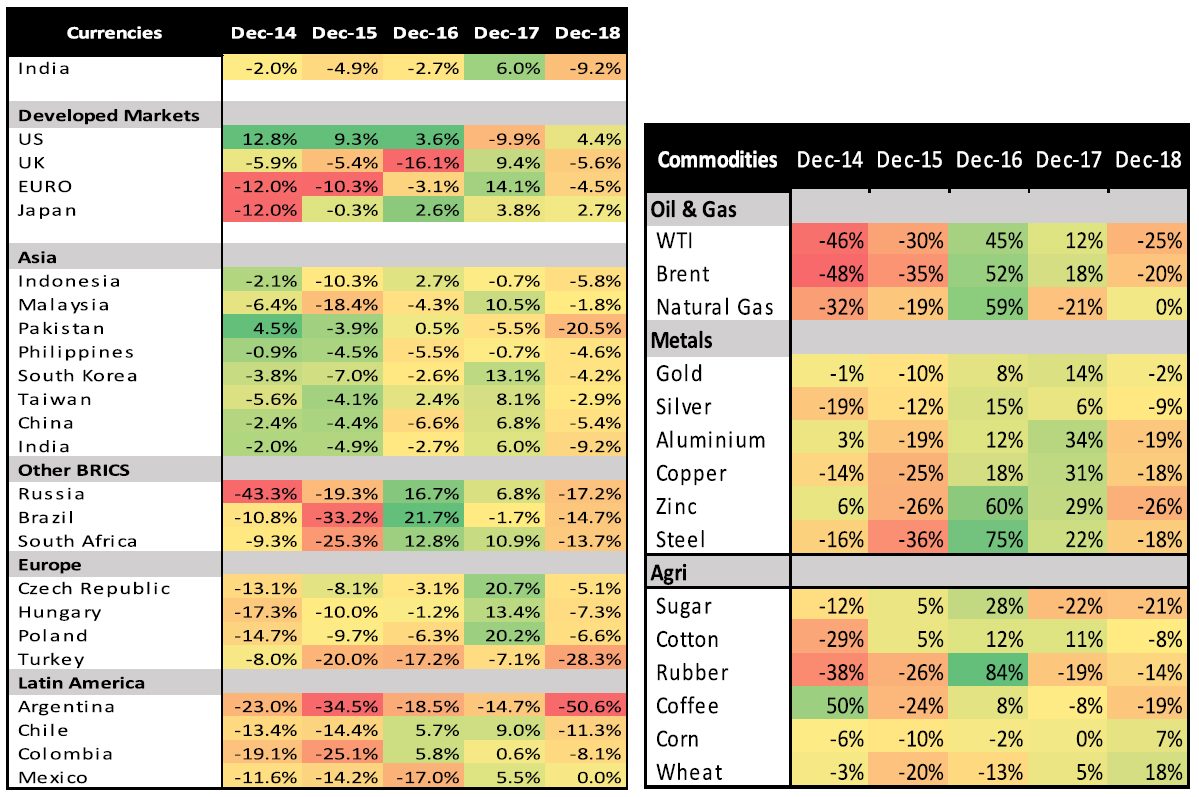
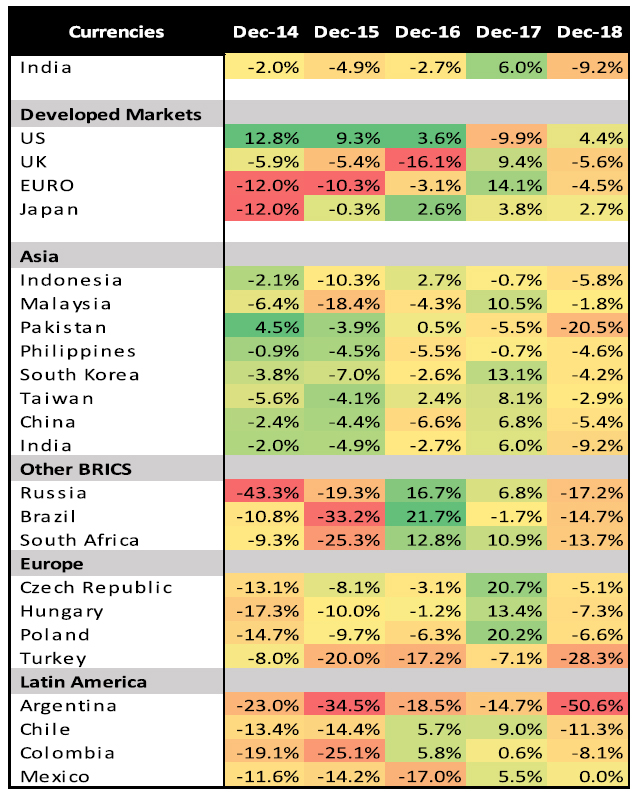
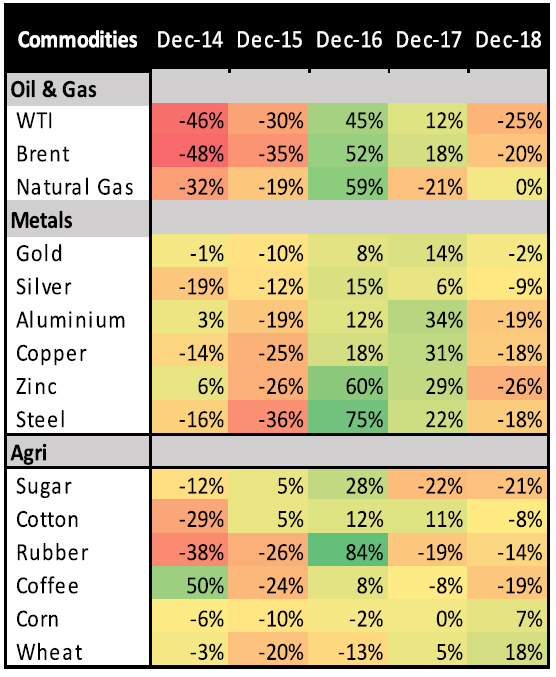
The Dollar Index appreciated +4.4% in CY 18, causing most global currencies to depreciate. The INR (-9%) was in the middle of the pack. Most commodities fell in CY 18 led by Oil. Oil saw a sharp 20-25% fall in CY 18 after two previous positive years. Most metals fell in CY 18 on fears of global growth slowdown and increasing supply in China.

The key reason for the skewness in returns was the narrow contribution of stocks and sectors to returns. The largest 10 stocks in the NIFTY Index recorded a return of +15.0% as compared to 3.2% for the NIFTY Index. Only 3 sectors – IT Services, Private Banks and FMCG gave positive returns. The below tables depict the narrow distribution of returns
• At 34% of the total stocks, Large Caps had the highest proposition of positive returns followed by midcaps at 27% and small caps only 14%
• Most stocks and portfolios gave significant negative returns
• Only 21% of the BSE500 stocks gave positive returns
• 32% of Large Caps, 43% of Mid-Caps and 66% of Small Caps fell in excess of -20%
| BSE500 | Large Cap | Mid Cap | Small Cap | Total |
| >20% | 16% | 14% | 6% | 10% |
| 0 to 20% | 18% | 13% | 8% | 11% |
| -20% to 0% | 34% | 30% | 21% | 27% |
| -40% to -20% | 24% | 30% | 33% | 30% |
| -60% to -40% | 4% | 10% | 25% | 16% |
| <-60% | 4% | 3% | 8% | 6% |
Given the last two year’s trend – 2017 was the year of small and mid-caps and 2018 belonged to the largest of the large caps. What augurs for investors going forward? While refraining from predicting, several issues need to be highlighted:
From the bottom of Sep’13 to the high of Jan’18, small caps were on a dream run. In the current fall, the excesses of small caps may have well endured a price correction, though markets could witness a reasonably long time correction. While price correction at the index level and individual stock level may be behind, the next few quarters will witness “Manthan” – churning of positions from older hands to newer - weaker to stronger. However, the concern on valuations, which on hindsight, appeared fairly straight forward in December 2017, is not any more the issue. While it is difficult to predict how long a time correction lasts, price destruction to a large extent is behind us.
Entwined with small caps is the debacle of “Cyclical” segment – Private sector corporate focused banks; PSU banks; Infrastructure related NBFCs; Cement;
Commodities; Telecom; Power Utilities; Construction & Capital Goods. This was the other segment which was pummeled by the markets after a shiny 2017.
Will this recover some of the lost sheen? Valuations appear to be in favour, though investor confidence may not be as supple as it was in 2017.
Politics will hold the center stage at least in the first half of 2019, and should reduce in relevance in the second half. This is based on the premise that the largest party in any coalition has over 180 seats and we have a modicum of a stable government.
Lastly, global markets are facing a headwind of “QT” Quantitative tightening, the reverse of QE. While the US Fed has already commenced the shrinkage of its balance sheet, down roughly $400bn and estimated to reduced further by $50bn per month. Tightening in Europe should be announced by the ECB in the second half of CY19. Japan, though, continues to maintain a loose monetary policy. China, given the slowdown, can hardly afford to tighten too quickly.
In this context, a “non-US trained Economist” at the RBI’s helm may be the much needed salve that Indian investors needed. We expect currencies to remain volatile.
Finally, for investors who are ruing their luck of not being in those 20 funds which registered positive returns, 10 funds were in the bottom quartile, 6 in Q3 and only 3 were in the top two quartiles in CY 2017.
Currencies and Commodities
The Dollar Index appreciated +4.4% in CY 18, causing most global currencies to depreciate. The INR (-9%) was in the middle of the pack. Most commodities fell in CY 18 led by Oil. Oil saw a sharp 20-25% fall in CY 18 after two previous positive years. Most metals fell in CY 18 on fears of global growth slowdown and increasing supply in China.


| Equity Markets | Index | % Change YTD | % Change MTD | P/E |
| Nifty | 10,862.55 | 3.15% | -0.13% | 19.49 |
| Sensex | 36,068.33 | 5.91% | -0.35% | 20.84 |
| Dow Jones | 23,327.46 | -5.63% | -8.66% | 14.27 |
| Shanghai | 2,493.90 | -24.59% | -3.64% | 9.36 |
| Nikkei | 20,014.77 | -12.08% | -10.45% | 14.72 |
| Hang Sang | 25,845.70 | -13.61% | -2.49% | 10.08 |
| FTSE | 6,728.13 | -12.48% | -3.61% | 11.77 |
| MSCI E.M. (USD) | 965.67 | -16.64% | -2.92% | 10.91 |
| MSCI D.M.(USD) | 1,883.90 | -10.44% | -7.71% | 13.96 |
| MSCI India (INR) | 1,262.73 | -0.19% | -0.01% | 20.09 |
| Currency & Commodities | Last Price % | Change YTD % | Change MTD |
| USD / INR | 69.768 | 9.23% | 0.26% |
| Dollar Index | 96.17 | 4.40% | -1.13% |
| Gold | 1,282.45 | -1.58% | 4.90% |
| WTI (Nymex) | 45.41 | -24.84% | -10.84% |
| Brent Crude | 53.80 | -19.55% | -8.36% |
| India Macro Analysis | Latest | Equity Flows | USD Mn |
| GDP | 7.10 | FII (USD mln) | |
| IIP | 8.10 | YTD | -5,758.31 |
| IIP | 4.30 | YTD | -4,557.62 |
| Inflation (WPI Monthly) | 4.64 | MTD | 332.29 |
| Inflation (CPI Monthly) | 2.33 | *DII (USD mln) | |
| Commodity (CRB Index) | 409.17 | YTD | 17,484.86 |
| Source: Bloomberg, SEBI | MTD | 412.12 | |
| *DII : Domestic Mutual Funds Data as on Data as on 31stDecember 2018 | |||

