IDFC Core Equity Fund
(previously known as IDFC Classic Equity Fund)
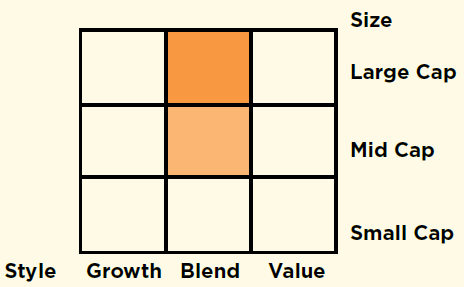
Large & Mid Cap Fund - An open ended equity scheme investing in both large cap and mid cap stocks

IDFC Core Equity Fund
(previously known as IDFC Classic Equity Fund)
Large & Mid Cap Fund - An open ended equity scheme investing in both large cap and mid cap stocks
|
|
|
|
|

|


About the Fund: IDFC Core Equity Fund is a diversified equity fund with a large and mid cap bias currently. The focus of the fund is to build a portfolio of Quality companies while being cognizant of the relative valuation.
Category: Large & Mid Cap
 : ₹ 2,961.17 Crores
AUM or assets under management refers to the recent / updated cumulative market value of investments managed by a mutual fund or any investment firm.
: ₹ 2,968.13 Crores
AUM or assets under management refers to the recent / updated cumulative market value of investments managed by a mutual fund or any investment firm.
:
An employee of the asset management company such as a mutual fund or life insurer, who manages investments of the scheme. He is usually part of a larger team of fund managers and research analysts.
Other Parameter:
| Beta
Beta is a measure of an investment's volatility vis-a-vis the market. Beta of less than 1 means that the security will be less volatile than the market. A beta of greater than 1 implies that the security's price will be more volatile than the market. | 0.98 |
| R Square | 0.93 |
| Standard Deviation (Annualized)
Standard deviation is a statistical measure of the range of an investment's performance. When a mutual fund has a high standard deviation, its means its range of performance is wide, implying greater volatility. | 12.91% |
| Sharpe*
The Sharpe Ratio, named after its founder, the Nobel Laureate William Sharpe, is a measure of risk-adjusted returns. It is calculated using standard deviation and excess return to determine reward per unit of risk. | 0.42 |
| Portfolio Turnover | |
| Equity | 0.38 |
| Aggregate^ | 0.63 |
| Expense Ratio | |
| Regular | 1.97% |
| Direct | 0.73% |
SIP (Minimum Amount): ₹ 100/- (Minimum 6 instalments)
SIP Frequency: Monthly
SIP Dates (Monthly): Investor may choose any day of the month except 29th, 30th and 31st as the date of instalment.
Investment Objective: Click here
Minimum Investment Amount : ₹ 5,000/- and any amount thereafter
Option Available: Growth, Dividend - (Payout, Reinvestment and Sweep (from Equity Schemes to Debt Schemes only))
:
Exit load is charged at the time an investor redeems the units of a mutual fund. The exit load is deducted from the prevailing NAV at the time of redemption. For instance, if the NAV is ₹ 100 and the exit load is 1%, the redemption price would be ₹ 99 per unit.
NAV (₹)
| Regular Plan | Growth | 45.41 |
| Regular Plan | Dividend | 14.88 |
| Name | % of NAV |
| Equity and Equity related Instruments | 98.81% |
| Banks | 30.11% |
| oHDFC Bank | 6.18% |
| oICICI Bank | 5.82% |
| ICICI Bank - Equity Futures | 1.04% |
| oState Bank of India | 5.23% |
| State Bank of India - Equity Futures | 0.28% |
| oAxis Bank | 4.57% |
| Axis Bank - Equity Futures | 0.62% |
| oKotak Mahindra Bank | 1.95% |
| RBL Bank | 1.91% |
| The Federal Bank | 1.34% |
| City Union Bank | 0.44% |
| Punjab National Bank | 0.19% |
| Punjab National Bank - Equity Futures | 0.55% |
| Pharmaceuticals | 7.76% |
| IPCA Laboratories | 1.73% |
| Sun Pharmaceutical Industries | 1.48% |
| Dr. Reddy's Laboratories | 1.40% |
| Cadila Healthcare | 0.92% |
| Indoco Remedies | 0.89% |
| Alkem Laboratories | 0.75% |
| Natco Pharma | 0.59% |
| Auto Ancillaries | 5.59% |
| MRF | 1.74% |
| Apollo Tyres | 1.35% |
| Exide Industries | 0.98% |
| Balkrishna Industries | 0.73% |
| Minda Industries | 0.46% |
| Asahi India Glass | 0.33% |
| Construction Project | 5.53% |
| oLarsen & Toubro | 3.97% |
| Larsen & Toubro - Equity Futures | 0.22% |
| KEC International | 1.34% |
| Finance | 4.97% |
| M&M Financial Services | 1.76% |
| Sundaram Finance | 1.12% |
| ICICI Securities | 0.92% |
| Max Financial Services | 0.73% |
| Mas Financial Services | 0.43% |
| Petroleum Products | 4.76% |
| oReliance Industries | 2.97% |
| Bharat Petroleum Corporation | 0.96% |
| Hindustan Petroleum Corporation | 0.83% |
| Software | 4.66% |
| oInfosys | 3.12% |
| Mastek | 0.61% |
| Birlasoft | 0.59% |
| KPIT Technologies | 0.34% |
| Cement | 4.65% |
| ACC | 1.58% |
| The Ramco Cements | 1.40% |
| Name | % of NAV |
| Ambuja Cements | 1.36% |
| Deccan Cements | 0.32% |
| Retailing | 4.62% |
| oFuture Retail | 2.32% |
| Future Lifestyle Fashions | 1.31% |
| Aditya Birla Fashion and Retail | 0.99% |
| Consumer Non Durables | 4.32% |
| Colgate Palmolive (India) | 1.46% |
| GlaxoSmithKline Consumer Healthcare | 1.46% |
| Nestle India | 1.10% |
| Emami | 0.29% |
| Power | 4.00% |
| NTPC | 1.13% |
| Kalpataru Power Transmission | 1.10% |
| Torrent Power | 1.09% |
| Nava Bharat Ventures | 0.68% |
| Consumer Durables | 3.48% |
| Titan Company | 1.66% |
| Voltas | 0.99% |
| Crompton Greaves Consumer Electricals | 0.84% |
| Industrial Products | 3.29% |
| AIA Engineering | 1.39% |
| Supreme Industries | 1.17% |
| Cummins India | 0.72% |
| Industrial Capital Goods | 2.35% |
| Thermax | 1.23% |
| Bharat Electronics | 1.12% |
| Hotels, Resorts And Other Recreational Activities | 2.27% |
| oThe Indian Hotels Company | 2.27% |
| Auto | 1.42% |
| Mahindra & Mahindra | 1.10% |
| Maruti Suzuki India | 0.32% |
| Chemicals | 1.39% |
| Deepak Nitrite | 0.90% |
| Tata Chemicals | 0.48% |
| Ferrous Metals | 1.25% |
| Jindal Steel & Power | 1.25% |
| Gas | 0.99% |
| GAIL (India) | 0.87% |
| Gujarat Gas | 0.12% |
| Non - Ferrous Metals | 0.83% |
| National Aluminium Company | 0.83% |
| Fertilisers | 0.58% |
| Coromandel International | 0.58% |
| Preference Shares | 0.005% |
| Media & Entertainment | 0.005% |
| Zee Entertainment Enterprises | 0.005% |
| Net Cash and Cash Equivalent | 1.18% |
| Grand Total | 100.00% |
| oTop 10 Equity Holdings |
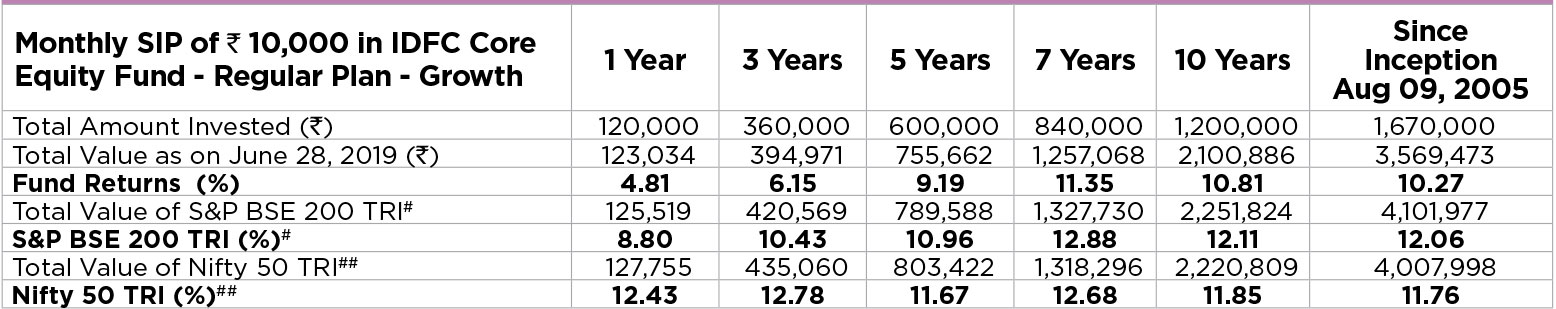
Past performance may or may not be sustained in future.Dividends are assumed to be reinvested and bonus is adjusted. Load is not taken into consideration. To illustrate the advantages of SIP investment, this is how your investment would have grown if you had invested say ₹ 10,000 systematically on the first business Day of every month over a period of time. Returns are calculated by using XIRR approach. XIRR helps in calculating return on investment given an initial and final value and a series of cash inflows and outflows with the correct allowance for the time impact of the transactions. Data as on 28th June 2019
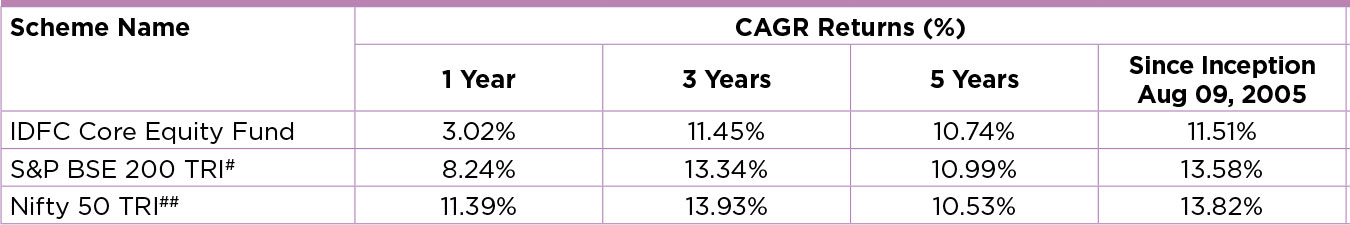
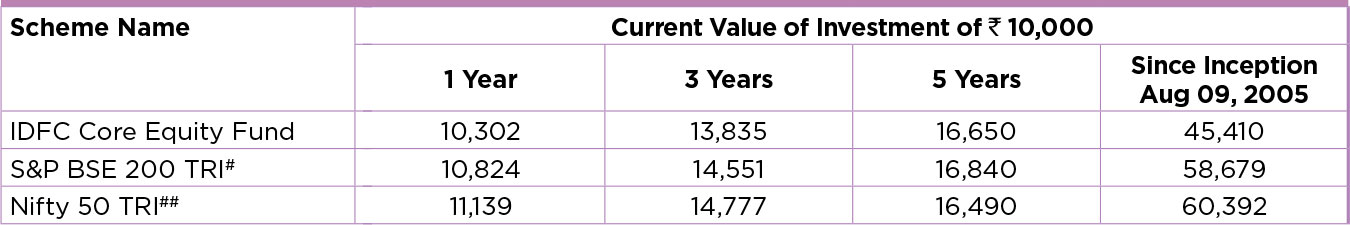
Performance based on NAV as on 28/06/2019. Past performance may or may not be sustained in future.
The performances given are of regular plan growth option.
Click here for other funds managed by the fund manager and refer to the respective fund pages
#Benchmark Returns. ##Alternate Benchmark Returns.
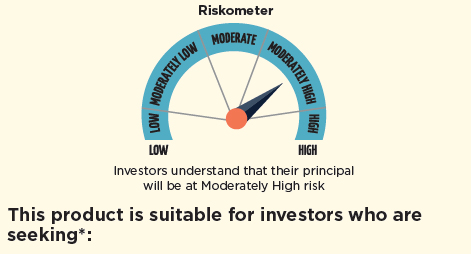
- To create wealth over long term.
- Investment predominantly in equity and equity related instruments in large and mid-cap companies.
* Investors should consult their financial advisers if in doubt about whether the product is suitable for them.
Regular and Direct Plans have different expense structure. Direct Plan shall have a lower expense ratio excluding distribution expenses, commission expenses etc.
*Risk-free rate assumed to be 5.97% (FBIL OVERNIGHT MIBOR as on 28th June 2019). Ratios calculated on the basis of 3 years history of monthly data.
^Portfolio Turnover ratio is calculated as Lower of purchase or sale during the period / Average AUM for the last one year (includes Fixed Income securities and Equity derivatives).
Current Index performance adjusted for the period from since inception to June 28, 2007 with the performance of S&P BSE 200 price return index (Benchmark)
