IDFC Infrastructure Fund
An open ended equity scheme investing in Infrastructure sector
28th February 2019

|

|

IDFC Infrastructure Fund
An open ended equity scheme investing in Infrastructure sector
28th February 2019
FUND FEATURES
About the Fund: A dedicated Infrastructure fund, that invests across the infrastructure value chain with exclusions like Banking, Autos, IT, Pharma and FMCG. It is a diversified portfolio of companies that are participating in and benefitting from the Indian Infrastructure and Infrastructure related activities.
Category: Sectoral
Monthly Avg AUM: ₹ 844.05 Crores
Monthly end AUM: ₹ 847.08 Crores
Inception Date: 8 March 2011
Fund Manager:
Mr. Rajendra Kumar Mishra (w.e.f. 27th June 2013)
Other Parameter:
| Beta | 1.03 |
| R Square | 0.83 |
| Standard Deviation (Annualized) | 19.03% |
| Sharpe* | 0.37 |
| Portfolio Turnover | |
| Equity | 0.45 |
| Aggregate^ | 0.45 |
| Expense Ratio | |
| Regular | 2.49% |
| Direct | 1.03% |
SIP (Minimum Amount): ₹ 100/- (Minimum 6 instalments)
SIP Frequency: Monthly
SIP Dates (Monthly): Investor may choose any day of the month except 29th, 30th and 31st as the date of instalment.
Investment Objective: Click here
Minimum Investment Amount : ₹ 5,000/- and any amount thereafter
Option Available: Growth, Dividend (Payout, Reinvestment and Sweep (from Equity Schemes to Debt Schemes only))
Exit Load: 1.00% if redeemed before 365 days from the date of allotment.
NAV (₹)
| Regular Plan | Growth | 13.39 |
| Regular Plan | Dividend | 12.58 |
PORTFOLIO
| Name | % of NAV |
| Equity and Equity related Instruments | 95.61% |
| Construction Project | 20.25% |
| oLarsen & Toubro | 8.01% |
| oNCC | 3.39% |
| oEngineers India | 3.32% |
| Sadbhav Engineering | 2.70% |
| H.G. Infra Engineering | 1.49% |
| RITES | 1.33% |
| Transportation | 16.10% |
| oAdani Ports and Special Economic Zone | 5.85% |
| oContainer Corporation of India | 5.23% |
| oTransport Corporation of India | 2.84% |
| Gateway Distriparks | 1.40% |
| Navkar Corporation | 0.77% |
| Construction | 13.06% |
| oPNC Infratech | 2.95% |
| NBCC (India) | 2.11% |
| Dilip Buildcon | 1.68% |
| Ahluwalia Contracts (India) | 1.58% |
| Gayatri Projects | 1.31% |
| PSP Projects | 1.16% |
| ITD Cementation India | 1.11% |
| J.Kumar Infraprojects | 0.73% |
| GPT Infraprojects | 0.43% |
| Power | 10.46% |
| oNTPC | 6.16% |
| Torrent Power | 2.72% |
| PTC India | 1.58% |
| Name | % of NAV |
| Cement | 7.81% |
| oUltraTech Cement | 3.84% |
| JK Cement | 2.61% |
| Sagar Cements | 1.36% |
| Gas | 7.47% |
| GAIL (India) | 2.62% |
| Gujarat State Petronet | 2.60% |
| Gujarat Gas | 2.25% |
| Industrial Products | 4.32% |
| Cummins India | 2.68% |
| Kirloskar Brothers | 1.63% |
| Ferrous Metals | 4.15% |
| Jindal Steel & Power | 1.57% |
| Maharashtra Seamless | 1.57% |
| Jindal Saw | 1.01% |
| Petroleum Products | 3.56% |
| oReliance Industries | 3.56% |
| Industrial Capital Goods | 3.36% |
| Siemens | 2.22% |
| ISGEC Heavy Engineering | 1.13% |
| Consumer Durables | 2.04% |
| Blue Star | 2.04% |
| Telecom - Equipment & Accessories | 1.61% |
| Tejas Networks | 1.61% |
| Hotels, Resorts And Other Recreational Activities | 1.40% |
| Taj GVK Hotels & Resorts | 1.40% |
| Net Cash and Cash Equivalent | 4.39% |
| Grand Total | 100.00% |
oTop 10 Equity Holdings |
SIP PERFORMANCE
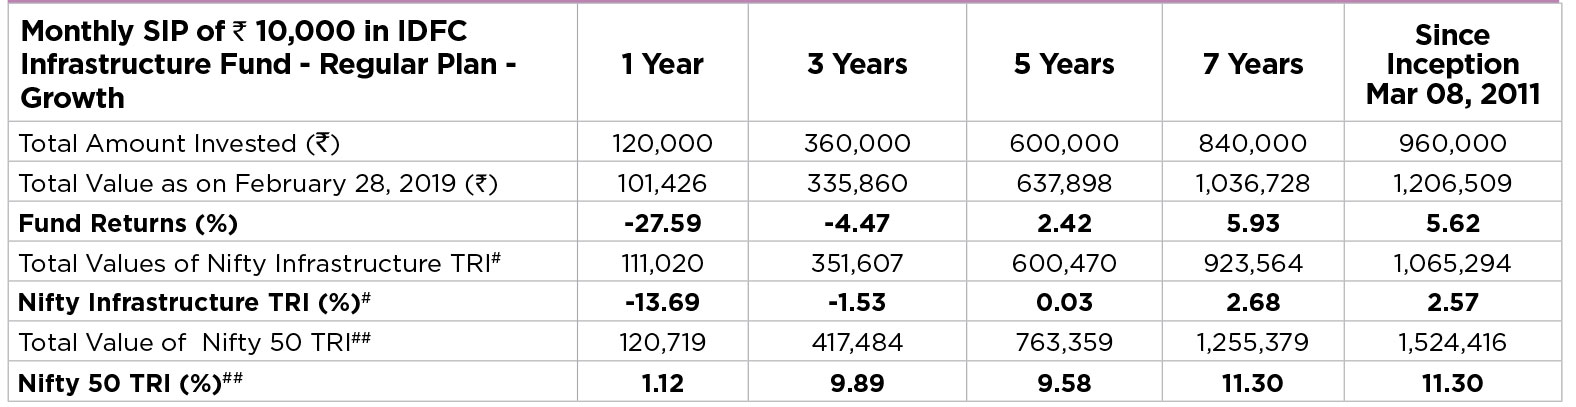
Past performance may or may not be sustained in future.Dividends are assumed to be reinvested and bonus is adjusted. Load is not taken into consideration. To illustrate the advantages of SIP investment, this is how your investment would have grown if you had invested say ₹ 10,000 systematically on the first business Day of every month over a period of time. Returns are calculated by using XIRR approach. XIRR helps in calculating return on investment given an initial and final value and a series of cash inflows and outflows with the correct allowance for the time impact of the transactions. Data as on 28th February 2019
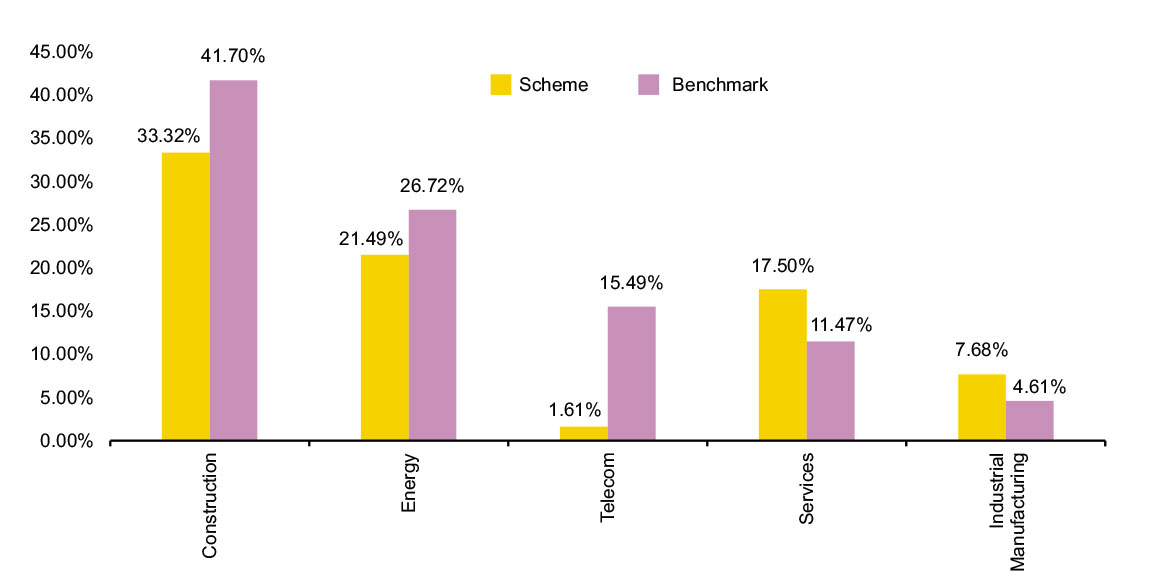
SECTOR ALLOCATION
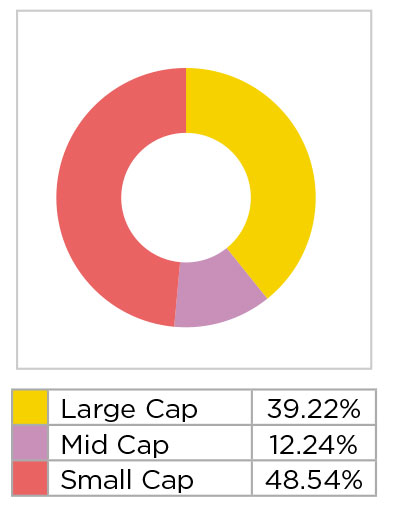
MARKET CAP
PERFORMANCE TABLE
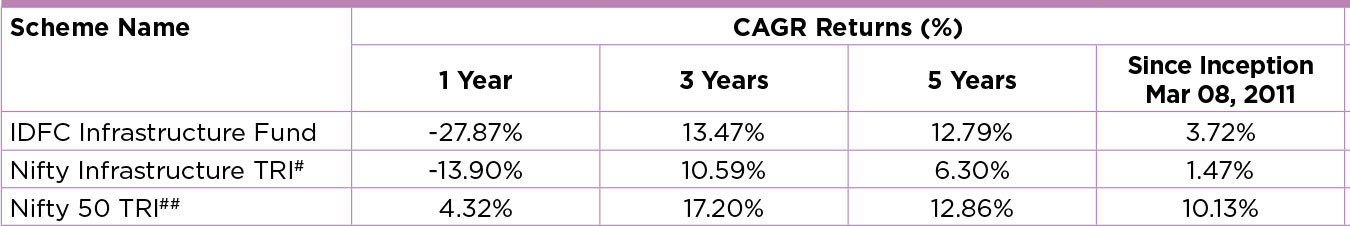

Performance based on NAV as on 28/02/2019. Past performance may or may not be sustained in future.
The performances given are of regular plan growth option.
Click here for other funds managed by the fund manager and refer to the respective fund pages
#Benchmark Returns. ##Alternate Benchmark Returns.
RISKOMETER

- To create wealth over long term.
- Investment predominantly in equity and equity related instruments of companies that are participating in and benefiting from growth in Indian infrastructure and infrastructural related activities.
*Investors should consult their financial advisers if in doubt about whether the product is suitable for them.
Regular and Direct Plans have different expense structure. Direct Plan shall have a lower expense ratio excluding distribution expenses, commission expenses etc.
*Risk-free rate assumed to be 6.35% (FBIL OVERNIGHT MIBOR as on 28th February 2019). Ratios calculated on the basis of 3 years history of monthly data.
^Portfolio Turnover ratio is calculated as Lower of purchase or sale during the period / Average AUM for the last one year (includes Fixed Income securities and Equity derivatives).
