IDFC Multi Cap Fund
(previously known as IDFC Premier Equity Fund)
Multi Cap Fund- An open ended equity scheme investing across large cap, mid cap and small cap stocks

IDFC Multi Cap Fund
(previously known as IDFC Premier Equity Fund)
Multi Cap Fund- An open ended equity scheme investing across large cap, mid cap and small cap stocks
|
|
|
|
|

|


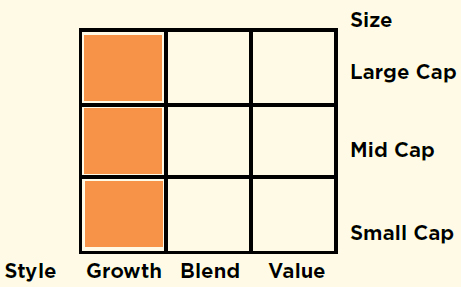
About the Fund: IDFC Multi Cap Fund is a multi-cap Equity Fund.It is a fund that encourages systematic investing.
Category: Multicap
 : ₹ 5,534.43 Crores
AUM or assets under management refers to the recent / updated cumulative market value of investments managed by a mutual fund or any investment firm.
: ₹ 5,588.68 Crores
AUM or assets under management refers to the recent / updated cumulative market value of investments managed by a mutual fund or any investment firm.
:
An employee of the asset management company such as a mutual fund or life insurer, who manages investments of the scheme. He is usually part of a larger team of fund managers and research analysts.
Other Parameter:
| Beta
Beta is a measure of an investment's volatility vis-a-vis the market. Beta of less than 1 means that the security will be less volatile than the market. A beta of greater than 1 implies that the security's price will be more volatile than the market. | 0.94 |
| R Square | 0.84 |
| Standard Deviation (Annualized)
Standard deviation is a statistical measure of the range of an investment's performance. When a mutual fund has a high standard deviation, its means its range of performance is wide, implying greater volatility. | 13.33% |
| Sharpe*
The Sharpe Ratio, named after its founder, the Nobel Laureate William Sharpe, is a measure of risk-adjusted returns. It is calculated using standard deviation and excess return to determine reward per unit of risk. | 0.40 |
| Portfolio Turnover | |
| Equity | 0.39 |
| Aggregate^ | 0.72 |
| Expense Ratio | |
| Regular | 1.99% |
| Direct | 1.34% |
SIP (Minimum Amount): ₹ 100/- (Minimum 6 instalments)
SIP Frequency: Monthly
SIP Dates (Monthly): Investor may choose any day of the month except 29th, 30th and 31st as the date of instalment.
Investment Objective: Click here
Minimum Investment Amount : ₹ 10,000/- and any amount thereafter
(Units of IDFC Multi Cap Fund, shall be available for lump sum subscription w.e.f. May 07, 2018)
Option Available: Growth, Dividend - (Payout, Reinvestment and Sweep (from Equity Schemes to Debt Schemes only))
:
Exit load is charged at the time an investor redeems the units of a mutual fund. The exit load is deducted from the prevailing NAV at the time of redemption. For instance, if the NAV is ₹ 100 and the exit load is 1%, the redemption price would be ₹ 99 per unit.
NAV (₹)
| Regular Plan | Growth | 96.31 |
| Regular Plan | Dividend | 33.46 |
| Name | % of NAV |
| Equity and Equity related Instruments | 98.24% |
| Banks | 31.02% |
| o ICICI Bank | 9.83% |
| o HDFC Bank | 7.57% |
| o Axis Bank | 6.14% |
| o Kotak Mahindra Bank | 3.81% |
| o City Union Bank | 2.83% |
| RBL Bank | 0.83% |
| Consumer Non Durables | 10.71% |
| o Asian Paints | 3.03% |
| Britannia Industries | 1.70% |
| Procter & Gamble Hygiene and Health Care | 1.68% |
| Nestle India | 1.51% |
| Hindustan Unilever | 1.03% |
| GlaxoSmithKline Consumer Healthcare | 0.67% |
| S H Kelkar and Company | 0.55% |
| Jubilant Foodworks | 0.53% |
| Consumer Durables | 10.63% |
| o Bata India | 3.25% |
| o Voltas | 3.03% |
| Crompton Greaves Consumer Electricals | 2.00% |
| Titan Company | 1.64% |
| Greenlam Industries | 0.71% |
| Finance | 9.16% |
| Multi Commodity Exchange of India | 1.66% |
| HDFC Life Insurance Company | 1.57% |
| ICICI Lombard General Insurance Company | 1.37% |
| ICICI Securities | 1.33% |
| Bajaj Finance | 1.30% |
| JM Financial | 1.11% |
| Mas Financial Services | 0.82% |
| Industrial Products | 4.36% |
| Schaeffler India | 1.57% |
| Supreme Industries | 1.16% |
| AIA Engineering | 1.08% |
| Kirloskar Pneumatic Company | 0.56% |
| Construction Project | 4.16% |
| o Larsen & Toubro | 3.71% |
| Power Mech Projects | 0.45% |
| Chemicals | 4.13% |
| Atul | 1.82% |
| Name | % of NAV |
| Pidilite Industries | 1.17% |
| Fine Organic Industries | 1.15% |
| Commercial Services | 3.87% |
| o 3M India | 3.87% |
| Retailing | 3.14% |
| Avenue Supermarts | 1.62% |
| Future Retail | 1.16% |
| Future Lifestyle Fashions | 0.37% |
| Software | 2.75% |
| Infosys | 2.75% |
| Cement | 2.13% |
| UltraTech Cement | 2.13% |
| Industrial Capital Goods | 2.07% |
| Thermax | 0.85% |
| Disa India | 0.57% |
| ABB India | 0.56% |
| ABB Power Products and Systems India | 0.09% |
| Auto Ancillaries | 1.96% |
| Minda Industries | 1.33% |
| MRF | 0.63% |
| IT Consulting & Other Services | 1.94% |
| Cognizant Technology Solutions Corp - International Equities | 1.94% |
| Pharmaceuticals | 1.88% |
| Sun Pharmaceutical Industries | 1.42% |
| Cadila Healthcare | 0.45% |
| Ferrous Metals | 1.27% |
| APL Apollo Tubes | 1.27% |
| Textiles - Cotton | 1.08% |
| Vardhman Textiles | 1.08% |
| Transportation | 0.89% |
| Transport Corporation of India | 0.89% |
| Media & Entertainment | 0.45% |
| Entertainment Network (India) | 0.45% |
| Pesticides | 0.41% |
| Dhanuka Agritech | 0.41% |
| Construction | 0.23% |
| Poddar Housing and Development | 0.23% |
| Net Cash and Cash Equivalent | 1.76% |
| Grand Total | 100.00% |
oTop 10 Equity Holdings |
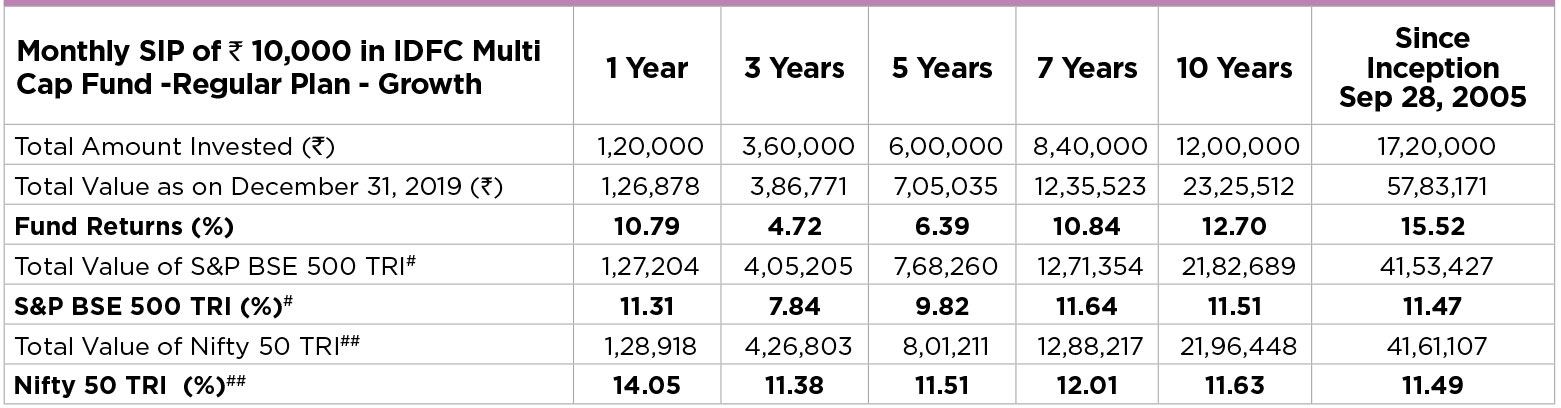
Past performance may or may not be sustained in future.Dividends are assumed to be reinvested and bonus is adjusted. Load is not taken into consideration. To illustrate the advantages of SIP investment, this is how your investment would have grown if you had invested say ₹ 10,000 systematically on the first business Day of every month over a period of time. Returns are calculated by using XIRR approach. XIRR helps in calculating return on investment given an initial and final value and a series of cash inflows and outflows with the correct allowance for the time impact of the transactions. Data as on 31st December 2019
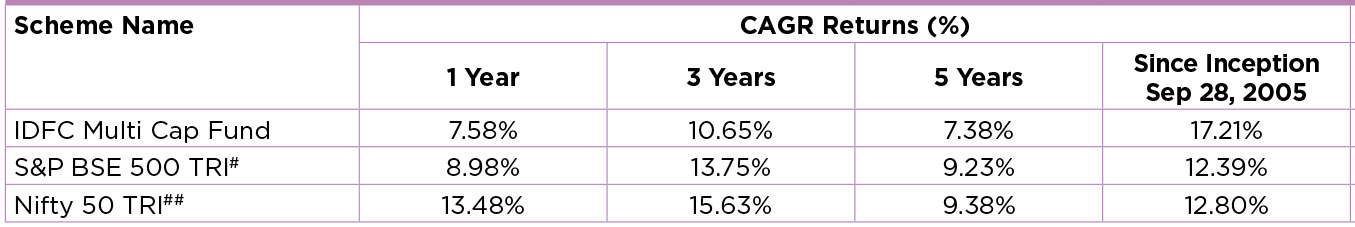
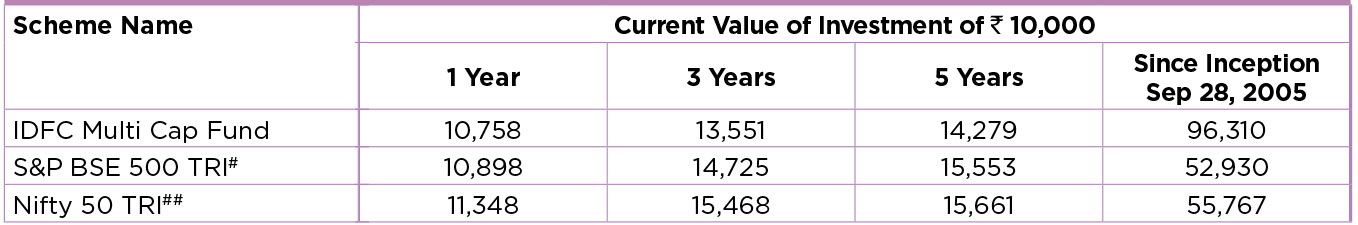
Performance based on NAV as on 31/12/2019. Past performance may or may not be sustained in future.
The performances given are of regular plan growth option.
Click here for other funds managed by the fund manager and refer to the respective fund pages
#Benchmark Returns. ##Alternate Benchmark Returns.
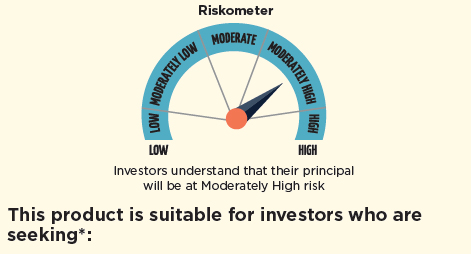
- To create wealth over long term.
- Investment predominantly in equity and equity related instruments across market capitalisation.
* Investors should consult their financial advisers if in doubt about whether the product is suitable for them.
Regular and Direct Plans have different expense structure. Direct Plan shall have a lower expense ratio excluding distribution expenses, commission expenses etc.
*Risk-free rate assumed to be 5.26% (FBIL OVERNIGHT MIBOR as on 31st December 2019).Ratios calculated on the basis of 3 years history of monthly data.
^Portfolio Turnover ratio is calculated as Lower of purchase or sale during the period / Average AUM for the last one year (includes Fixed Income securities and Equity derivatives).
Current Index performance adjusted for the period from since inception to June 28, 2007 with the performance of S&P BSE 500 price return index (Benchmark)
