Commentary
30th June 2020
Mr. Anoop Bhaskar
Head - Equity
WHAT WENT BY
Global Markets
As a financial commentator commented "While the medical world continues to search for a vaccine
for Covid-19, the financial markets were delivered a financial vaccine - fiscal and monetary stimulus by
Central Banks and Governments world over. How strong this intervention or "vaccination" has been, has
influenced the response of the financial market of that country." How true - just a couple of months
back in mid-March it seemed, markets were in a tailspin and by the end of June, most markets had
stabilized, with US leading the Global equities race. After the sharp upward trajectory in April and May,
June witnessed a volatile month.
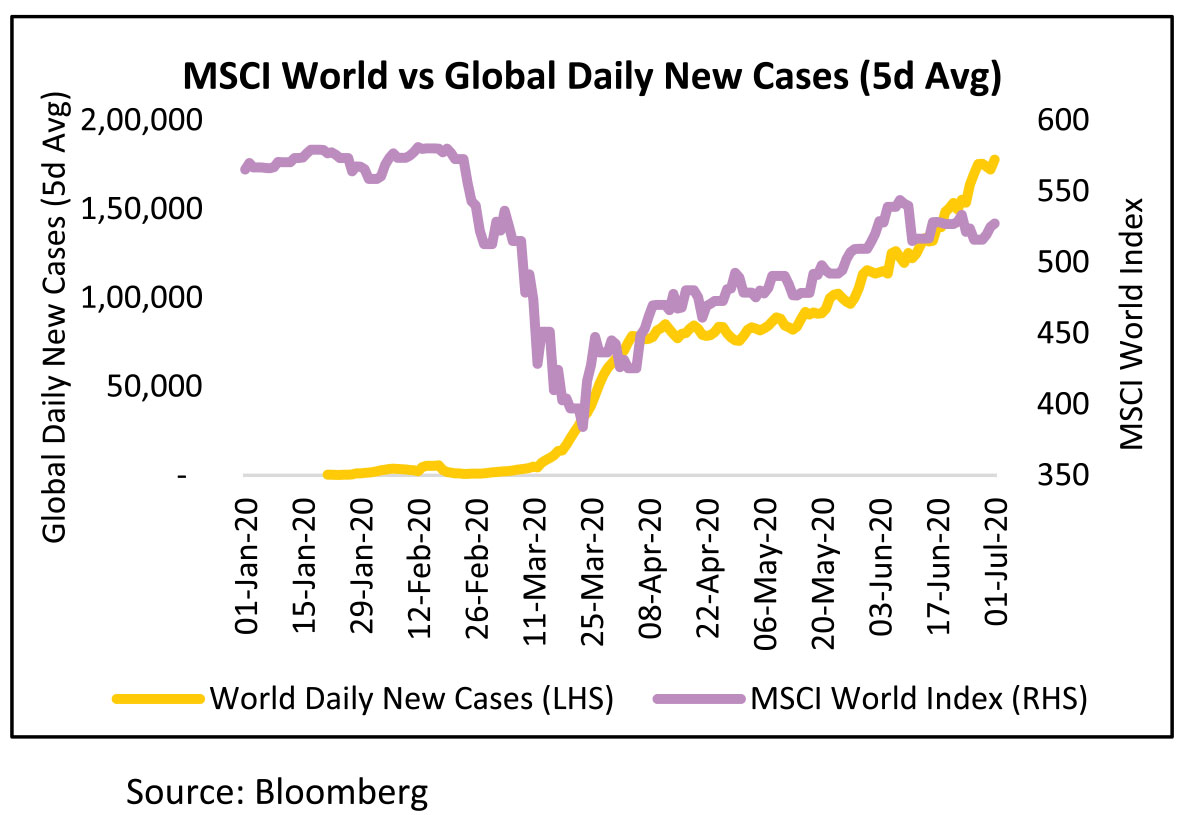
Global Markets (MSCI World Index in graph) have rallied from the bottom of 23rd March despite new cases increasing since. Around 40,000 new cases were added daily around 23rd March as compared to 180,000 cases by June end. Despite this the MSCI World Index has rallied 36% from the bottom and is only 7% below its level at the start of the year. Clearly, the financial "vaccine" has worked!
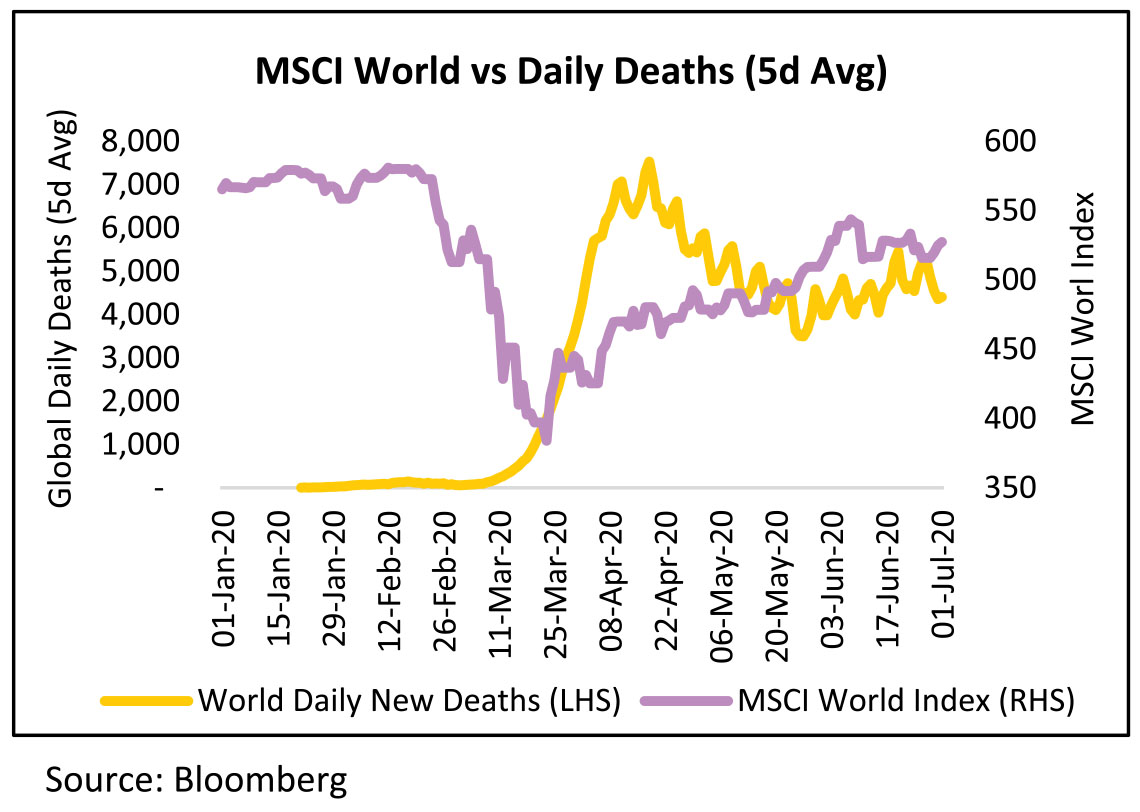
Despite the surge in new cases, daily deaths worldwide have plateaued/fallen off, with death rates, thankfully, coming off from the levels registered in April'20. This plateauing of the daily deaths coupled with the fiscal and monetary packages announced by most governments and Central Banks have propelled global markets (especially US) to pre Covid levels.
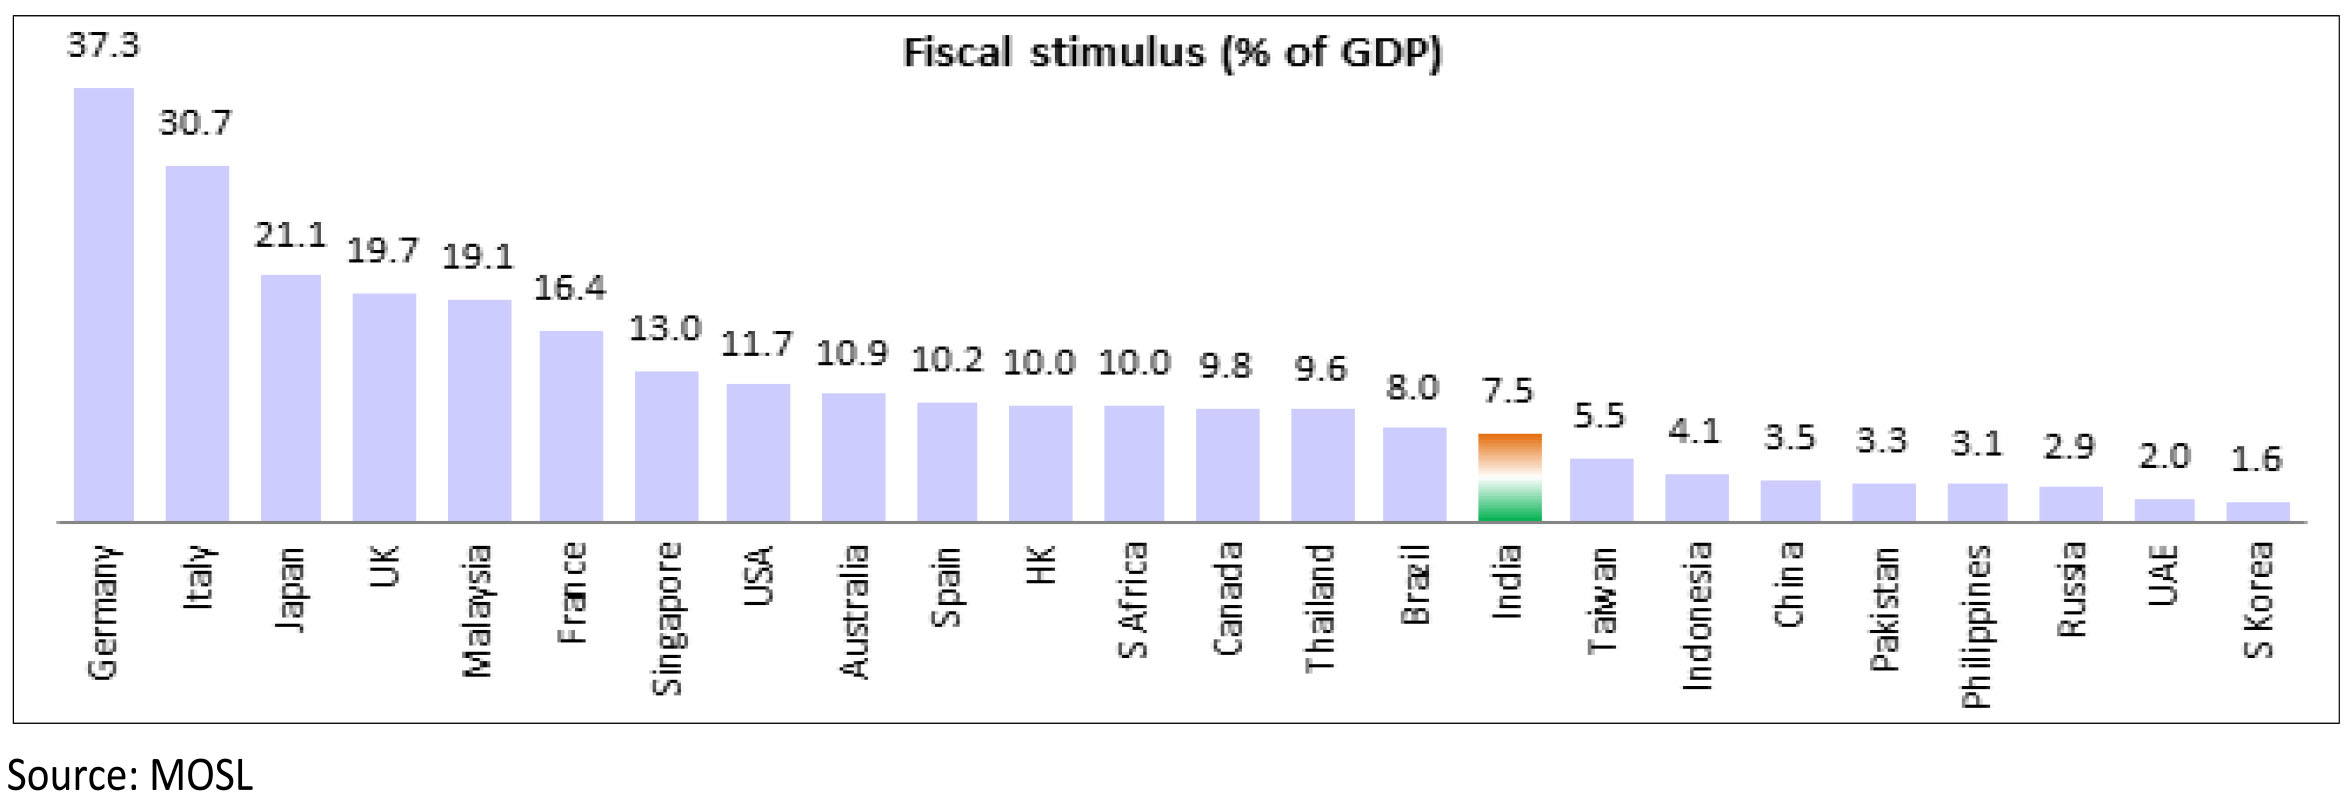
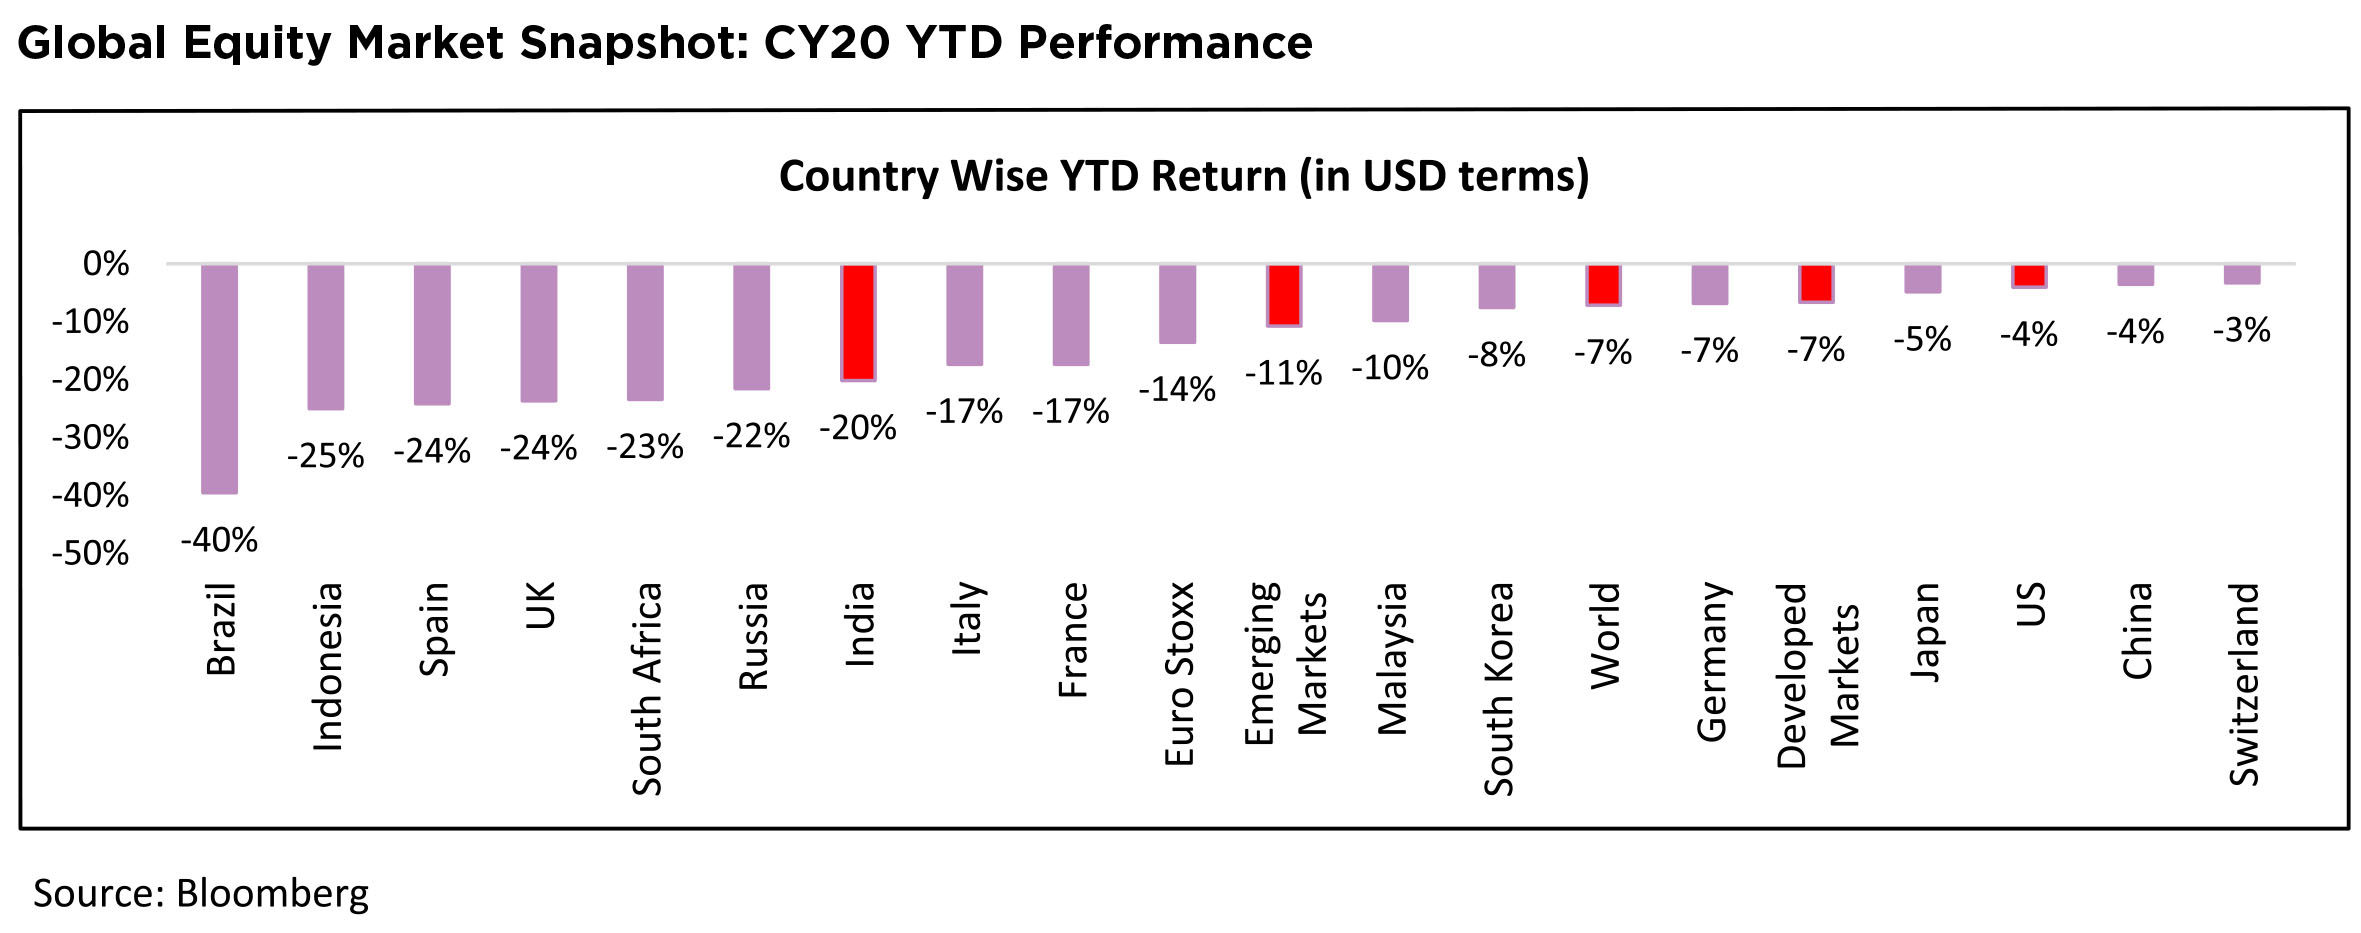
As can be seen in the below chart, US markets have been the key drivers of the rally, outperforming in both the crash as well as the bounce. Other impacted countries like UK, Spain, Italy, France, Brazil etc. have underperformed in both the crash and the bounce phase. India was one of the laggards in the first crash, but has bounced back more than most other markets.
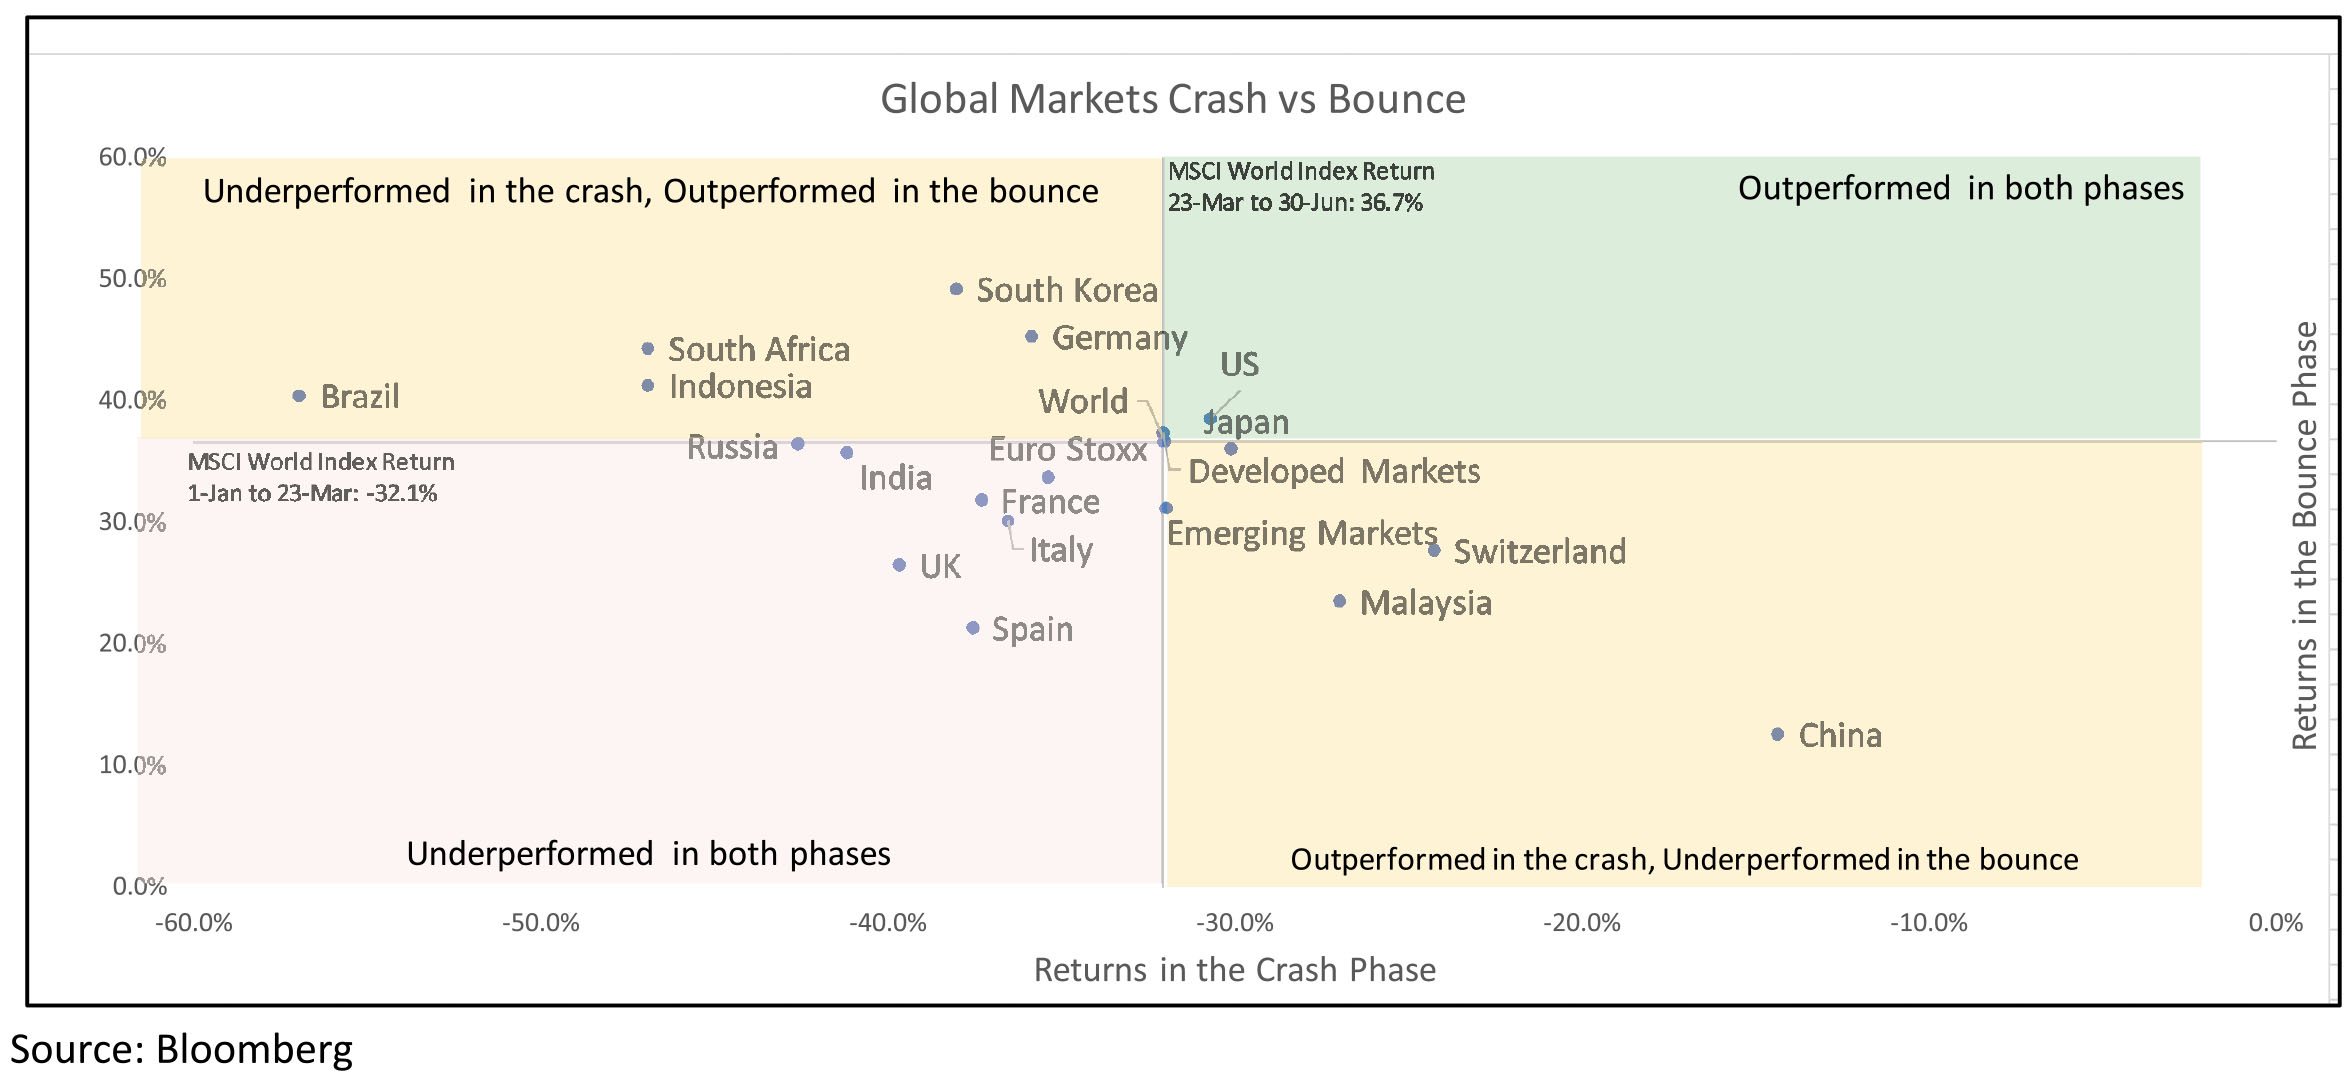
As a result, markets like US, Japan, China and Switzerland are almost close to the levels at the start of the year. India has fallen 20%, somewhere in the middle of the pack, especially is US$ terms.
US Debt Markets: A key undertone for the equity market will be the direction in which the debt markets, especially US debt markets move. The US Fed under Jay Powell, has unleashed a monetary policy in March 2020, which builds on the "foundations" of his predecessors - Ben Bernanke and Janet Yellen. Some, would point out it goes, even further, with the declaration to buy non-investment grade Corporate Bonds. While, that announcement was electrifying, breaking, perhaps one of the oldest principles of Central Banks, not to buy High yield Corporate Bonds, its impact was as significant. Within weeks, High coupon Bond yields fell by almost 350 bps, calming the frayed edges of the debt market.
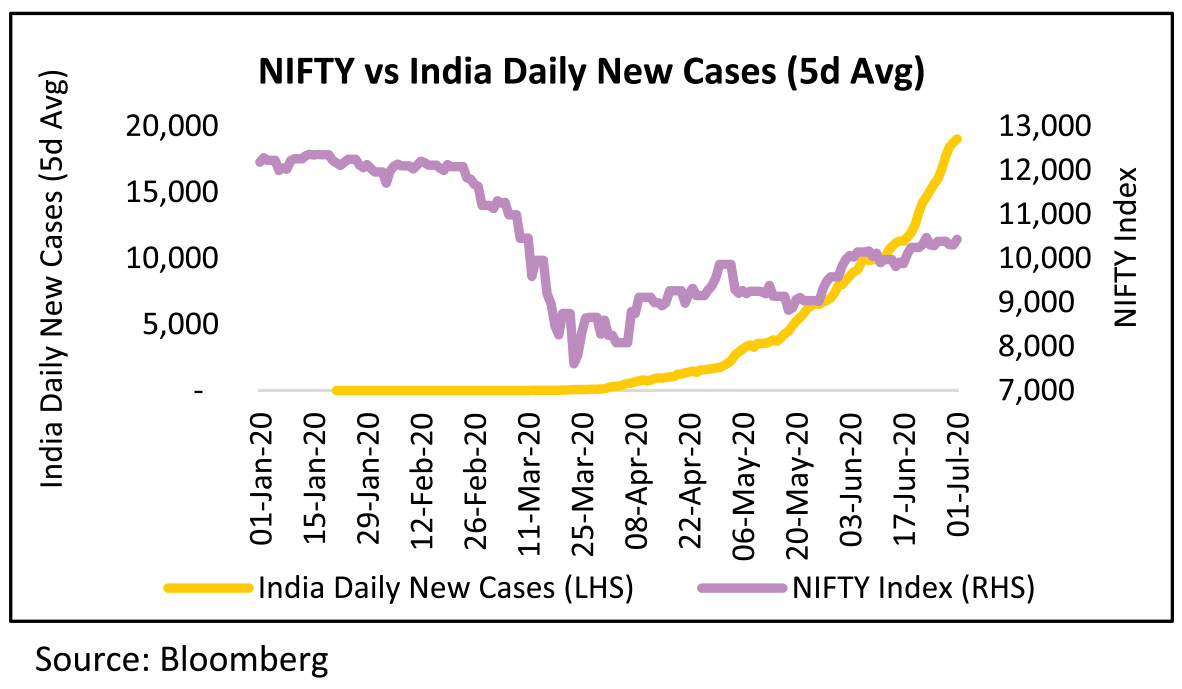
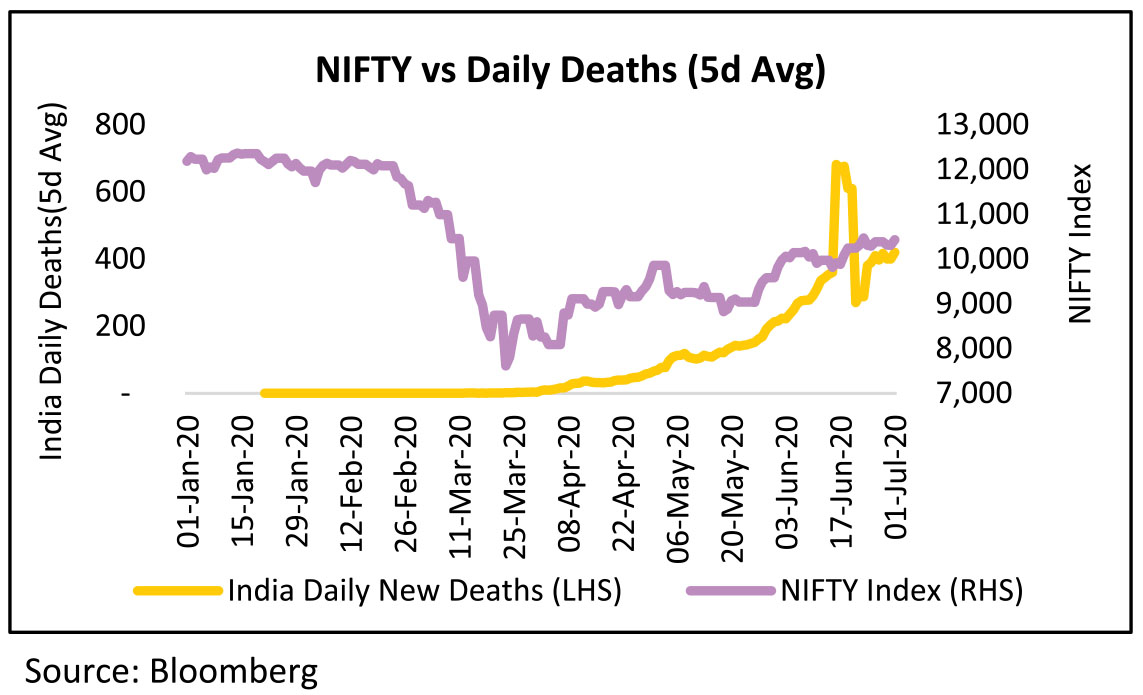
Indian markets currently seem to be following global markets and the lifting of lockdown restrictions. From Lockdown Phase 1 to Unlock 1, Nifty has moved from being lower by 33% to being lower by only 14% from its pre-Covid peak. Lockdown Index has moved from 100 at the start to ~75 in Unlock 1. Economic Indicators have reversed from lows see in Phase 1 of the lockdown. Power demand is only 7.4% lower YoY as compared to bottom of -28.3% YoY. Unemployment rate is now at 8.6%, comparable to pre-lockdown period as compared to bottom of 27.1%. This reversal has contributed to the sharp up move seen in the equity markets.
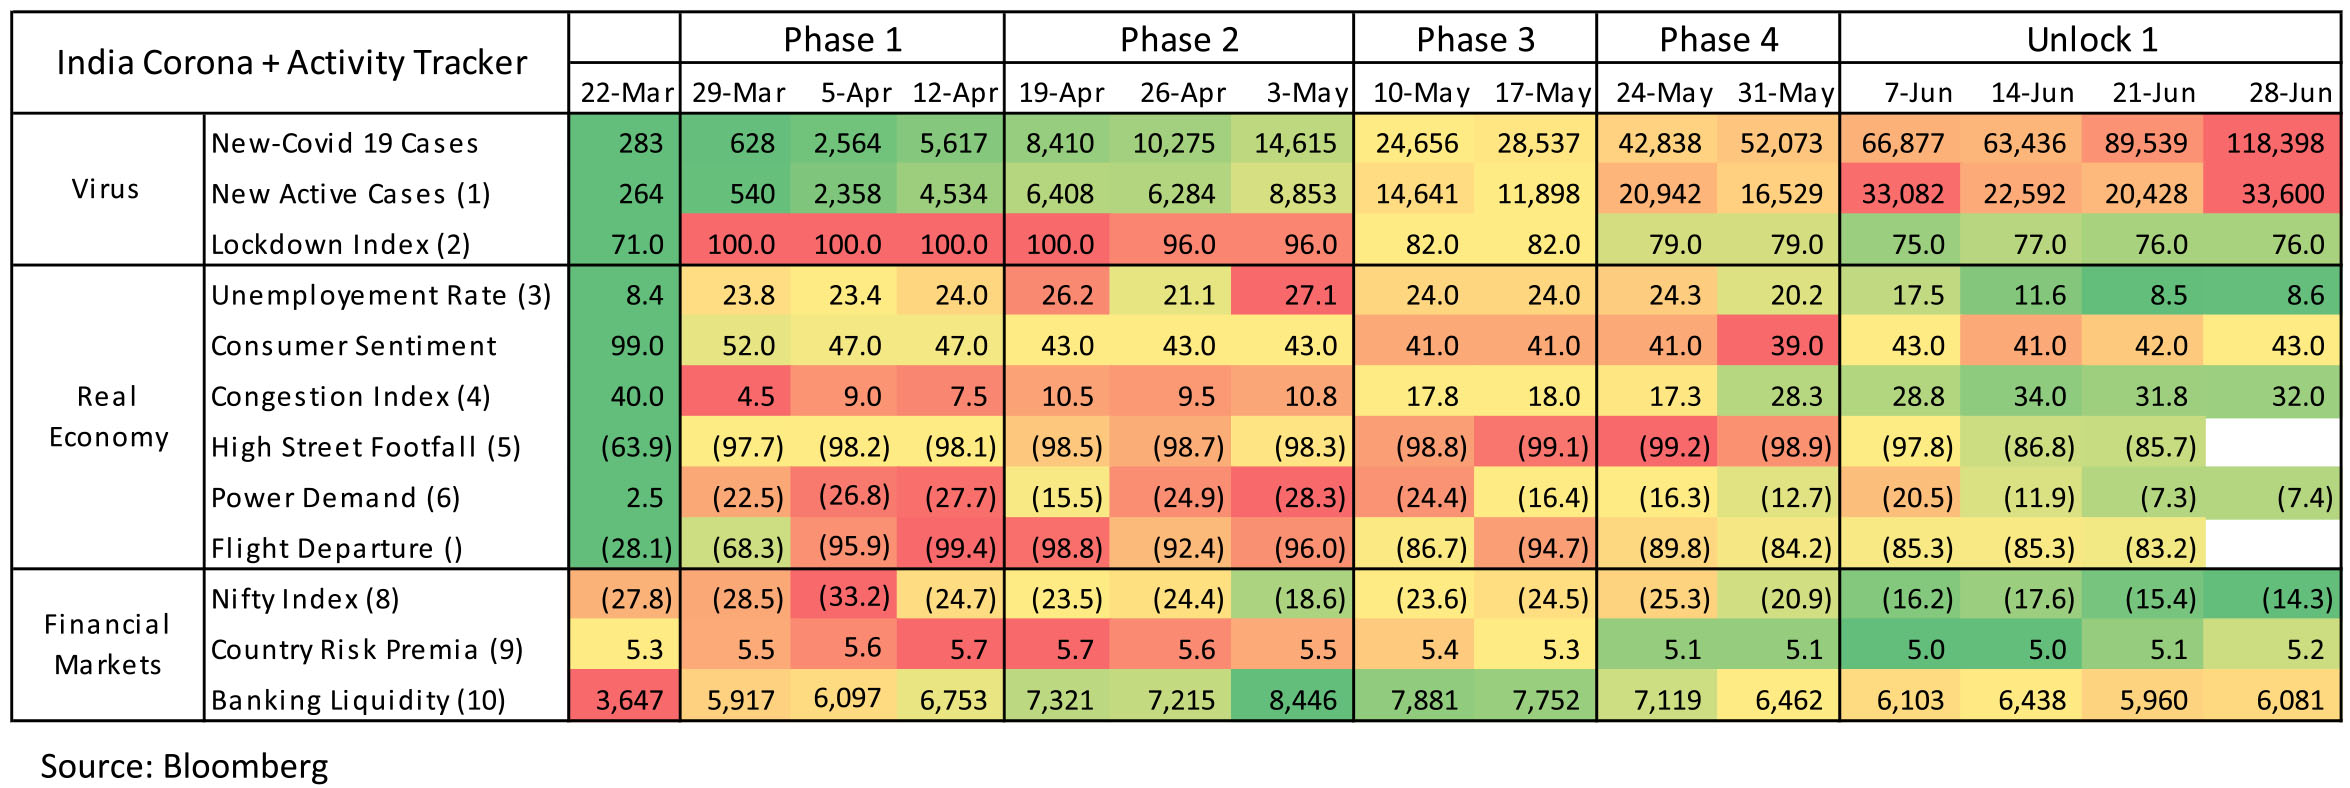
Notes: Green colour signals strength/ less severity, red signals weakness/ greater severity. 1. Active cases calculated by deducting recovered cases and deaths confirmed cases; data from Bloomberg News Johns Hopkins University. 2.Oxford Covid-19 lockdown stringency index. 3. Data sourced from Centre for Monitoring Indian Economy's Consumer Pyramids Household Survey. 4. Peak traffic index for four metro cities - Delhi, Mumbai, Bangalore & Pune - from location technology company TomTom. 5. Weekly retail footfall (%, YoY) from ShopperTrak. 6. Power demand from Monday to Friday (%, YoY) from Ministry of Power. 7. Percent change relative to average flight departures in December from Flightstats. 8. Percentage change from first 5-weekday average in January from Bloomberg. 9. Premium on India 10-year government bond yield over U.S. yield from Bloomberg. 10. Banking liquidity surplus from Bloomberg Economics.
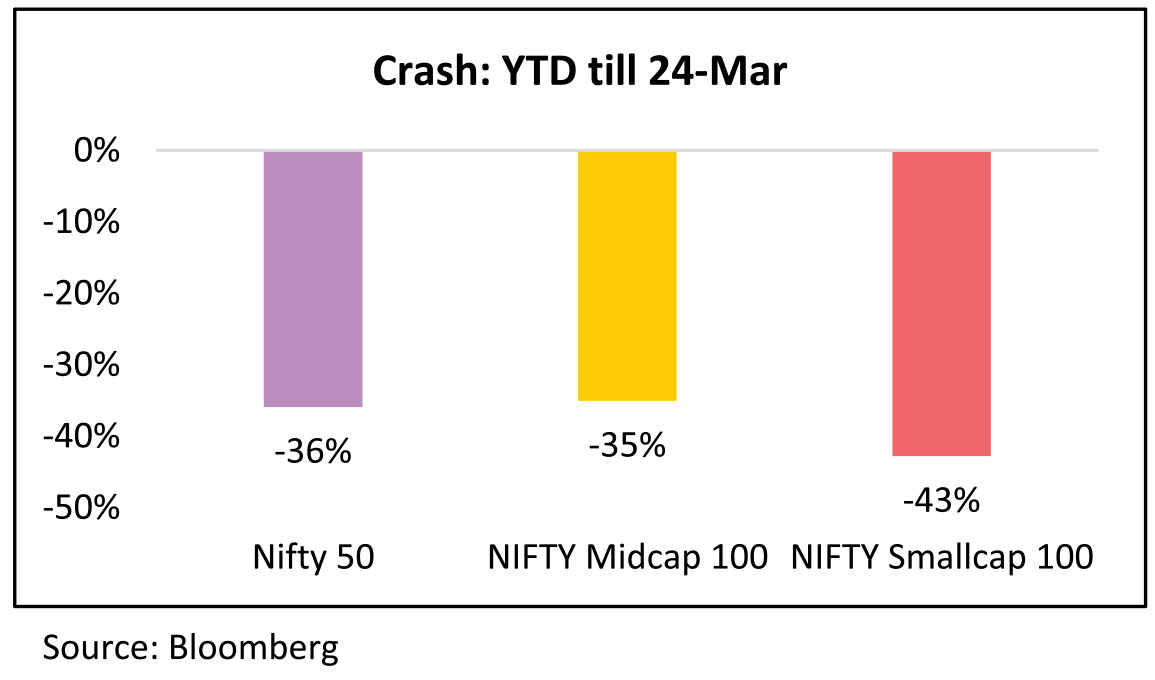
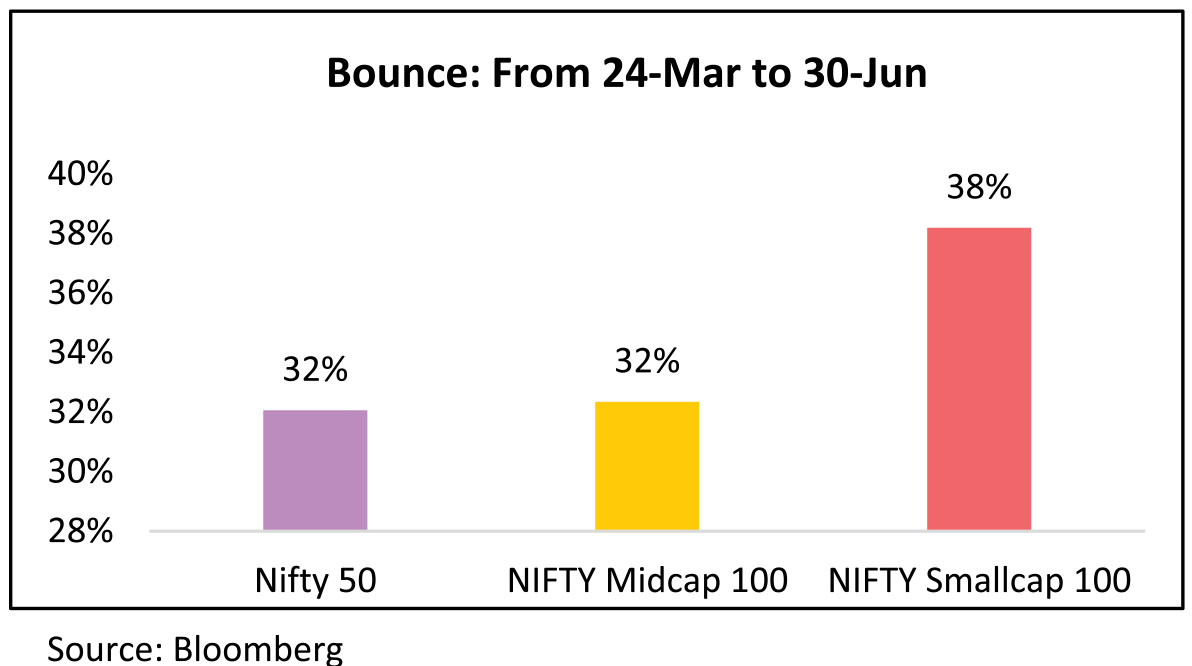
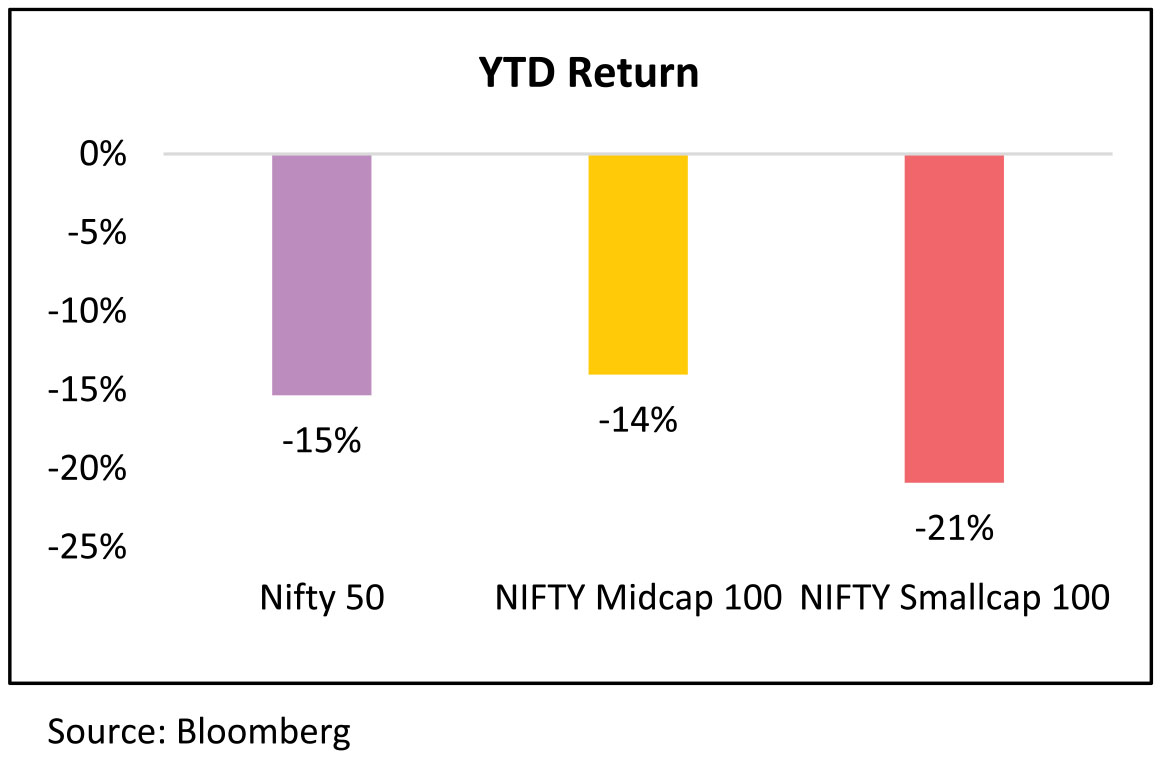
Indices Performances: Sharp crash followed by recovery
Capital Flows: FPIs recorded net inflows of US$2.5bn into Indian equities in June (vs. inflow of US$1.7bn in May). YTD, FPIs have sold US$2.2bn of Indian equities. FPIs recorded net outflows from debt markets at US$224mn in June, the fourth consecutive month of outflows.

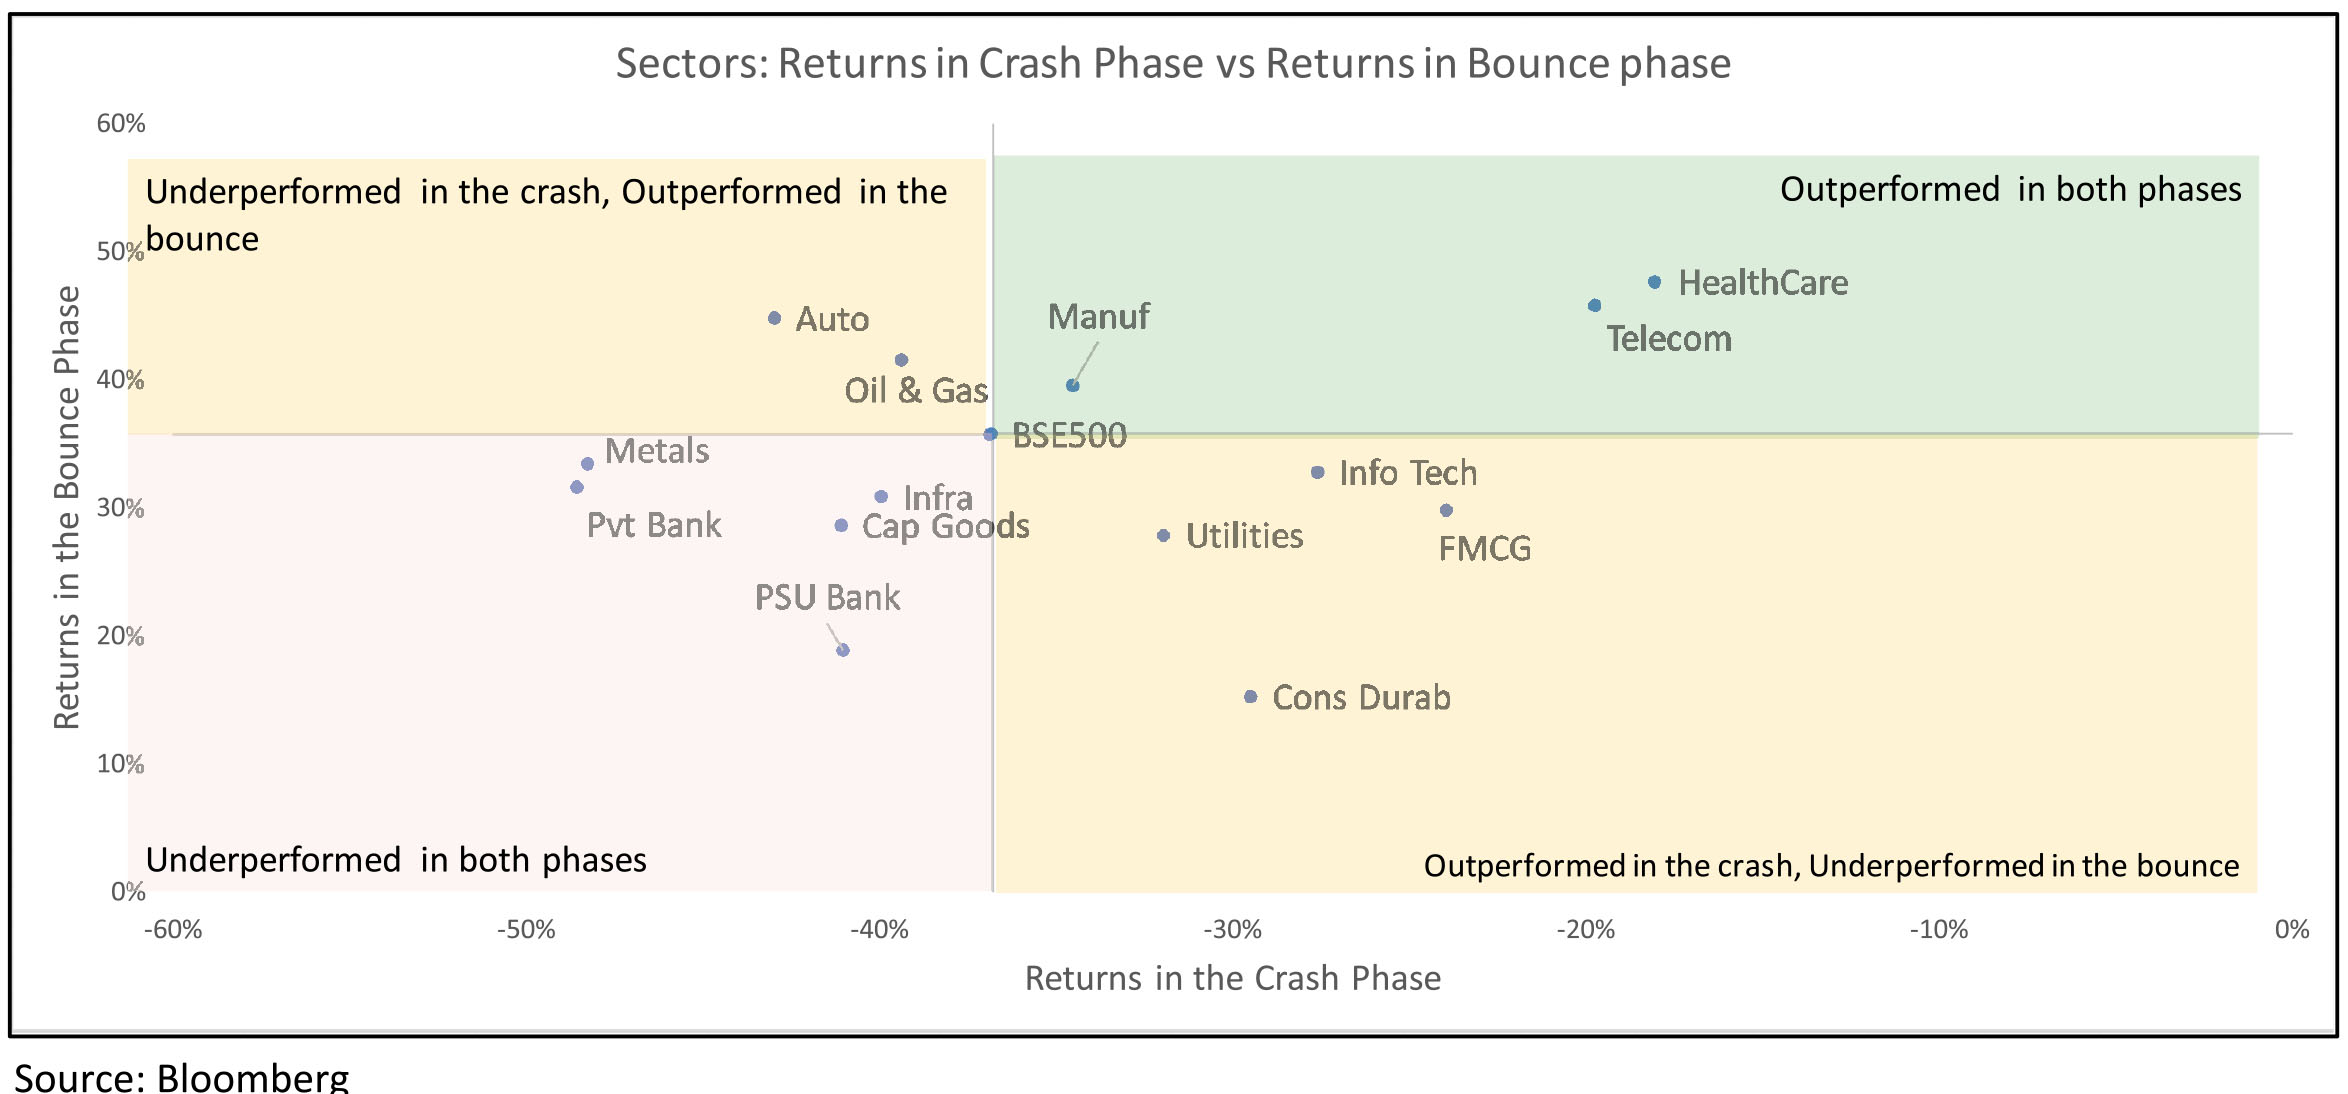
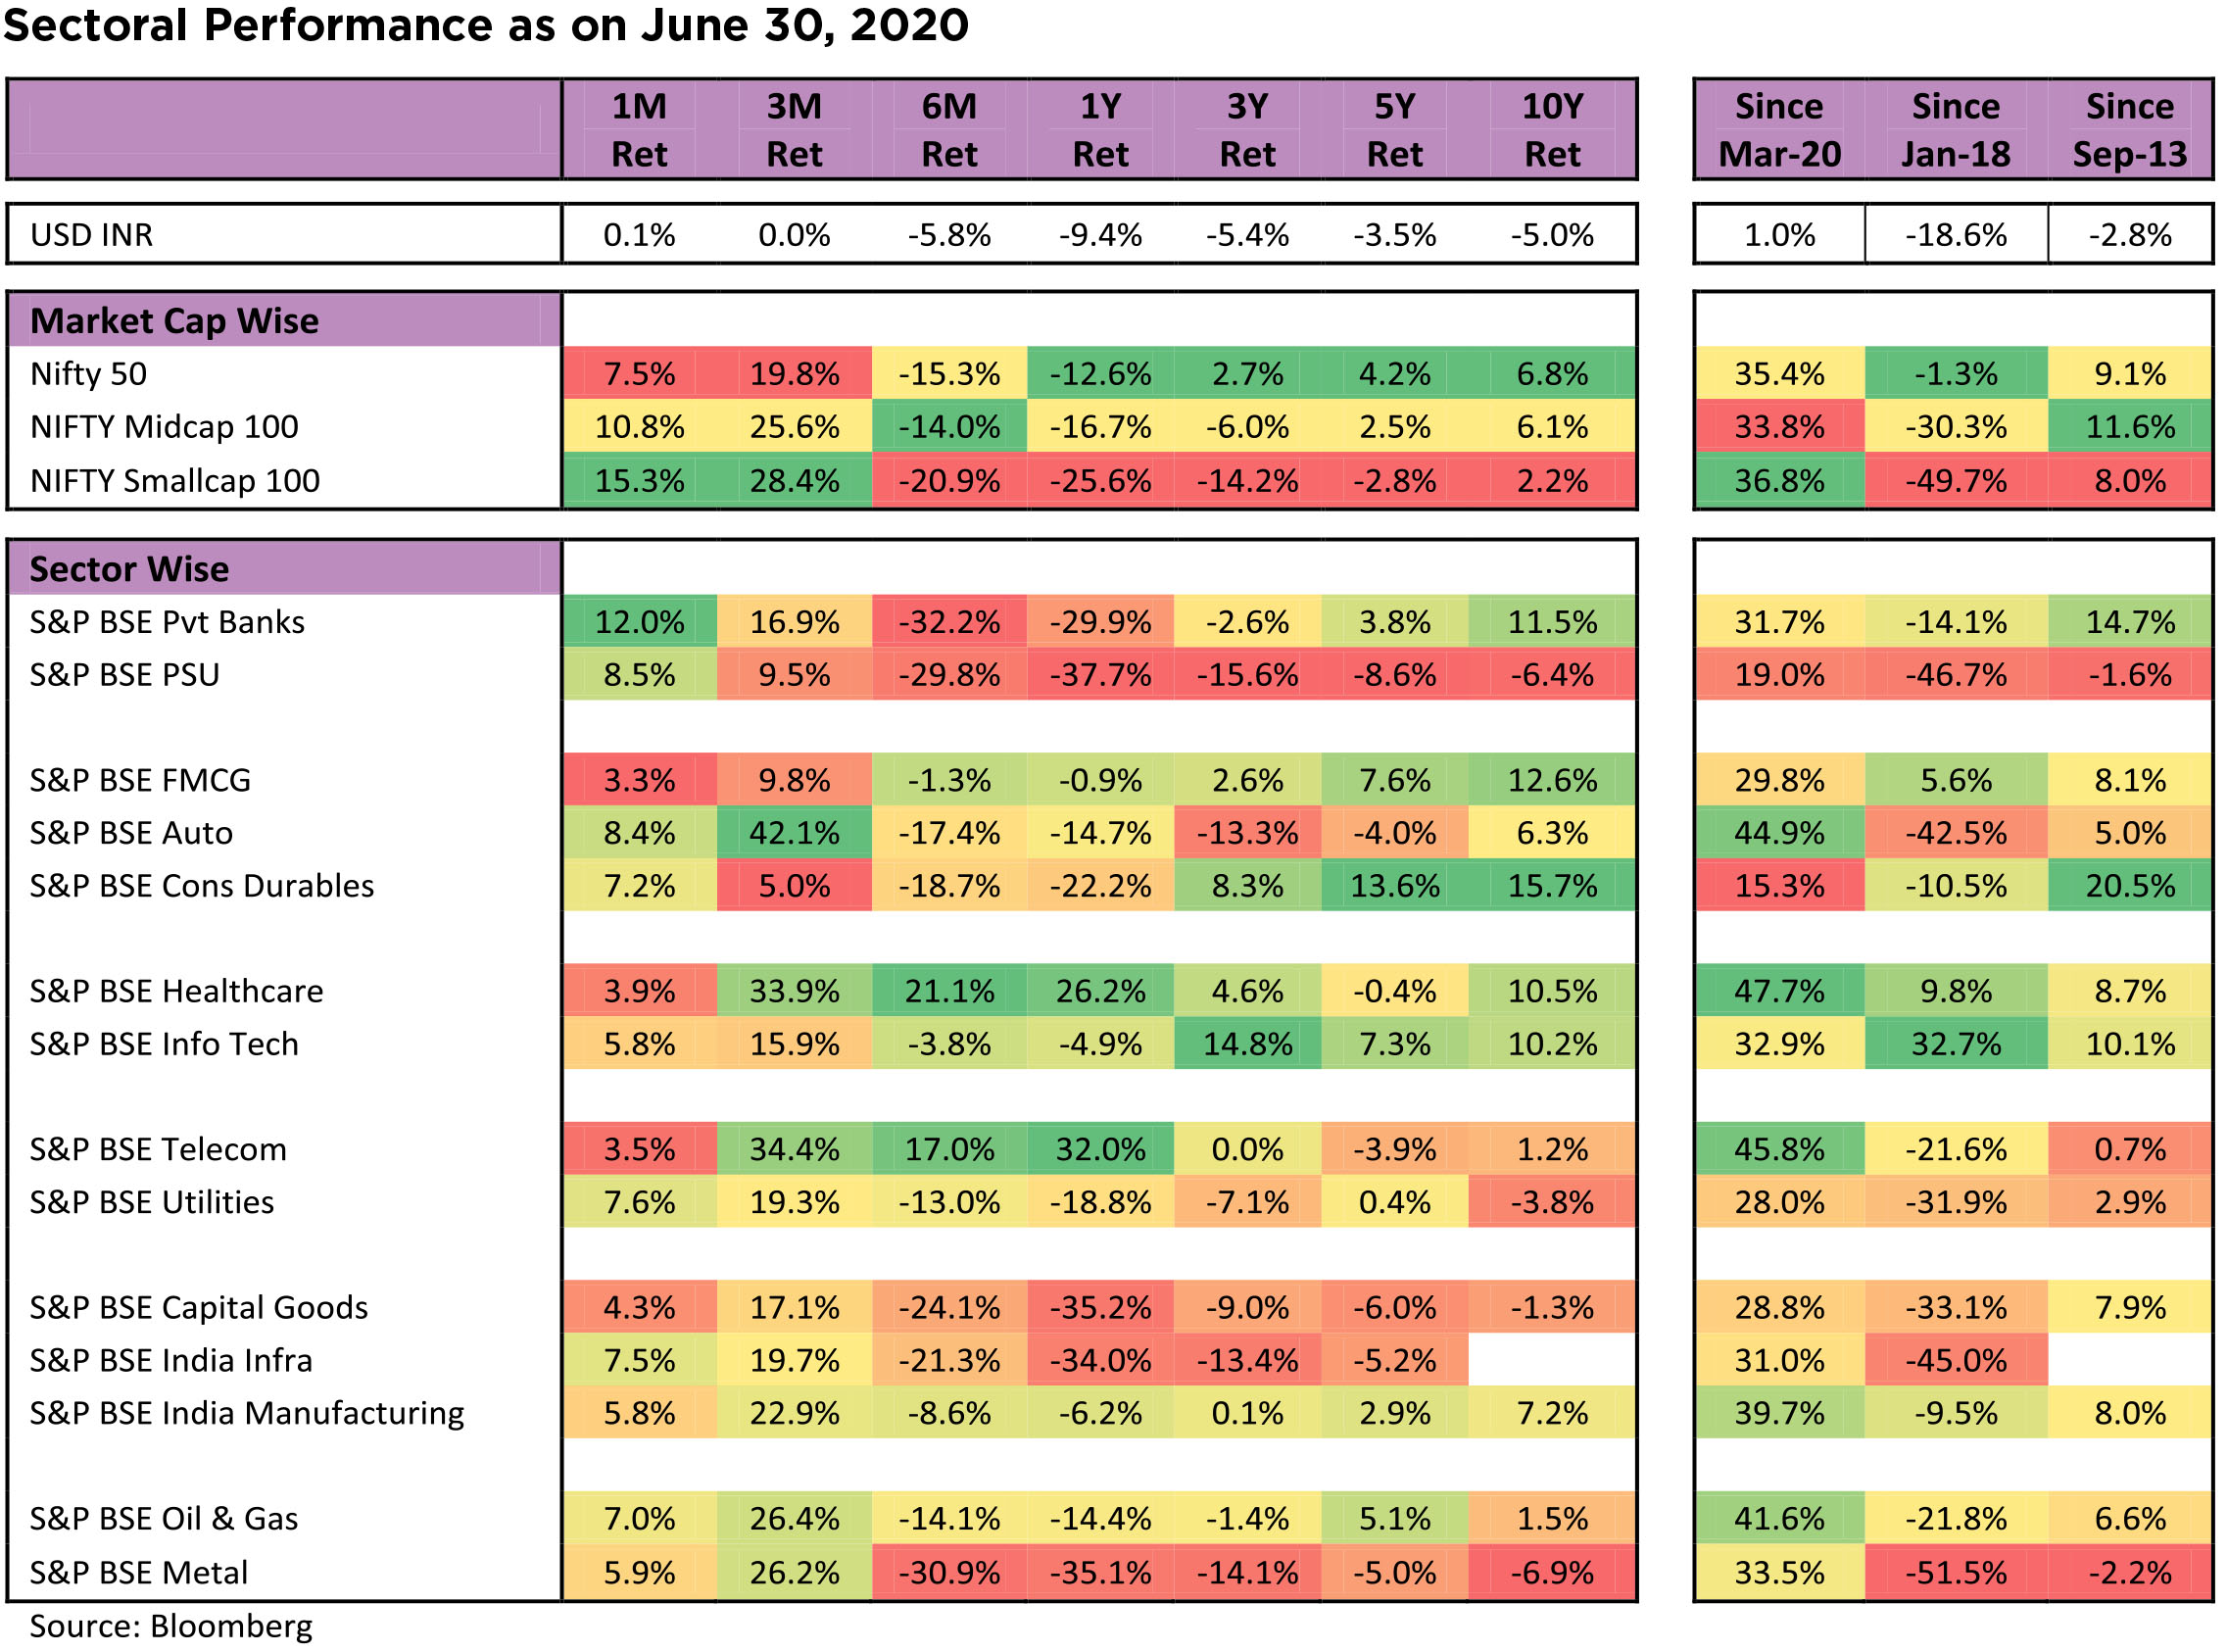
Traditional defensives - IT, FMCG, Utilities outperformed in the crash but have underperformed in the bounce. Auto and Oil & Gas (courtesy Reliance) have bounced back sharply after underperforming in the crash.
Economic Recovery post Lockdown
High-frequency data show a rebound in economic activity continued in June. The Google mobility data (weekly average for 23 June) shows improvement in mobility trends. Essential services like groceries and pharmacies are now close to pre-lockdown levels (-3%) from -13% in end May and -46% in end April. However, mobility for discretionary services like recreation and entertainment remains 58% below prelockdown levels, though it has increased from -70% (end-May) and -85% (end Apr). Workplace mobility has also improved to -38% (vs. -44% in end-May and -65% in end-Apr).
► Unemployment rate as reported by the CMIE has fallen significantly from a peak of 27% in May to 8.6% in June, inching closer to the pre-Covid level of sub-8.4%.
► From -24% YoY in April to - 15% YoY in May and the 1H of June, Indian power demand further improved to -6.2% YoY in the 2H of June, taking the full month of June 2020 to -10.5% YoY.
► The YoY decline in Fuel consumption and E-Way bills has been reducing.
► National Electronic Toll Collections are 6x the levels seen in April.
Forex Reserves: India's FX reserves are close to their all-time peak at US$505.6bn as of 19 June. FX reserves have increased by US$15.5bn in the last four weeks.
Fiscal Deficit: Fiscal deficit for Apr-May came in at Rs.4.7tn or 58.6% of the budgeted FY21 deficit (Rs.8.0tn). This compares to 47.7% reached during the same time frame in FY20.
Trade Deficit: India's monthly trade deficit for May came in at US$3.2bn and declined by US$3.6bn mom. The print was meaningfully below consensus expectations of ($7.1bn). The aggregate trade balance (goods and services) was in a surplus of US$4bn in May (vs. US$0.3bn surplus in April). These two months were the first time in four years that the aggregate trade balance was in a surplus, with May being the highest recorded surplus in the series.
Brent Crude: The Brent oil price gained 12% mom in June to end the month at US$40.9/bbl. following a 55% mom gain in May. YTD, oil prices are still ~40% down.
Manufacturing PMI: India's manufacturing PMI has improved sharply from the lows of April.
Cumulative rainfall: It is +20% above long-period average (LPA) levels on an aggregate basis (over 1-28 June 2020) as the monsoon season has covered the nation ahead of schedule. The all-India monsoon coverage is12 days ahead of its normal schedule. Previously, such early coverage happened in 2013. Out of the 36 meteorological subdivisions, rainfall has so far been excess/normal in 32 meteorological subdivisions and deficient in four.
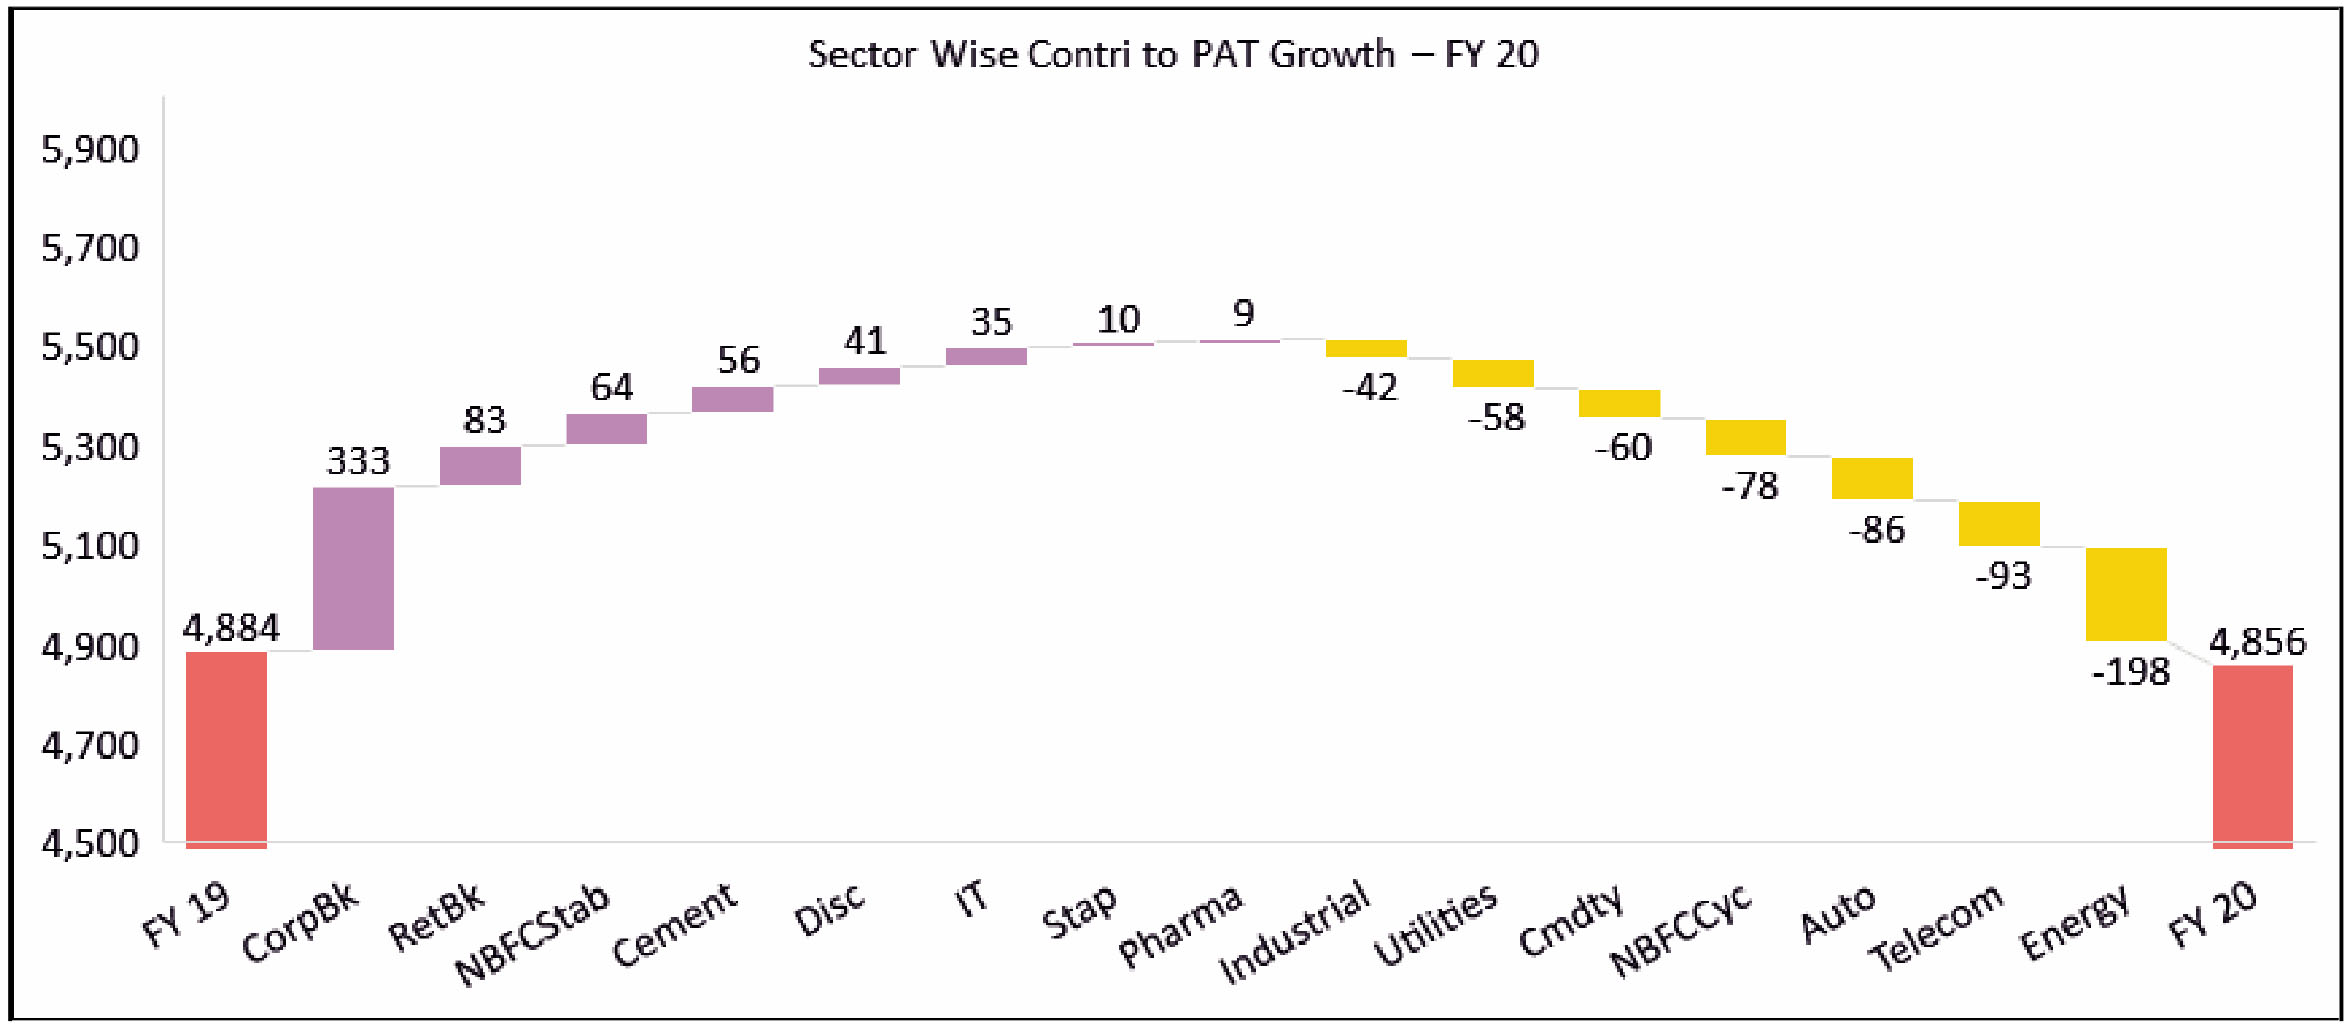
De-Growth was led by large one-off inventory losses in Oil & Gas Companies, whereas Corp Banks, Cement and Telecom had the biggest positive contribution.

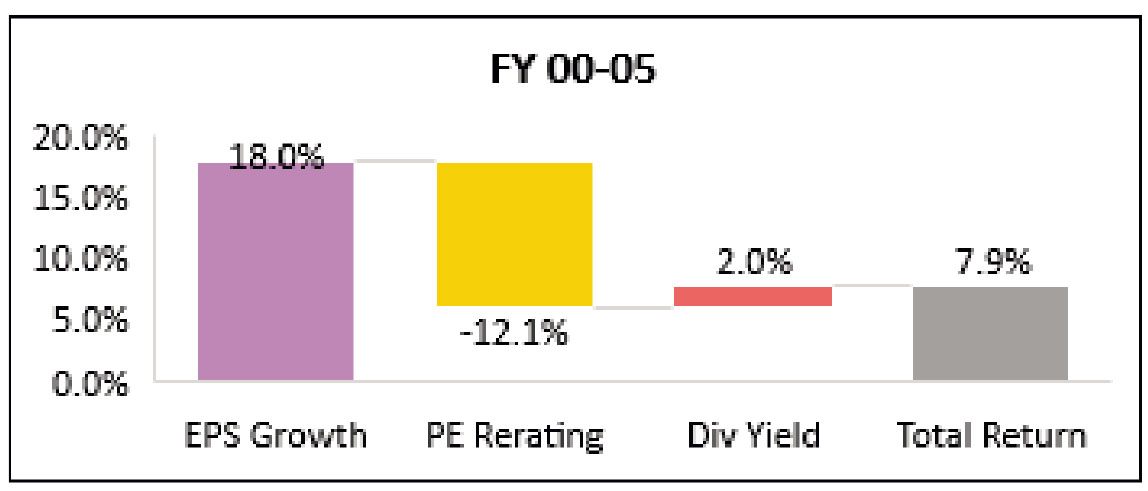
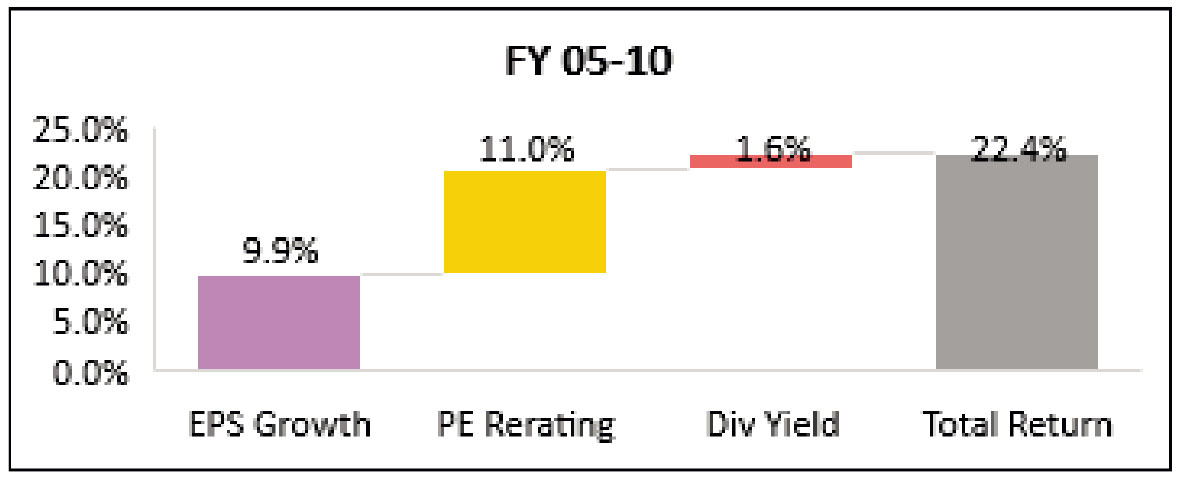
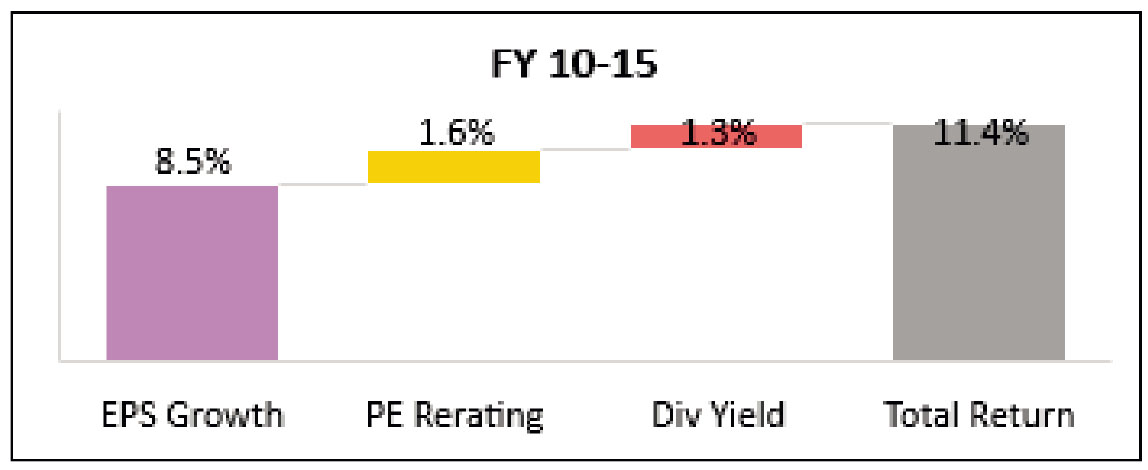
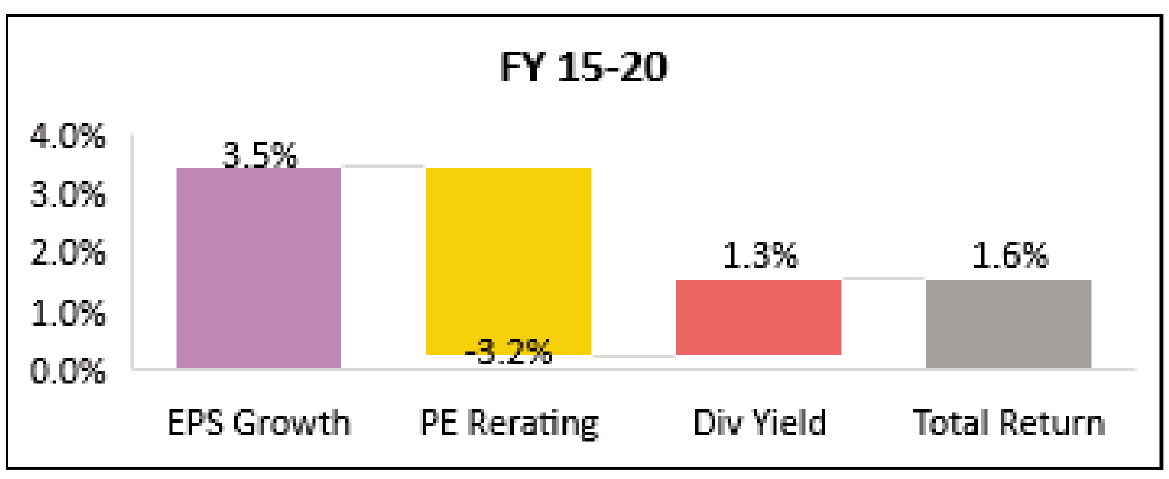
As can be seen in the below chart, decade of FY11 to FY20 has been weak in terms of earnings growth. First 5 years of the decade saw an earnings CAGR of 8.5% (FY 10-15) and next 5 have seen earnings CAGR of 3.5% (FY 15-20), which is much lower than the double-digit nominal GDP growth rate over this period. In the first 5 years, valuation rerating boosted returns, but valuation rerating cannot drive returns all the time. In the second 5 years, the ensuing derating has dampened returns, resulting in a subpar decade from an equity market perspective.
Source: ACE Equity, Bloomberg
Valuation
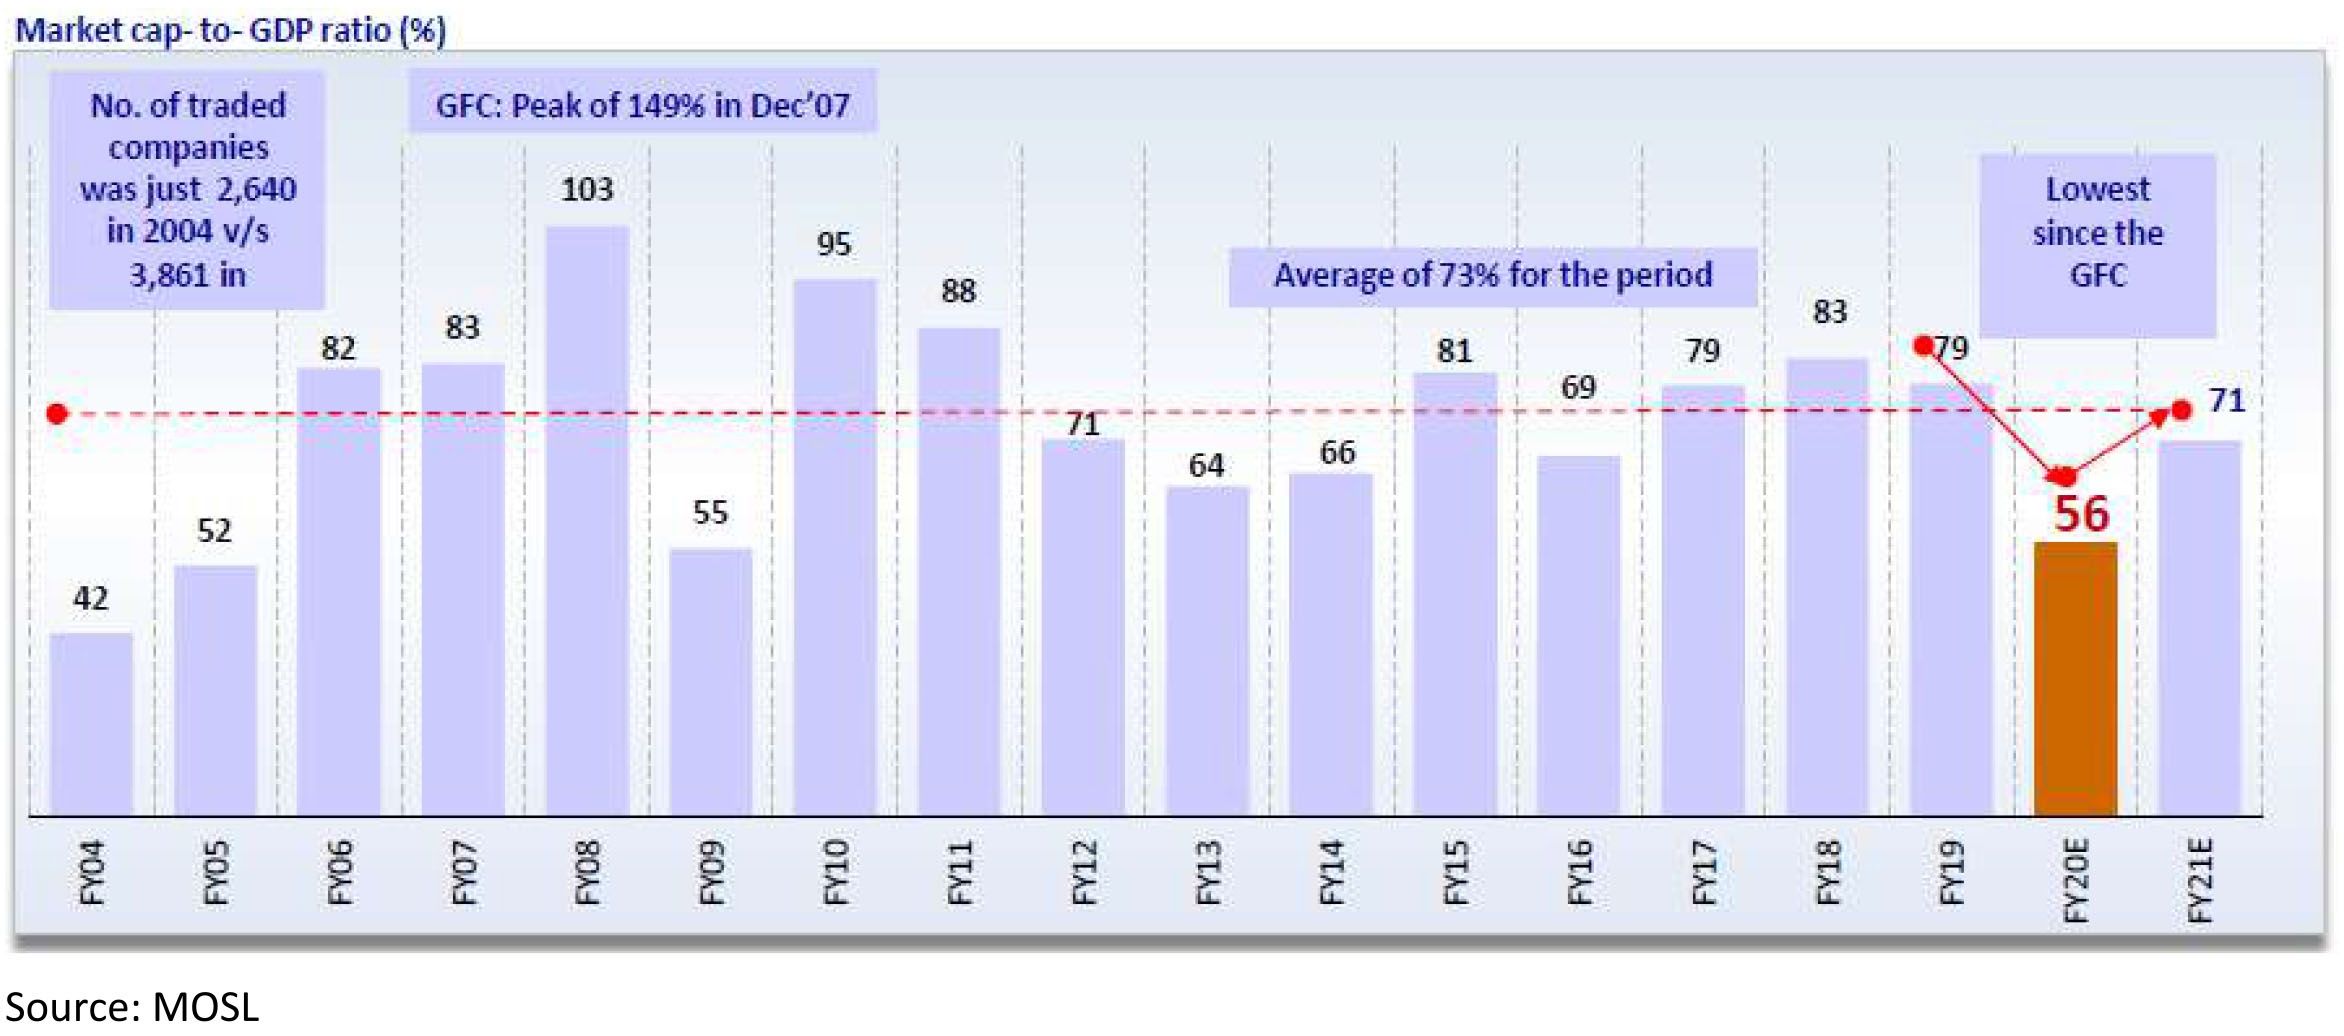
Market cap-to-GDP ratio has been volatile as it moved from 79% in FY19 to 56% (FY20 GDP) in Mar'20 to 71% now (FY21E GDP) - near the long-term average of 73%.
► For the Nifty, Price to Book is lower than historical average. Positive PE, i.e. PE of only profit-making Nifty companies, is back to +1 Std Dev from long term average, after falling below its long term average in March.
► For Mid-Caps, both PE and PB are close to historical averages, after falling to 1 Std Dev below in the crash.
► For Small Caps, both PE and PB are close to historical averages, after falling to 1 Std Dev below in the crash.
Technology was the clear winner, post GFC: It would not be unwarranted to label the last ten years as the Decade of Technology: FAANG (Facebook, Amazon, apple, Netflix and Google), Chinese internet companies - Alibaba, Baidu, Tencent have ruled the markets. All the best performing indices are top heavy with technology, Indices across Europe and India, bereft, of such companies have lagged. No wonder, Nasdaq 100, was the first index to post positive gains on a y-o-y basis.
US Fed was the pivot: Long back in 1996, the then US Fed Chairman, Alan Greenspan warned US equity markets of irrational exuberance, equity markets it seemed "taunted" him by surging higher, culminating in the tech bubble of 2000. Post, March 2009, equity markets look for signalling from US Fed, the Bernanke "Put", a Powell "Pivot" have as much influence if not greater influence than any other fundamental measure - P/E, PAT growth etc. The last decade has clearly belonged to nudges and messaging from the US Fed.
Emerging Markets became a chimera: Is China, really an emerging economy? The second largest economy in the world, has little in common with the other components of the BRICS. Even with China, MSCI Emerging Markets underperformed US throughout the decade, without it, the performance was disastrous. No longer can emerging countries play the growth card. US and China, over the last three years have grown at a faster pace. The leitmotif of investing in emerging economies to participate in higher economic growth has been shaken and stirred during the last decade.
Markets will have tiers: FAANGS ruled S&P 500 and similarly, the top 15 in the Nifty outperformed. A clear sign of anaemic earnings growth which characterized the last decade. Compounding this issue is the relentless march of passive money. Even in India, ETF tracking Nifty50 has become the largest equity fund in less than half a decade and it continues to grow.
Growth trounced Value: In US, this could be called a "fair" fight - An Apple, Google, Microsoft some of the ley luminaries of the tech "gang" reported impressive earnings growth, distributed or bought back capital clearly outperforming the S&P 500. In India, a 42x multiple for a company reporting a decadal growth in PAT of 12% only showed the lack of choices rather than the case for Growth over Value.
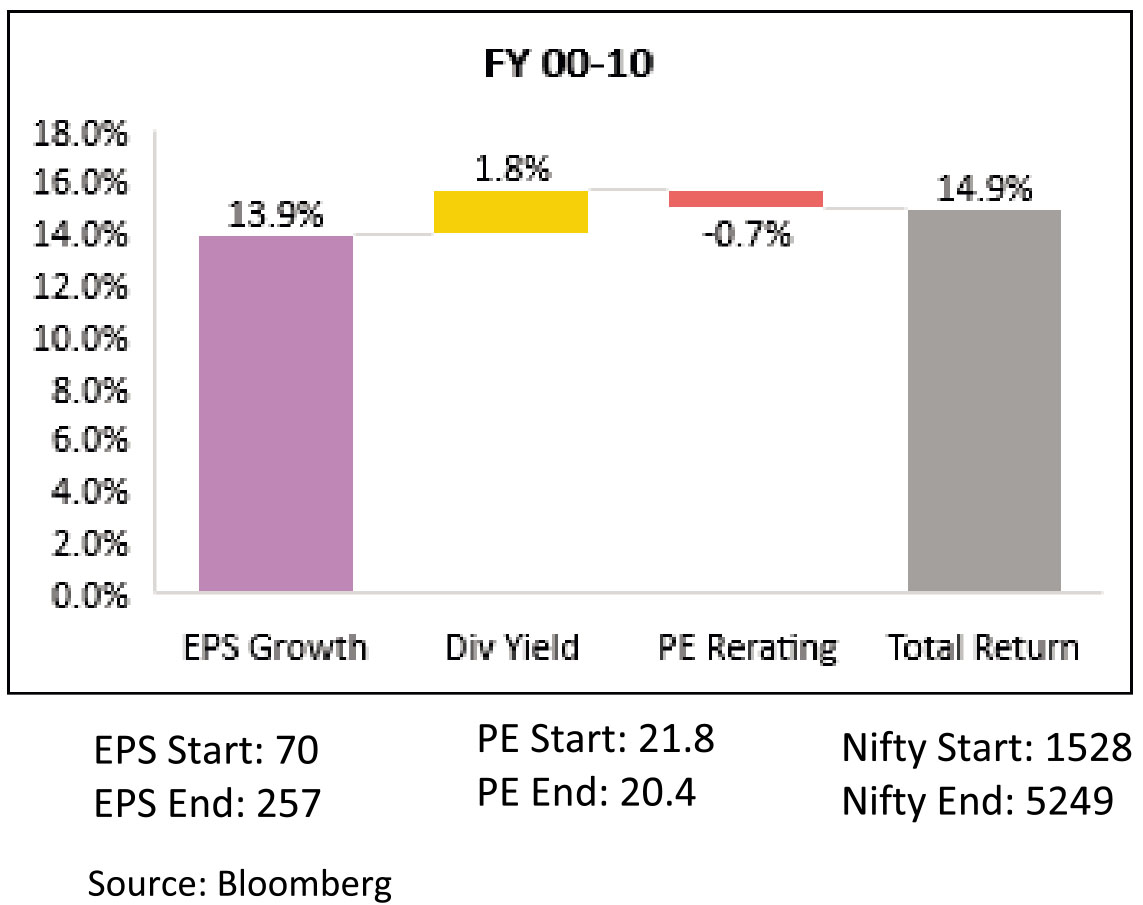
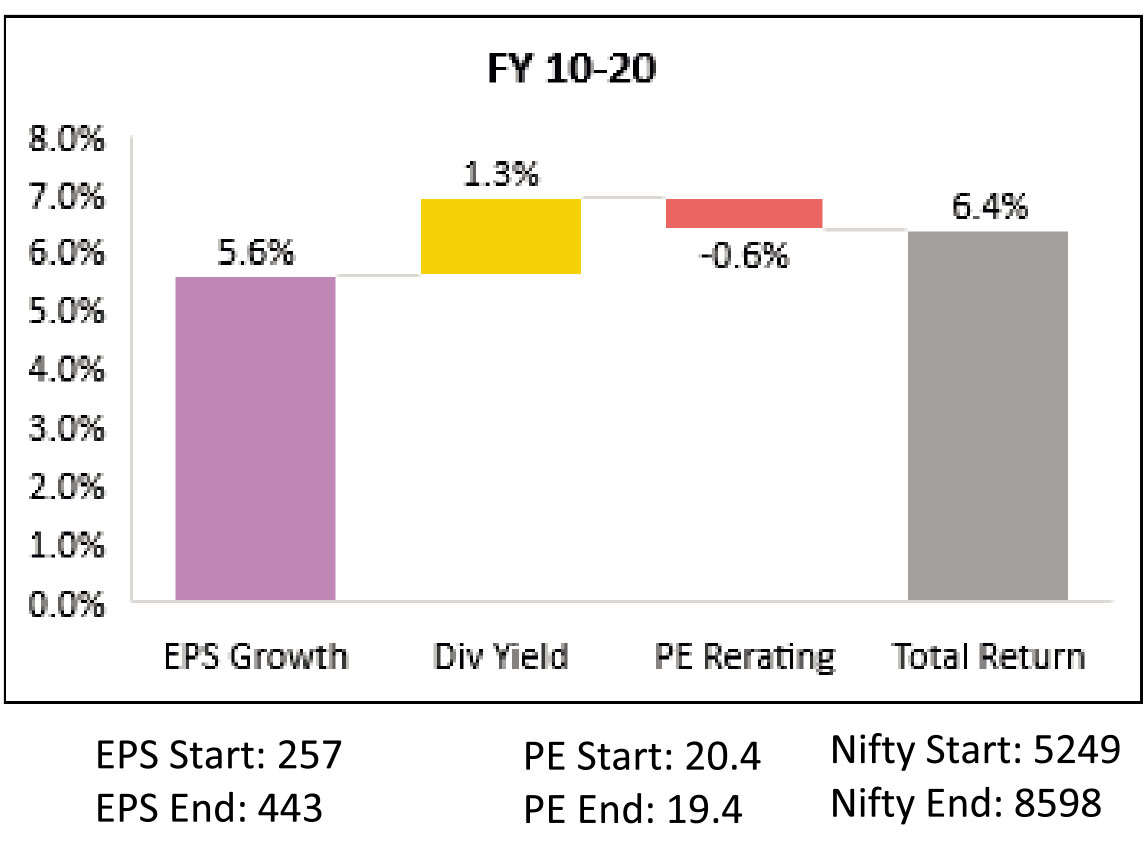
2020-30: Earnings growth, a repeat of 2010-20 or 2000-10? Clearly, the paucity of earnings growth was the key characteristic, unlike the earlier decade. Does a low starting point become an advantage - while India underwent a slow economic rebound from 98-02, it did set us up for the "mother" of all bull runs in 2000-10 decade. On the other hand, 2010-20, in contrast reflected the high base of growth experienced during the earlier decade. Will the de-growth in earnings expected in 2020, set us up nicely for comparison on earnings growth going forward?
Investing in Covid Times:
The remarkable recovery in Europe after the grim medical "battle lines" in April and May present an interesting study of a post Covid World. Aided by fiscal stimulus, aimed at protecting employee jobs and salaries, personal savings rates have zoomed in Europe, especially Germany, where the Government was the most generous. In May'20 the monthly deposit was at an all time high. Similar has been the case in US, where several studies have shown that US Congress approved employment benefits have been much higher than the monthly salary! Demand generation has been a mixed bag, while China reported a spurt in personal vehicle sales, as citizens shunned public transport, the same is not evident in western Europe. High end fashion and luxury, too has seen muted demand revival. Staples, which did not much of decline continue to report strong demand as eating out is still impacted either by Government shut down or consumer worry of social distancing.
In India, a deluge of webinar and expert calls, probably increased "shallow" knowledge levels to an alltime high levels. Travel, tourism, hotels, retail apparel continue to be the sectors most impacted by the lockdown. Two wheelers, tractor, fertilizers, agrochemicals have reported the most robust growth rates and are tipped to reach pre-Covid levels fastest. Pharmaceuticals, after three long years in wilderness, came back with a vengeance, after consolidating, is one of the sectors which is most favoured to re-start its outperformance with stable domestic growth and a push in export markets, especially US and Europe. Technology after a weak Q1 FY 21, is expected to benefit from the recovery in Europe and US for the rest of the year, a Democrat winning the US Presidential election could boost as H1B visas will get reinstated. Auto and auto ancillary with large aftermarket is another segment, which could see revival in the second half of FY21.
Banking and NBFCs, the largest segment in the indices, continues to be dogged by Moratorium, thus the "quality" of earnings till Q3 FY21 will remain suspect. Most company managements have focused on ensuring that FY20 net worth remains intact in FY21, i.e. nominal profits at best, as provisions could zoom due to high NPAs especially in the unsecured personal and SME/MSME loan segments.
Beware of the 'Penny' Stocks: In the recent bounce, the best performing segment of the market has been penny stocks. Volumes in cash segment, from non-institutional holders are at a record high which points to the active involvement of non-institutional investors in the penny stock segment. Investors should not confuse excitement and thrill with long term wealth creation. The key to have a winning strategy in a casino is knowing when to stop.
The theme, clearly is to be overweight on segments where FY22 PAT could exceed FY 20 - this could be the new holy grail of investing in post-Covid times. Not all businesses will be able to sprint back to FY20 levels at the same time, will those who fall be left behind (consigned to the "value" investor), as winners don't look back?
As Tim Harford, my favourite columnist writing in Financial Times commented "My guess is that clever statisticians will be able to detect the psychological aftershocks of the pandemic for decades to come - but that to a casual gaze, everyday life in 2022 will look a lot like it did in 2018. Scars do not always heal, but they fade."
For the investor, the roller coaster ride of the equity markets since March, itself may have influenced their behaviour towards this asset class (Not for me). Going ahead, post the pandemic, economic growth will be uneven and difficult to forecast. The key would be to stay invested and participate in the recovery which will unfold in the future.
Stay Safe, Stay at home.
Disclaimer: MUTUAL FUND INVESTMENTS ARE SUBJECT TO MARKET RISKS, READ ALL SCHEME RELATED DOCUMENTS CAREFULLY.
The Disclosures of opinions/in house views/strategy incorporated herein is provided solely to enhance the transparency about the investment strategy / theme of the Scheme and should not be treated as endorsement of the views / opinions or as an investment advice. This document should not be construed as a research report or a recommendation to buy or sell any security. This document has been prepared on the basis of information, which is already available in publicly accessible media or developed through analysis of IDFC Mutual Fund. The information/ views / opinions provided is for informative purpose only and may have ceased to be current by the time it may reach the recipient, which should be taken into account before interpreting this document. The recipient should note and understand that the information provided above may not contain all the material aspects relevant for making an investment decision and the security may or may not continue to form part of the scheme's portfolio in future. Investors are advised to consult their own investment advisor before making any investment decision in light of their risk appetite, investment goals and horizon. The decision of the Investment Manager may not always be profitable; as such decisions are based on the prevailing market conditions and the understanding of the Investment Manager. Actual market movements may vary from the anticipated trends. This information is subject to change without any prior notice. The Company reserves the right to make modifications and alterations to this statement as may be required from time to time. Neither IDFC Mutual Fund / IDFC AMC Trustee Co. Ltd./ IDFC Asset Management Co. Ltd nor IDFC, its Directors or representatives shall be liable for any damages whether direct or indirect, incidental, punitive special or consequential including lost revenue or lost profits that may arise from or in connection with the use of the information.
Global Markets (MSCI World Index in graph) have rallied from the bottom of 23rd March despite new cases increasing since. Around 40,000 new cases were added daily around 23rd March as compared to 180,000 cases by June end. Despite this the MSCI World Index has rallied 36% from the bottom and is only 7% below its level at the start of the year. Clearly, the financial "vaccine" has worked!


Despite the surge in new cases, daily deaths worldwide have plateaued/fallen off, with death rates, thankfully, coming off from the levels registered in April'20. This plateauing of the daily deaths coupled with the fiscal and monetary packages announced by most governments and Central Banks have propelled global markets (especially US) to pre Covid levels.

As can be seen in the below chart, US markets have been the key drivers of the rally, outperforming in both the crash as well as the bounce. Other impacted countries like UK, Spain, Italy, France, Brazil etc. have underperformed in both the crash and the bounce phase. India was one of the laggards in the first crash, but has bounced back more than most other markets.

As a result, markets like US, Japan, China and Switzerland are almost close to the levels at the start of the year. India has fallen 20%, somewhere in the middle of the pack, especially is US$ terms.

US Debt Markets: A key undertone for the equity market will be the direction in which the debt markets, especially US debt markets move. The US Fed under Jay Powell, has unleashed a monetary policy in March 2020, which builds on the "foundations" of his predecessors - Ben Bernanke and Janet Yellen. Some, would point out it goes, even further, with the declaration to buy non-investment grade Corporate Bonds. While, that announcement was electrifying, breaking, perhaps one of the oldest principles of Central Banks, not to buy High yield Corporate Bonds, its impact was as significant. Within weeks, High coupon Bond yields fell by almost 350 bps, calming the frayed edges of the debt market.
Domestic Markets:
Domestic markets have bounced in line with global markets, despite the rising cases and fatalities in the
country and the economic fallout of one of the most severe lockdowns.

Indian markets currently seem to be following global markets and the lifting of lockdown restrictions. From Lockdown Phase 1 to Unlock 1, Nifty has moved from being lower by 33% to being lower by only 14% from its pre-Covid peak. Lockdown Index has moved from 100 at the start to ~75 in Unlock 1. Economic Indicators have reversed from lows see in Phase 1 of the lockdown. Power demand is only 7.4% lower YoY as compared to bottom of -28.3% YoY. Unemployment rate is now at 8.6%, comparable to pre-lockdown period as compared to bottom of 27.1%. This reversal has contributed to the sharp up move seen in the equity markets.

Notes: Green colour signals strength/ less severity, red signals weakness/ greater severity. 1. Active cases calculated by deducting recovered cases and deaths confirmed cases; data from Bloomberg News Johns Hopkins University. 2.Oxford Covid-19 lockdown stringency index. 3. Data sourced from Centre for Monitoring Indian Economy's Consumer Pyramids Household Survey. 4. Peak traffic index for four metro cities - Delhi, Mumbai, Bangalore & Pune - from location technology company TomTom. 5. Weekly retail footfall (%, YoY) from ShopperTrak. 6. Power demand from Monday to Friday (%, YoY) from Ministry of Power. 7. Percent change relative to average flight departures in December from Flightstats. 8. Percentage change from first 5-weekday average in January from Bloomberg. 9. Premium on India 10-year government bond yield over U.S. yield from Bloomberg. 10. Banking liquidity surplus from Bloomberg Economics.
Indices Performances: Sharp crash followed by recovery


All 3 Indices - Large, Mid and Small saw a
sharp crash, followed by a recovery.
In Large Caps, the average stock was more or less in line with the index, whereas in Small Caps individual stocks saw far sharper fall than the index.
In Large Caps, the average stock was more or less in line with the index, whereas in Small Caps individual stocks saw far sharper fall than the index.
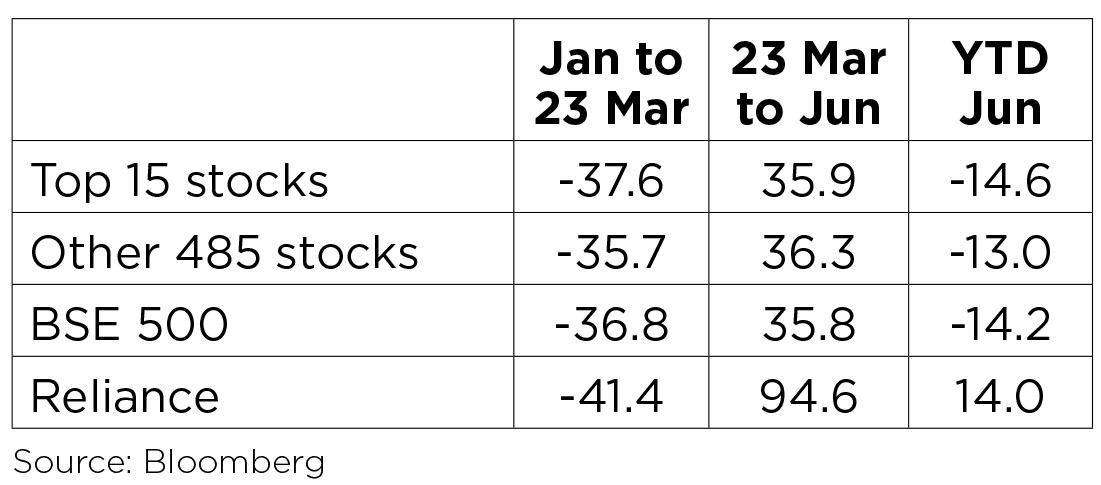
Domestic - Top 15 Stocks vs Broader Market:
Top stocks have in fact fallen in line with the market, and bounced back lower. First time after 2 years that the top 15 stocks as a whole have actually underperformed the market.
Top stocks have in fact fallen in line with the market, and bounced back lower. First time after 2 years that the top 15 stocks as a whole have actually underperformed the market.

Capital Flows: FPIs recorded net inflows of US$2.5bn into Indian equities in June (vs. inflow of US$1.7bn in May). YTD, FPIs have sold US$2.2bn of Indian equities. FPIs recorded net outflows from debt markets at US$224mn in June, the fourth consecutive month of outflows.

Sectoral Impact
On the sectoral front, Telecom and HealthCare have been the key outperformers, outperforming the BSE500 both
in the crash as well as the bounce. PSU Banks, Caps Goods, Infra, Metals and Private Banks (surprise, surprise!!!) have
underperformed in both the phases.Traditional defensives - IT, FMCG, Utilities outperformed in the crash but have underperformed in the bounce. Auto and Oil & Gas (courtesy Reliance) have bounced back sharply after underperforming in the crash.


Economic Recovery post Lockdown
High-frequency data show a rebound in economic activity continued in June. The Google mobility data (weekly average for 23 June) shows improvement in mobility trends. Essential services like groceries and pharmacies are now close to pre-lockdown levels (-3%) from -13% in end May and -46% in end April. However, mobility for discretionary services like recreation and entertainment remains 58% below prelockdown levels, though it has increased from -70% (end-May) and -85% (end Apr). Workplace mobility has also improved to -38% (vs. -44% in end-May and -65% in end-Apr).
► Unemployment rate as reported by the CMIE has fallen significantly from a peak of 27% in May to 8.6% in June, inching closer to the pre-Covid level of sub-8.4%.
► From -24% YoY in April to - 15% YoY in May and the 1H of June, Indian power demand further improved to -6.2% YoY in the 2H of June, taking the full month of June 2020 to -10.5% YoY.
► The YoY decline in Fuel consumption and E-Way bills has been reducing.
► National Electronic Toll Collections are 6x the levels seen in April.
The Macro Picture
Bond Yields and Currency: Benchmark 10-year treasury yields averaged at 5.83% in June (5bps lower
vs. the May avg.). On month end values, the 10Y yield increased 12bps to end the month at 5.89%. INR
appreciated by 0.1% and ended the month at 75.51/$ in June.Forex Reserves: India's FX reserves are close to their all-time peak at US$505.6bn as of 19 June. FX reserves have increased by US$15.5bn in the last four weeks.
Fiscal Deficit: Fiscal deficit for Apr-May came in at Rs.4.7tn or 58.6% of the budgeted FY21 deficit (Rs.8.0tn). This compares to 47.7% reached during the same time frame in FY20.
Trade Deficit: India's monthly trade deficit for May came in at US$3.2bn and declined by US$3.6bn mom. The print was meaningfully below consensus expectations of ($7.1bn). The aggregate trade balance (goods and services) was in a surplus of US$4bn in May (vs. US$0.3bn surplus in April). These two months were the first time in four years that the aggregate trade balance was in a surplus, with May being the highest recorded surplus in the series.
Brent Crude: The Brent oil price gained 12% mom in June to end the month at US$40.9/bbl. following a 55% mom gain in May. YTD, oil prices are still ~40% down.
Manufacturing PMI: India's manufacturing PMI has improved sharply from the lows of April.
Cumulative rainfall: It is +20% above long-period average (LPA) levels on an aggregate basis (over 1-28 June 2020) as the monsoon season has covered the nation ahead of schedule. The all-India monsoon coverage is12 days ahead of its normal schedule. Previously, such early coverage happened in 2013. Out of the 36 meteorological subdivisions, rainfall has so far been excess/normal in 32 meteorological subdivisions and deficient in four.
Q4 and FY20 Earnings
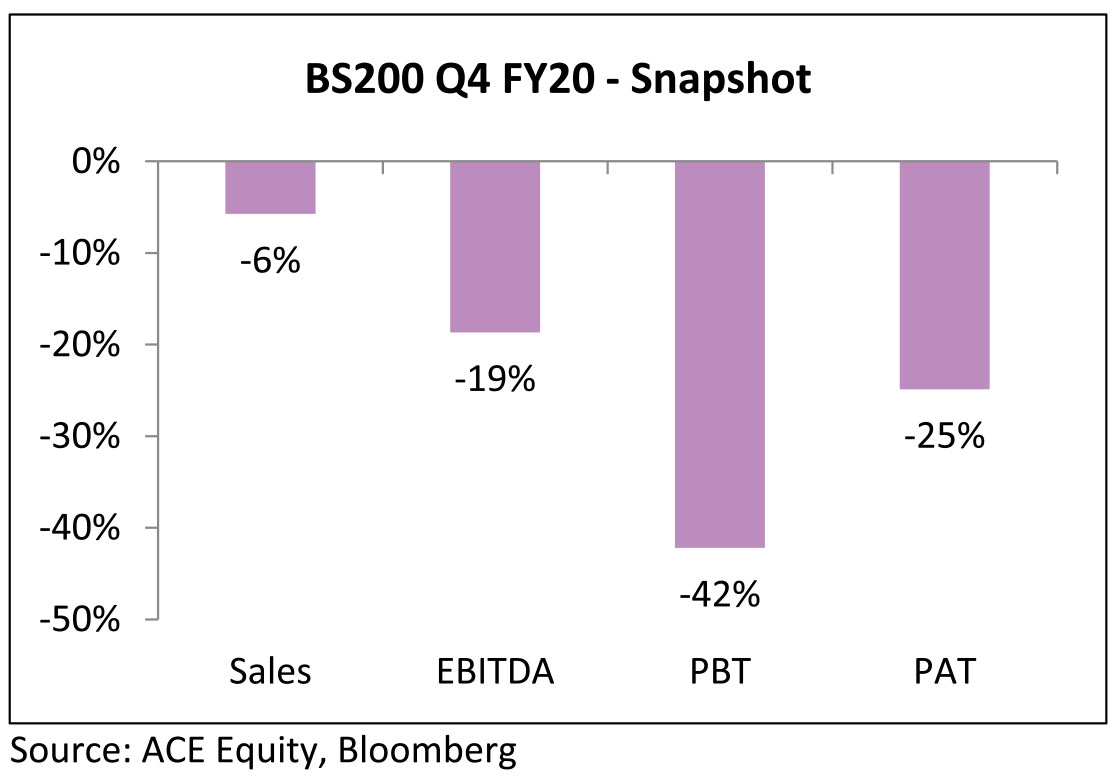
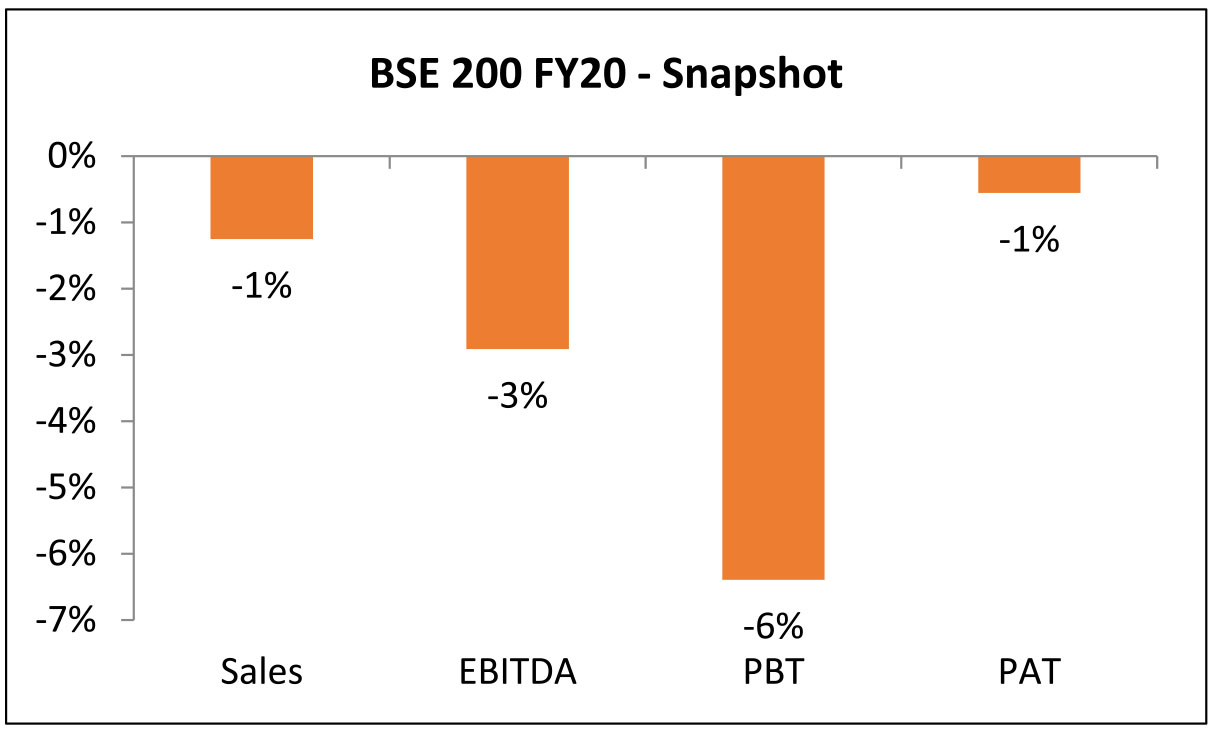
BSE 200 Q4 FY20 earnings saw a 6% YoY Sales de-growth and 25% PAT de-Growth.

De-Growth was led by large one-off inventory losses in Oil & Gas Companies, whereas Corp Banks, Cement and Telecom had the biggest positive contribution.

Source: ACE Equity, Bloomberg, figures denote PAT in Rs
bn
Note: Auto is ex Tata Motors and Energy is ex Reliance. Aggregates for FY 19 & 20 are incl of both
Note: Auto is ex Tata Motors and Energy is ex Reliance. Aggregates for FY 19 & 20 are incl of both

As can be seen in the below chart, decade of FY11 to FY20 has been weak in terms of earnings growth. First 5 years of the decade saw an earnings CAGR of 8.5% (FY 10-15) and next 5 have seen earnings CAGR of 3.5% (FY 15-20), which is much lower than the double-digit nominal GDP growth rate over this period. In the first 5 years, valuation rerating boosted returns, but valuation rerating cannot drive returns all the time. In the second 5 years, the ensuing derating has dampened returns, resulting in a subpar decade from an equity market perspective.


Source: ACE Equity, Bloomberg
Valuation
Market cap-to-GDP ratio has been volatile as it moved from 79% in FY19 to 56% (FY20 GDP) in Mar'20 to 71% now (FY21E GDP) - near the long-term average of 73%.

► For the Nifty, Price to Book is lower than historical average. Positive PE, i.e. PE of only profit-making Nifty companies, is back to +1 Std Dev from long term average, after falling below its long term average in March.
► For Mid-Caps, both PE and PB are close to historical averages, after falling to 1 Std Dev below in the crash.
► For Small Caps, both PE and PB are close to historical averages, after falling to 1 Std Dev below in the crash.
Outlook
As we start investing for a new decade, as always looking back provides several insights to focus on:Technology was the clear winner, post GFC: It would not be unwarranted to label the last ten years as the Decade of Technology: FAANG (Facebook, Amazon, apple, Netflix and Google), Chinese internet companies - Alibaba, Baidu, Tencent have ruled the markets. All the best performing indices are top heavy with technology, Indices across Europe and India, bereft, of such companies have lagged. No wonder, Nasdaq 100, was the first index to post positive gains on a y-o-y basis.
US Fed was the pivot: Long back in 1996, the then US Fed Chairman, Alan Greenspan warned US equity markets of irrational exuberance, equity markets it seemed "taunted" him by surging higher, culminating in the tech bubble of 2000. Post, March 2009, equity markets look for signalling from US Fed, the Bernanke "Put", a Powell "Pivot" have as much influence if not greater influence than any other fundamental measure - P/E, PAT growth etc. The last decade has clearly belonged to nudges and messaging from the US Fed.
Emerging Markets became a chimera: Is China, really an emerging economy? The second largest economy in the world, has little in common with the other components of the BRICS. Even with China, MSCI Emerging Markets underperformed US throughout the decade, without it, the performance was disastrous. No longer can emerging countries play the growth card. US and China, over the last three years have grown at a faster pace. The leitmotif of investing in emerging economies to participate in higher economic growth has been shaken and stirred during the last decade.
Markets will have tiers: FAANGS ruled S&P 500 and similarly, the top 15 in the Nifty outperformed. A clear sign of anaemic earnings growth which characterized the last decade. Compounding this issue is the relentless march of passive money. Even in India, ETF tracking Nifty50 has become the largest equity fund in less than half a decade and it continues to grow.
Growth trounced Value: In US, this could be called a "fair" fight - An Apple, Google, Microsoft some of the ley luminaries of the tech "gang" reported impressive earnings growth, distributed or bought back capital clearly outperforming the S&P 500. In India, a 42x multiple for a company reporting a decadal growth in PAT of 12% only showed the lack of choices rather than the case for Growth over Value.
2020-30: Earnings growth, a repeat of 2010-20 or 2000-10? Clearly, the paucity of earnings growth was the key characteristic, unlike the earlier decade. Does a low starting point become an advantage - while India underwent a slow economic rebound from 98-02, it did set us up for the "mother" of all bull runs in 2000-10 decade. On the other hand, 2010-20, in contrast reflected the high base of growth experienced during the earlier decade. Will the de-growth in earnings expected in 2020, set us up nicely for comparison on earnings growth going forward?


Investing in Covid Times:
The remarkable recovery in Europe after the grim medical "battle lines" in April and May present an interesting study of a post Covid World. Aided by fiscal stimulus, aimed at protecting employee jobs and salaries, personal savings rates have zoomed in Europe, especially Germany, where the Government was the most generous. In May'20 the monthly deposit was at an all time high. Similar has been the case in US, where several studies have shown that US Congress approved employment benefits have been much higher than the monthly salary! Demand generation has been a mixed bag, while China reported a spurt in personal vehicle sales, as citizens shunned public transport, the same is not evident in western Europe. High end fashion and luxury, too has seen muted demand revival. Staples, which did not much of decline continue to report strong demand as eating out is still impacted either by Government shut down or consumer worry of social distancing.
In India, a deluge of webinar and expert calls, probably increased "shallow" knowledge levels to an alltime high levels. Travel, tourism, hotels, retail apparel continue to be the sectors most impacted by the lockdown. Two wheelers, tractor, fertilizers, agrochemicals have reported the most robust growth rates and are tipped to reach pre-Covid levels fastest. Pharmaceuticals, after three long years in wilderness, came back with a vengeance, after consolidating, is one of the sectors which is most favoured to re-start its outperformance with stable domestic growth and a push in export markets, especially US and Europe. Technology after a weak Q1 FY 21, is expected to benefit from the recovery in Europe and US for the rest of the year, a Democrat winning the US Presidential election could boost as H1B visas will get reinstated. Auto and auto ancillary with large aftermarket is another segment, which could see revival in the second half of FY21.
Banking and NBFCs, the largest segment in the indices, continues to be dogged by Moratorium, thus the "quality" of earnings till Q3 FY21 will remain suspect. Most company managements have focused on ensuring that FY20 net worth remains intact in FY21, i.e. nominal profits at best, as provisions could zoom due to high NPAs especially in the unsecured personal and SME/MSME loan segments.
Beware of the 'Penny' Stocks: In the recent bounce, the best performing segment of the market has been penny stocks. Volumes in cash segment, from non-institutional holders are at a record high which points to the active involvement of non-institutional investors in the penny stock segment. Investors should not confuse excitement and thrill with long term wealth creation. The key to have a winning strategy in a casino is knowing when to stop.
The theme, clearly is to be overweight on segments where FY22 PAT could exceed FY 20 - this could be the new holy grail of investing in post-Covid times. Not all businesses will be able to sprint back to FY20 levels at the same time, will those who fall be left behind (consigned to the "value" investor), as winners don't look back?
As Tim Harford, my favourite columnist writing in Financial Times commented "My guess is that clever statisticians will be able to detect the psychological aftershocks of the pandemic for decades to come - but that to a casual gaze, everyday life in 2022 will look a lot like it did in 2018. Scars do not always heal, but they fade."
For the investor, the roller coaster ride of the equity markets since March, itself may have influenced their behaviour towards this asset class (Not for me). Going ahead, post the pandemic, economic growth will be uneven and difficult to forecast. The key would be to stay invested and participate in the recovery which will unfold in the future.
Stay Safe, Stay at home.
Disclaimer: MUTUAL FUND INVESTMENTS ARE SUBJECT TO MARKET RISKS, READ ALL SCHEME RELATED DOCUMENTS CAREFULLY.
The Disclosures of opinions/in house views/strategy incorporated herein is provided solely to enhance the transparency about the investment strategy / theme of the Scheme and should not be treated as endorsement of the views / opinions or as an investment advice. This document should not be construed as a research report or a recommendation to buy or sell any security. This document has been prepared on the basis of information, which is already available in publicly accessible media or developed through analysis of IDFC Mutual Fund. The information/ views / opinions provided is for informative purpose only and may have ceased to be current by the time it may reach the recipient, which should be taken into account before interpreting this document. The recipient should note and understand that the information provided above may not contain all the material aspects relevant for making an investment decision and the security may or may not continue to form part of the scheme's portfolio in future. Investors are advised to consult their own investment advisor before making any investment decision in light of their risk appetite, investment goals and horizon. The decision of the Investment Manager may not always be profitable; as such decisions are based on the prevailing market conditions and the understanding of the Investment Manager. Actual market movements may vary from the anticipated trends. This information is subject to change without any prior notice. The Company reserves the right to make modifications and alterations to this statement as may be required from time to time. Neither IDFC Mutual Fund / IDFC AMC Trustee Co. Ltd./ IDFC Asset Management Co. Ltd nor IDFC, its Directors or representatives shall be liable for any damages whether direct or indirect, incidental, punitive special or consequential including lost revenue or lost profits that may arise from or in connection with the use of the information.
Mr. Suyash Choudhary
Head - Fixed Income
WHAT WENT BY
Bond yields rallied on the short end driven by surplus liquidity while longer end bonds underperformed
marginally due to slight supply fatigue resulting in steepening of the curve. The 10 year benchmark Govt bond
closed 11bps higher 5.89% while the 5 year Gsec ended the month 17bps lower at 5.28%.
Moody's downgraded India's sovereign ratings to Baa3 (negative outlook) from Baa2 (negative outlook) previously. With this, Moody's ratings were at par with S&P and Fitch (both rate India at BBB-, stable outlook), although Moody's retained the 'negative' outlook, after the downgrade citing growth concerns & fiscal stress. According to Moody's factors which are slowing Indian growth, include weak private investment, slow employment generation, and credit constraints under a burdened financial system. However, the rating agency expects a steep recovery in FY2022, followed by ~6% YoY growth persisting post that period.
The MPC released its minutes of the policy wherein members expressed concerns on growth - with full year's growth estimated to be in the contractionary territory & the possibility of a lowering in potential output. Inflation was not considered to be of a material concern, with the current upside in food inflation being attributed to temporary supply side disruptions and expectations of it moving downwards in the coming months. Committee members also expressed need to continue to focus on easing financial conditions to provide an enabling environment to kick-start growth when normalcy is resumed, especially given that monetary conditions driven by reserve money and money supply were also fragile at the moment & stressed Importance of banks to remain adequately capitalised.
Ministry of statistics released a truncated CPI data covering around 69% of CPI basket due to restrictions in movement. Food inflation eased to a 7-month low of 7.38%YoY from 8.61% in Apr-20. The downside was driven prominently by Vegetables which saw higher mandi arrivals (-10.7%MoM) along with Sugar & confectionary (-3.1%MoM).
India's merchandise trade deficit narrowed sharply to its 11-year low of USD 3.2 bn in May-20 from USD 6.8 bn in Apr-20. This marks the second merchandise trade print amidst the nationwide lockdown although exports gathered momentum in May-20 to USD 19.1 bn from USD 10.4 bn in Apr-20 as most countries started easing lockdown restrictions in a gradual manner. Sequential improvement was primarily driven by: Engineering Goods (+USD 3.3 bn), Gems & Jewellery (+USD 1.0 bn), Chemicals (+USD 0.6 bn), & Pharma Products (+USD 0.4 bn). Imports also improved to USD 22.2 bn in May-20 from USD 17.1 bn in Apr-20 as domestic restrictions eased gradually. The sequential improvement was primarily driven by: Electronic Goods (+USD 1.3 bn), Base Metals (+USD 1.1 bn), Machinery Equipment (+USD 0.8 bn), and Gems & Jewellery (+USD 0.4 bn).
India's current account registered a marginal surplus of 0.1% of GDP (USD 0.6 bn) in Q4 FY20 vis-à-vis a deficit of 0.7% of GDP (USD 4.6 bn) in Q4 FY19 and a deficit of 0.4% of GDP (USD 2.6 bn) in Q3 FY20.
The ECB announced an increased in the size of its Pandemic Emergency Purchases Program (PEPP) by EUR 600 bn to EUR 1350 bn, extended the duration of the program in to 2021 and committed to reinvesting maturing securities under the PEPP program until end-2022. US non-farm payrolls increases by 2.5 mn in May-20 against expectations of 10 mn loss and a previous reading of 20 mn job losses in April-20 while unemployment dropped from 14.7% in April to 13.3% in May. The FOMC meeting was in line with expectations. The Fed Chair emphasized that downside risks remained in place that will to a great degree remain contingent on whether there is a second-wave of infections that sets in. He reiterated that Asset purchases program are expected to continue at least at the current rate and FOMC will employ all tools available to support the economy and the flow of credit in to the economy.
RBI has been quite proactive so far in conventional policy with respect to rates and liquidity. So much so that it has led us to recently assess that further moves in this direction may be down the path of diminishing marginal utility (https://idfcmf.com/article/1927). What it has arguably done lesser on is with respect to the markets for financing. While addressing credit spreads would have been trickier, the general assessment (including ours) has been that it could have been more proactive in the market for sovereign financing and hence on term spreads.
However, on further thought one can argue that RBI understands that it has to play a long game. And hence what it's offering the market is of the nature of a "passive put". This was somewhat revealed in the following statement in the document on regulatory measures in the May policy.
"In response to COVID-19, the requirement of fiscal resources has increased with likely implications for market conditions going forward. The RBI shall remain watchful and support the smooth completion of the borrowing programme of the Centre and States in the least disruptive manner."
Thus it is ensuring that the mammoth amount of the government's financing requirement goes through without incremental tightening to financial conditions, presumably evidenced as a rise in yields. Looked at this way, it would amount to an enviable execution should it manage to do so. It must also be said that it has been fairly successful so far. However given that the bulk of the bond supply lies ahead of us , and with a strong likelihood of a further upward revision in the borrowing calendar, RBI's firepower may be better used later than now. This also means that bond market investors may have to cease looking for active support from the central bank that is aimed at substantially bringing down yields across the curve, but rather settle for a still strong passive support that disallows yields across the curve from rising while providing dollops of commercial incentive to buy bonds, by keeping overnight rates very low and liquidity abundant. Thus bond investors may have to choose their own best suited risk versus reward points on the yield curve. This currently looks to us to be 6 -7 year bonds on the sovereign curve, and these now constitute our most overweight positions for our active duration funds. As always views may change basis changes to information, perception and / or assumptions.
The 3 clear themes for the bond market continue:
► Focus has to be on best quality AAA and sovereign / quasi sovereign. There is no macro logic whatsoever for pursuing high yield strategies. The inherent illiquidity in that segment has now been amplified while many balance sheets will possibly continue to see steady deterioration.
► The best risk versus reward continues to be in the front end (upto 5 year) in our view.
► While duration is attractive given the wider term spread and when compared to nominal growth rate expectations, sustained performance here is still dependent upon the unveiling of a credible financing plan from the RBI for the enhanced borrowing program of the sovereign.
Disclaimer: MUTUAL FUND INVESTMENTS ARE SUBJECT TO MARKET RISKS, READ ALL SCHEME RELATED DOCUMENTS CAREFULLY.
The Disclosures of opinions/in house views/strategy incorporated herein is provided solely to enhance the transparency about the investment strategy / theme of the Scheme and should not be treated as endorsement of the views / opinions or as an investment advice. This document should not be construed as a research report or a recommendation to buy or sell any security. This document has been prepared on the basis of information, which is already available in publicly accessible media or developed through analysis of IDFC Mutual Fund. The information/ views / opinions provided is for informative purpose only and may have ceased to be current by the time it may reach the recipient, which should be taken into account before interpreting this document. The recipient should note and understand that the information provided above may not contain all the material aspects relevant for making an investment decision and the security may or may not continue to form part of the scheme's portfolio in future. Investors are advised to consult their own investment advisor before making any investment decision in light of their risk appetite, investment goals and horizon. The decision of the Investment Manager may not always be profitable; as such decisions are based on the prevailing market conditions and the understanding of the Investment Manager. Actual market movements may vary from the anticipated trends. This information is subject to change without any prior notice. The Company reserves the right to make modifications and alterations to this statement as may be required from time to time. Neither IDFC Mutual Fund / IDFC AMC Trustee Co. Ltd./ IDFC Asset Management Co. Ltd nor IDFC, its Directors or representatives shall be liable for any damages whether direct or indirect, incidental, punitive special or consequential including lost revenue or lost profits that may arise from or in connection with the use of the information.
Moody's downgraded India's sovereign ratings to Baa3 (negative outlook) from Baa2 (negative outlook) previously. With this, Moody's ratings were at par with S&P and Fitch (both rate India at BBB-, stable outlook), although Moody's retained the 'negative' outlook, after the downgrade citing growth concerns & fiscal stress. According to Moody's factors which are slowing Indian growth, include weak private investment, slow employment generation, and credit constraints under a burdened financial system. However, the rating agency expects a steep recovery in FY2022, followed by ~6% YoY growth persisting post that period.
The MPC released its minutes of the policy wherein members expressed concerns on growth - with full year's growth estimated to be in the contractionary territory & the possibility of a lowering in potential output. Inflation was not considered to be of a material concern, with the current upside in food inflation being attributed to temporary supply side disruptions and expectations of it moving downwards in the coming months. Committee members also expressed need to continue to focus on easing financial conditions to provide an enabling environment to kick-start growth when normalcy is resumed, especially given that monetary conditions driven by reserve money and money supply were also fragile at the moment & stressed Importance of banks to remain adequately capitalised.
Ministry of statistics released a truncated CPI data covering around 69% of CPI basket due to restrictions in movement. Food inflation eased to a 7-month low of 7.38%YoY from 8.61% in Apr-20. The downside was driven prominently by Vegetables which saw higher mandi arrivals (-10.7%MoM) along with Sugar & confectionary (-3.1%MoM).
India's merchandise trade deficit narrowed sharply to its 11-year low of USD 3.2 bn in May-20 from USD 6.8 bn in Apr-20. This marks the second merchandise trade print amidst the nationwide lockdown although exports gathered momentum in May-20 to USD 19.1 bn from USD 10.4 bn in Apr-20 as most countries started easing lockdown restrictions in a gradual manner. Sequential improvement was primarily driven by: Engineering Goods (+USD 3.3 bn), Gems & Jewellery (+USD 1.0 bn), Chemicals (+USD 0.6 bn), & Pharma Products (+USD 0.4 bn). Imports also improved to USD 22.2 bn in May-20 from USD 17.1 bn in Apr-20 as domestic restrictions eased gradually. The sequential improvement was primarily driven by: Electronic Goods (+USD 1.3 bn), Base Metals (+USD 1.1 bn), Machinery Equipment (+USD 0.8 bn), and Gems & Jewellery (+USD 0.4 bn).
India's current account registered a marginal surplus of 0.1% of GDP (USD 0.6 bn) in Q4 FY20 vis-à-vis a deficit of 0.7% of GDP (USD 4.6 bn) in Q4 FY19 and a deficit of 0.4% of GDP (USD 2.6 bn) in Q3 FY20.
The ECB announced an increased in the size of its Pandemic Emergency Purchases Program (PEPP) by EUR 600 bn to EUR 1350 bn, extended the duration of the program in to 2021 and committed to reinvesting maturing securities under the PEPP program until end-2022. US non-farm payrolls increases by 2.5 mn in May-20 against expectations of 10 mn loss and a previous reading of 20 mn job losses in April-20 while unemployment dropped from 14.7% in April to 13.3% in May. The FOMC meeting was in line with expectations. The Fed Chair emphasized that downside risks remained in place that will to a great degree remain contingent on whether there is a second-wave of infections that sets in. He reiterated that Asset purchases program are expected to continue at least at the current rate and FOMC will employ all tools available to support the economy and the flow of credit in to the economy.
Outlook
Covid is not a one-time shock but will rather amplify many previous global trends and embedded weaknesses.
For India particularly because of previous growth constraints, related vulnerabilities in the lending system, and
a somewhat bloated public deficit, the post Covid world will require a careful navigation. While challenges
look daunting currently there are obvious starting advantages including a largely domestically financed debt
profile and a stable external account. These advantages have to be leveraged and sustained in the time ahead
even as public policy needs to be decisive and precise in order to optimize growth given constraints.RBI has been quite proactive so far in conventional policy with respect to rates and liquidity. So much so that it has led us to recently assess that further moves in this direction may be down the path of diminishing marginal utility (https://idfcmf.com/article/1927). What it has arguably done lesser on is with respect to the markets for financing. While addressing credit spreads would have been trickier, the general assessment (including ours) has been that it could have been more proactive in the market for sovereign financing and hence on term spreads.
However, on further thought one can argue that RBI understands that it has to play a long game. And hence what it's offering the market is of the nature of a "passive put". This was somewhat revealed in the following statement in the document on regulatory measures in the May policy.
"In response to COVID-19, the requirement of fiscal resources has increased with likely implications for market conditions going forward. The RBI shall remain watchful and support the smooth completion of the borrowing programme of the Centre and States in the least disruptive manner."
Thus it is ensuring that the mammoth amount of the government's financing requirement goes through without incremental tightening to financial conditions, presumably evidenced as a rise in yields. Looked at this way, it would amount to an enviable execution should it manage to do so. It must also be said that it has been fairly successful so far. However given that the bulk of the bond supply lies ahead of us , and with a strong likelihood of a further upward revision in the borrowing calendar, RBI's firepower may be better used later than now. This also means that bond market investors may have to cease looking for active support from the central bank that is aimed at substantially bringing down yields across the curve, but rather settle for a still strong passive support that disallows yields across the curve from rising while providing dollops of commercial incentive to buy bonds, by keeping overnight rates very low and liquidity abundant. Thus bond investors may have to choose their own best suited risk versus reward points on the yield curve. This currently looks to us to be 6 -7 year bonds on the sovereign curve, and these now constitute our most overweight positions for our active duration funds. As always views may change basis changes to information, perception and / or assumptions.
The 3 clear themes for the bond market continue:
► Focus has to be on best quality AAA and sovereign / quasi sovereign. There is no macro logic whatsoever for pursuing high yield strategies. The inherent illiquidity in that segment has now been amplified while many balance sheets will possibly continue to see steady deterioration.
► The best risk versus reward continues to be in the front end (upto 5 year) in our view.
► While duration is attractive given the wider term spread and when compared to nominal growth rate expectations, sustained performance here is still dependent upon the unveiling of a credible financing plan from the RBI for the enhanced borrowing program of the sovereign.
Disclaimer: MUTUAL FUND INVESTMENTS ARE SUBJECT TO MARKET RISKS, READ ALL SCHEME RELATED DOCUMENTS CAREFULLY.
The Disclosures of opinions/in house views/strategy incorporated herein is provided solely to enhance the transparency about the investment strategy / theme of the Scheme and should not be treated as endorsement of the views / opinions or as an investment advice. This document should not be construed as a research report or a recommendation to buy or sell any security. This document has been prepared on the basis of information, which is already available in publicly accessible media or developed through analysis of IDFC Mutual Fund. The information/ views / opinions provided is for informative purpose only and may have ceased to be current by the time it may reach the recipient, which should be taken into account before interpreting this document. The recipient should note and understand that the information provided above may not contain all the material aspects relevant for making an investment decision and the security may or may not continue to form part of the scheme's portfolio in future. Investors are advised to consult their own investment advisor before making any investment decision in light of their risk appetite, investment goals and horizon. The decision of the Investment Manager may not always be profitable; as such decisions are based on the prevailing market conditions and the understanding of the Investment Manager. Actual market movements may vary from the anticipated trends. This information is subject to change without any prior notice. The Company reserves the right to make modifications and alterations to this statement as may be required from time to time. Neither IDFC Mutual Fund / IDFC AMC Trustee Co. Ltd./ IDFC Asset Management Co. Ltd nor IDFC, its Directors or representatives shall be liable for any damages whether direct or indirect, incidental, punitive special or consequential including lost revenue or lost profits that may arise from or in connection with the use of the information.


