Commentary
30th September 2020
WHAT WENT BY
Global Markets
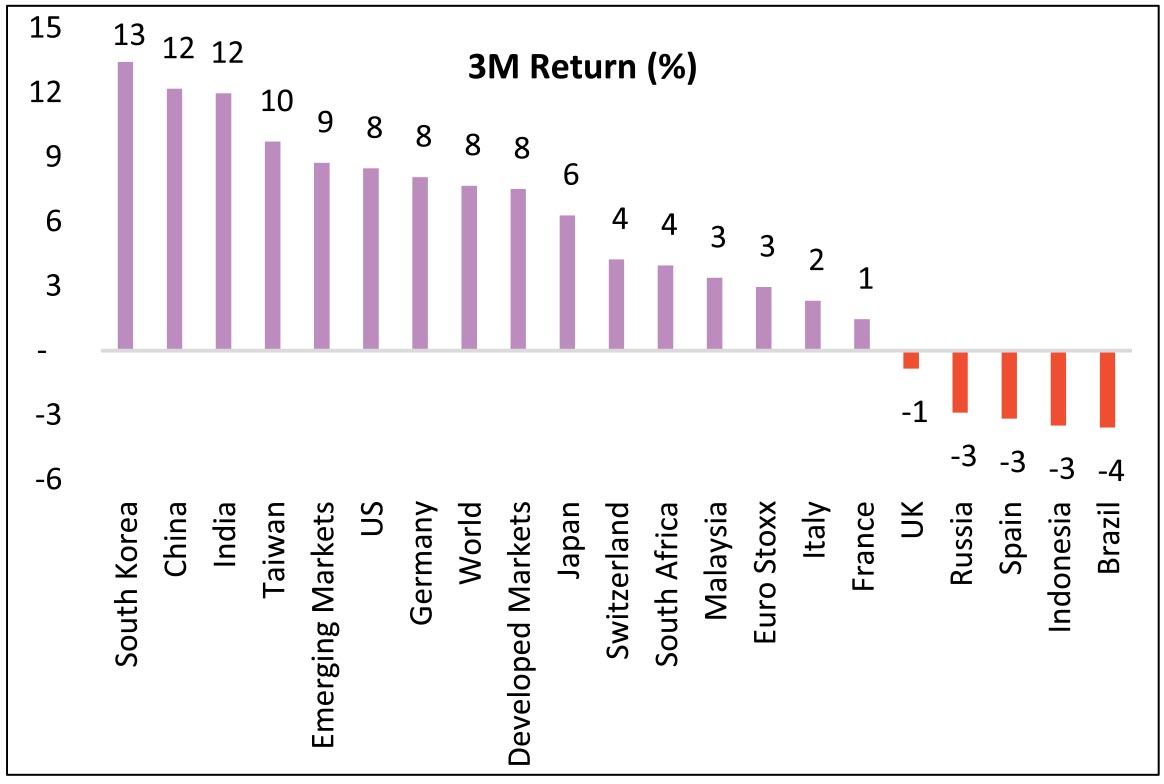
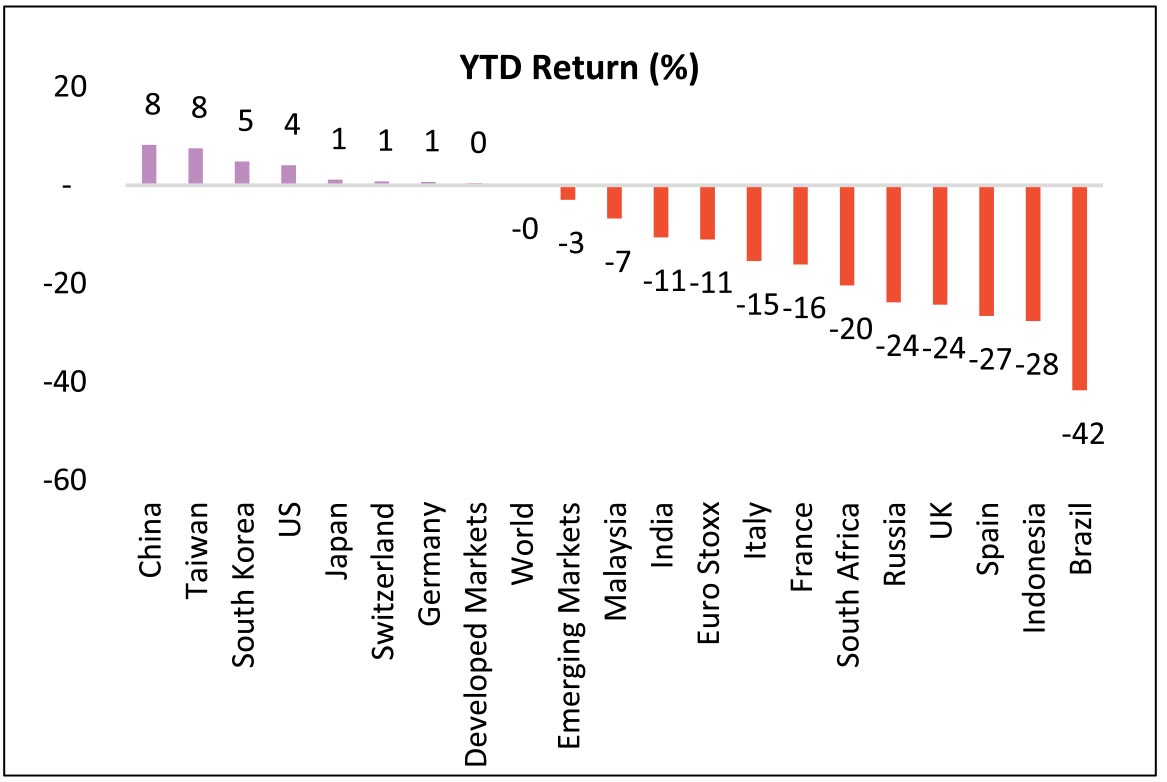
Global Markets continued the strong upmove in the September quarter. India was among the better performing
markets in the last quarter, though on a YTD basis, it has marginally underperformed. Among the large economies,
China and US stock markets continue to drive the global rally.
Source: Bloomberg
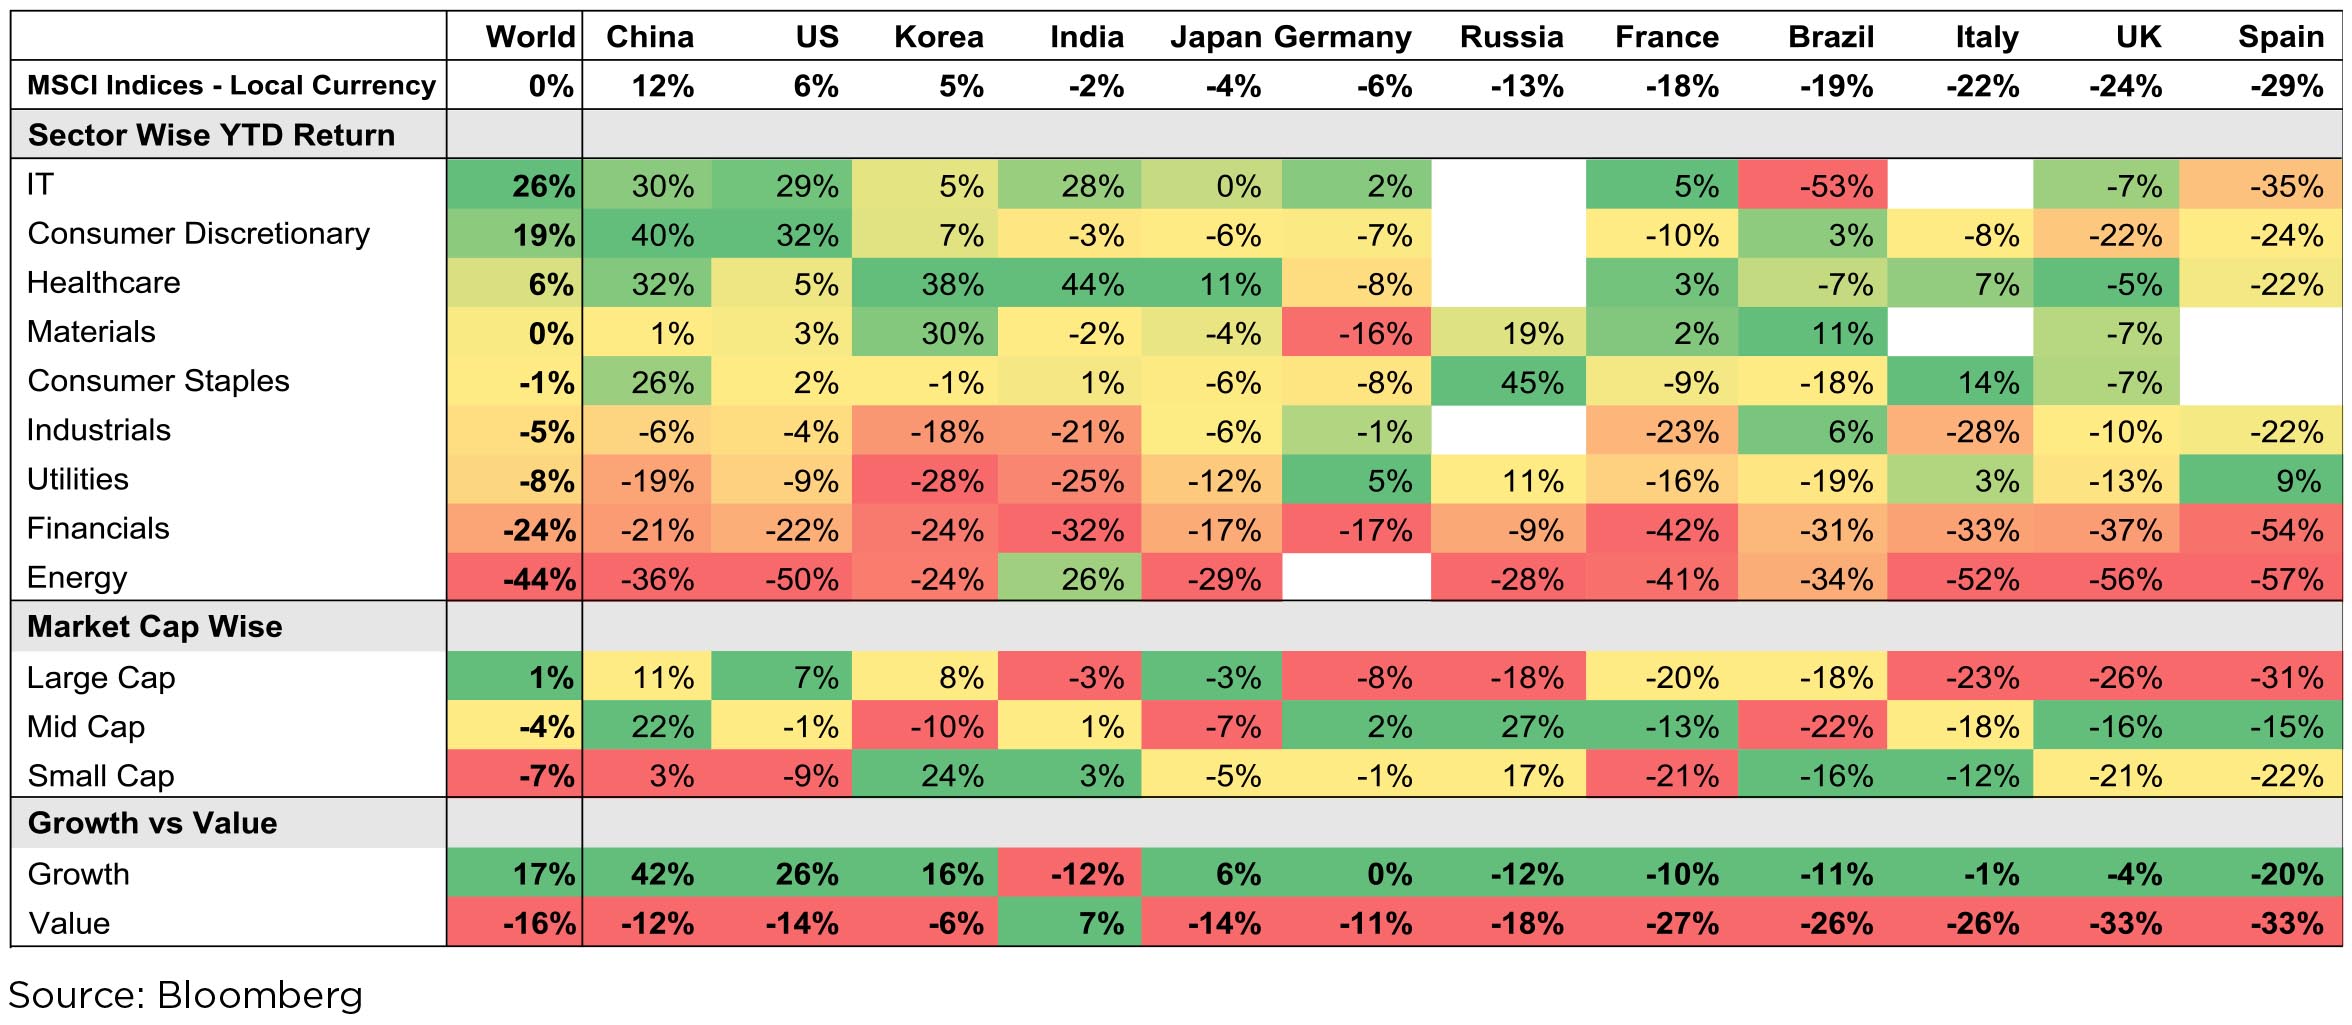
IT, Consumer Discretionary (Ecommerce) and Healthcare lead the pack globally. In India, IT & HealthCare lead the pack in line with global markets. In India, Discretionary has been a laggard as India has no meaningful Ecommerce player, except Reliance which gets categorized under 'Energy'. Clear global trend of outperformance of 'Growth' over 'Value' with growth stocks significantly outperforming Value. India is only exception where MSCI Value has outperformed and that too due to 41% weight in 2 stocks - 27% in Reliance and 14% in Infosys.
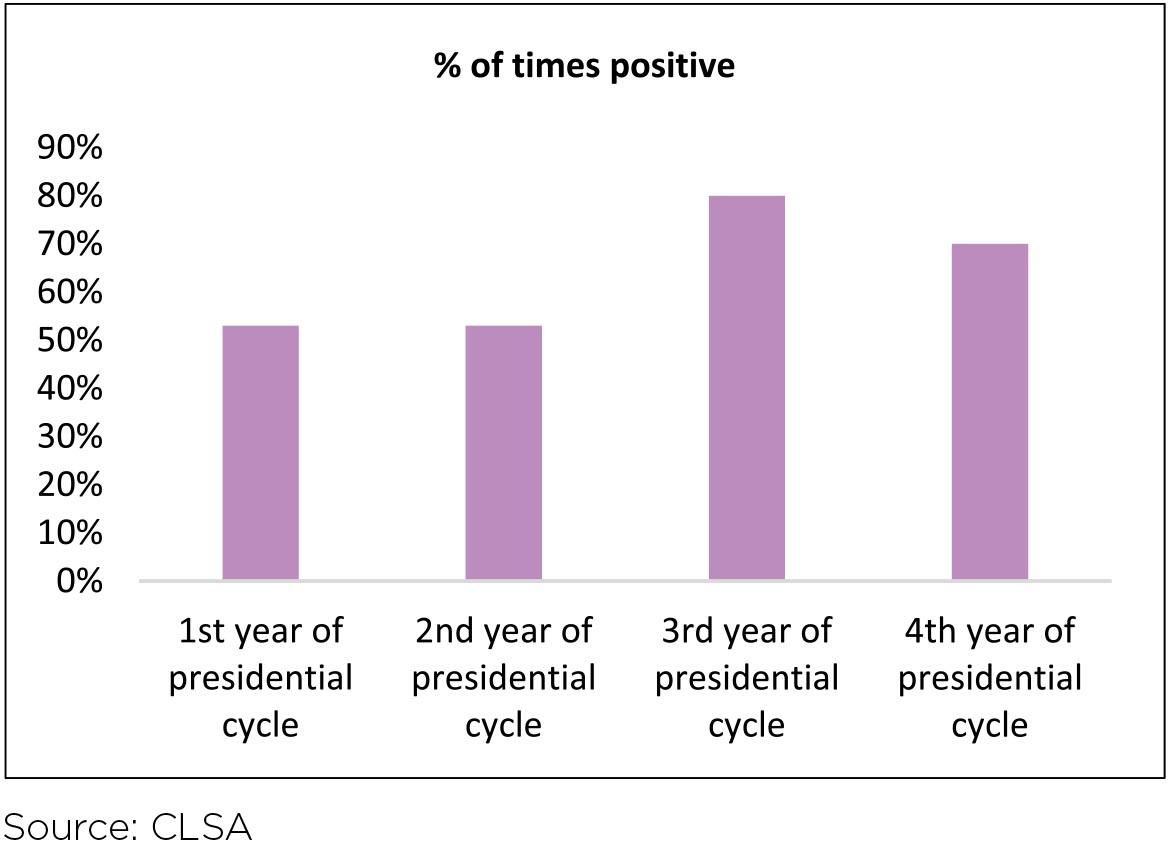
US Elections: US elections are slated to be held in the first week of November. Currently, the Democratic party candidate holds a significant lead over the incumbent Republican candidate. Despite Democrat candidate Joe Biden announcing reversion in Corporate Tax Rates to 27%, markets are not showing any signs of nervousness. A democratic victory could lead to stricter regulatory regime, which could impact business confidence going forward. Historically, US stock markets have been positive 70%+ times in the 4th year of a presidential cycle. Also, in case of an incumbent victory, markets tend to outperform compared to a regime change.
COVID impact: Globally, daily new cases seem to have plateaued and daily deaths seem to be tapering downwards - both good signs. Though, the differential across countries has been quite high with some countries seeing second waves while the first wave seems to be receding for others. Mass vaccination is at least 6-9 months away, so the scare of large 2nd and 3rd waves especially in the winter remains.
Domestic markets have been broad-based with broader markets outperforming the Nifty 50, first time after 2 years.
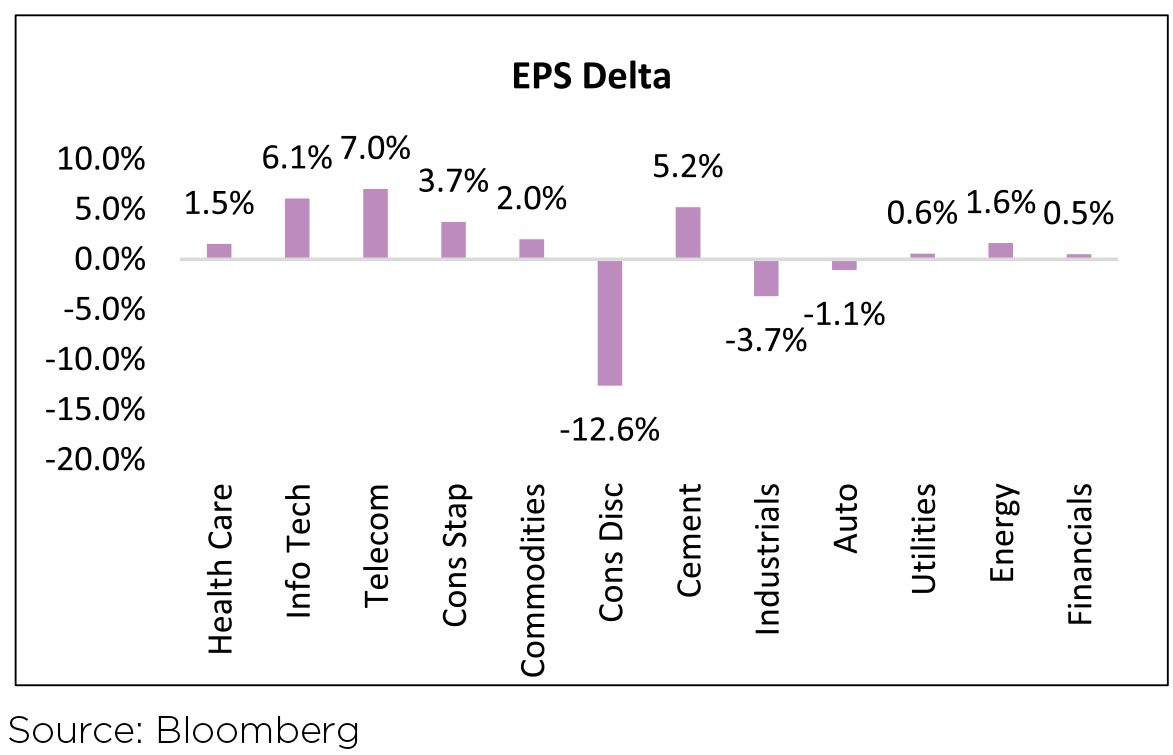
After the trough seen in the June quarter, earnings estimates for FY22 across sectors have seen upgrades.
Domestic Coronavirus updates: Daily new COVID- 19 cases have averaged ~87k in September vs. ~64k in August. However, the daily case count which increased to 90k+ cases for 11 consecutive days during the month, has now declined to ~83k cases (average of last seven days). Globally, India has the third highest number of deaths at ~99k behind US and Brazil. However, the mortality rate has been trending lower at ~1.6% (vs. 1.9% in August); while recovery rate continues to pick up ~83% (vs. ~75% at end-August). COVID-19 continues to broaden its geographical reach within the country. ICMR's (Indian Council of Medical Research) second sero survey stated that ~7.1% of the adult population is estimated to be exposed to COVID-19. A considerable population is still vulnerable and susceptible to COVID-19. Further, ICMR noted that the risk in urban slums is twice than that in non-slum areas and four times the risk in rural setting.
Unlock 5.0: Both State and Central governments have further eased restrictions in Unlock 5.0 guidelines for October except for containment zones. Under the new guidelines, cinemas, theatres and multiplexes can open with maximum 50% seating capacity. States and UTs (Union Territories) can decide on reopening of schools and other educational institutions, although attendance will not be mandatory.
Capital Flows: After record monthly net inflows in August, FPIs turned net sellers in September with outflows of USD731mn from Indian equities (vs. inflow of USD6.1bn in August). YTD, FPIs remain net buyers at USD4.1bn in Indian equities. FPIs recorded net inflows in the debt markets at USD569mn in September, first month of net inflows after six consecutive months of outflows. YTD, FPIs have sold USD14.5bn in the debt markets. DIIs were marginal net equity buyers of USD15mn in September (vs. outflows of USD1.5bn in August). While Insurance Funds turned net buyers in September, Mutual Funds (MFs) remained net sellers. MFs were net equity sellers at USD636mn; while insurance funds bought USD517mn of equities in September.
Monsoon trends: Cumulative rainfall is tracking +9% ahead of the long-period average (LPA) levels on an aggregate basis (over June 1 - September 30, 2020). Out of the 36 meteorological subdivisions, rainfall has so far been excess / normal in 31 meteorological subdivisions and deficient in 5. North West India (-16% vs LPA) is lagging while Southern Peninsula (+29% vs LPA) and Central India (+15% vs LPA) and Eastern India (+6% vs LPA) have received higher than normal rainfall.
Reform Measures: Government passed key agriculture reforms to deregulate agriculture commodities and liberalize agriculture marketing. The government has now deregulated key commodities (including cereals, edible oils, oilseeds, pulses, onions and potatoes). The Central government has introduced legislation to enable adequate choice for farmers to sell their produce and allow barrier free interstate trade in agriculture commodities. Currently, farmers are bound by a monopsony. The government has also introduced legislation that provides for a farming agreement between farmers and buyers prior to the production or rearing of any farm produce.
As we enter the third quarter of the pandemic, the stock market' behavior splits the market move in two broad camps: "Those who are focused on the move from April'20 to date" who shake their head in disbelief, most who are in this camp are well meaning or erudite or intellectuals (or all the above). Their main grouse being the present day economic havoc that the pandemic is creating, especially visible across poorer and less equal countries / section of societies. Clearly, the acceptance of a "K" shaped recovery, where a minority of white collared workers - who have been able carry on their work from home/anywhere have worked breaking as little sweat as possible, while countering a pandemic at a personal level as against a larger majority dislocated by not being able to earn their daily wage or being employed in sectors under stress - travel, tourism, retail, airlines, the small business owners - whose livelihoods have been most impacted by social distancing and other measures like lockdowns to control the virus. Most in this camp, have been waiting for a correction to invest, as they believe the current swag of the market is unsustainable. Many from this camp have also redeemed part of their equity holdings shaking their head in disbelief on the perceived disbelief between the ground reality and the maker believe.
The second camp, a vocal minority, who see the market move from January'20 to date gives a fuller picture to explain the market's march since April, they believe that market is "compensating" for the brutal March "Madness" - in a period of three weeks, the markets had equalled the fall during the Apr-Oct 2008, or popularly known as GFC - Great Financial Crisis. To support the fall in March'20, the Central Banks came rushing to the rescue within days of the markets touching lows, rather than months as compared to 2008-09 GFC, where markets touched a low in October'08, bounced around till March'09, till US Fed came out with a QE program which created the base for a monetary policy led rally. In addition, fiscal policy of various key Governments was announced within weeks of the pandemic affected by lockdowns: US, Germany, Japan led the loosening of unprecedented levels, with stimulus packages as large as 10% of GDP announced before the end of April'20, an astonishing speed given the parsimonious behavior of the Governments during the 2008-09 GFC. This camp believes the combination of a loose monetary will stroke inflation and equity amongst financial assets is best placed to hedge inflation. No wonder Gold, has been on a tear during this period. Like every movement, the "fringe" elements in this camp, literally led by a Robin Hood (the discount brokerage firm by the same name in the US), individual investors have jumped into stocks of all stripes and hues putting traditional money managers to shame with their returns in a period of few weeks. To those in the First Camp, such excesses steels their resolves even further, making them shake their head in disbelief. Tesla's market cap peaked at USD500 bn + aggregating that of all other car manufacturers!
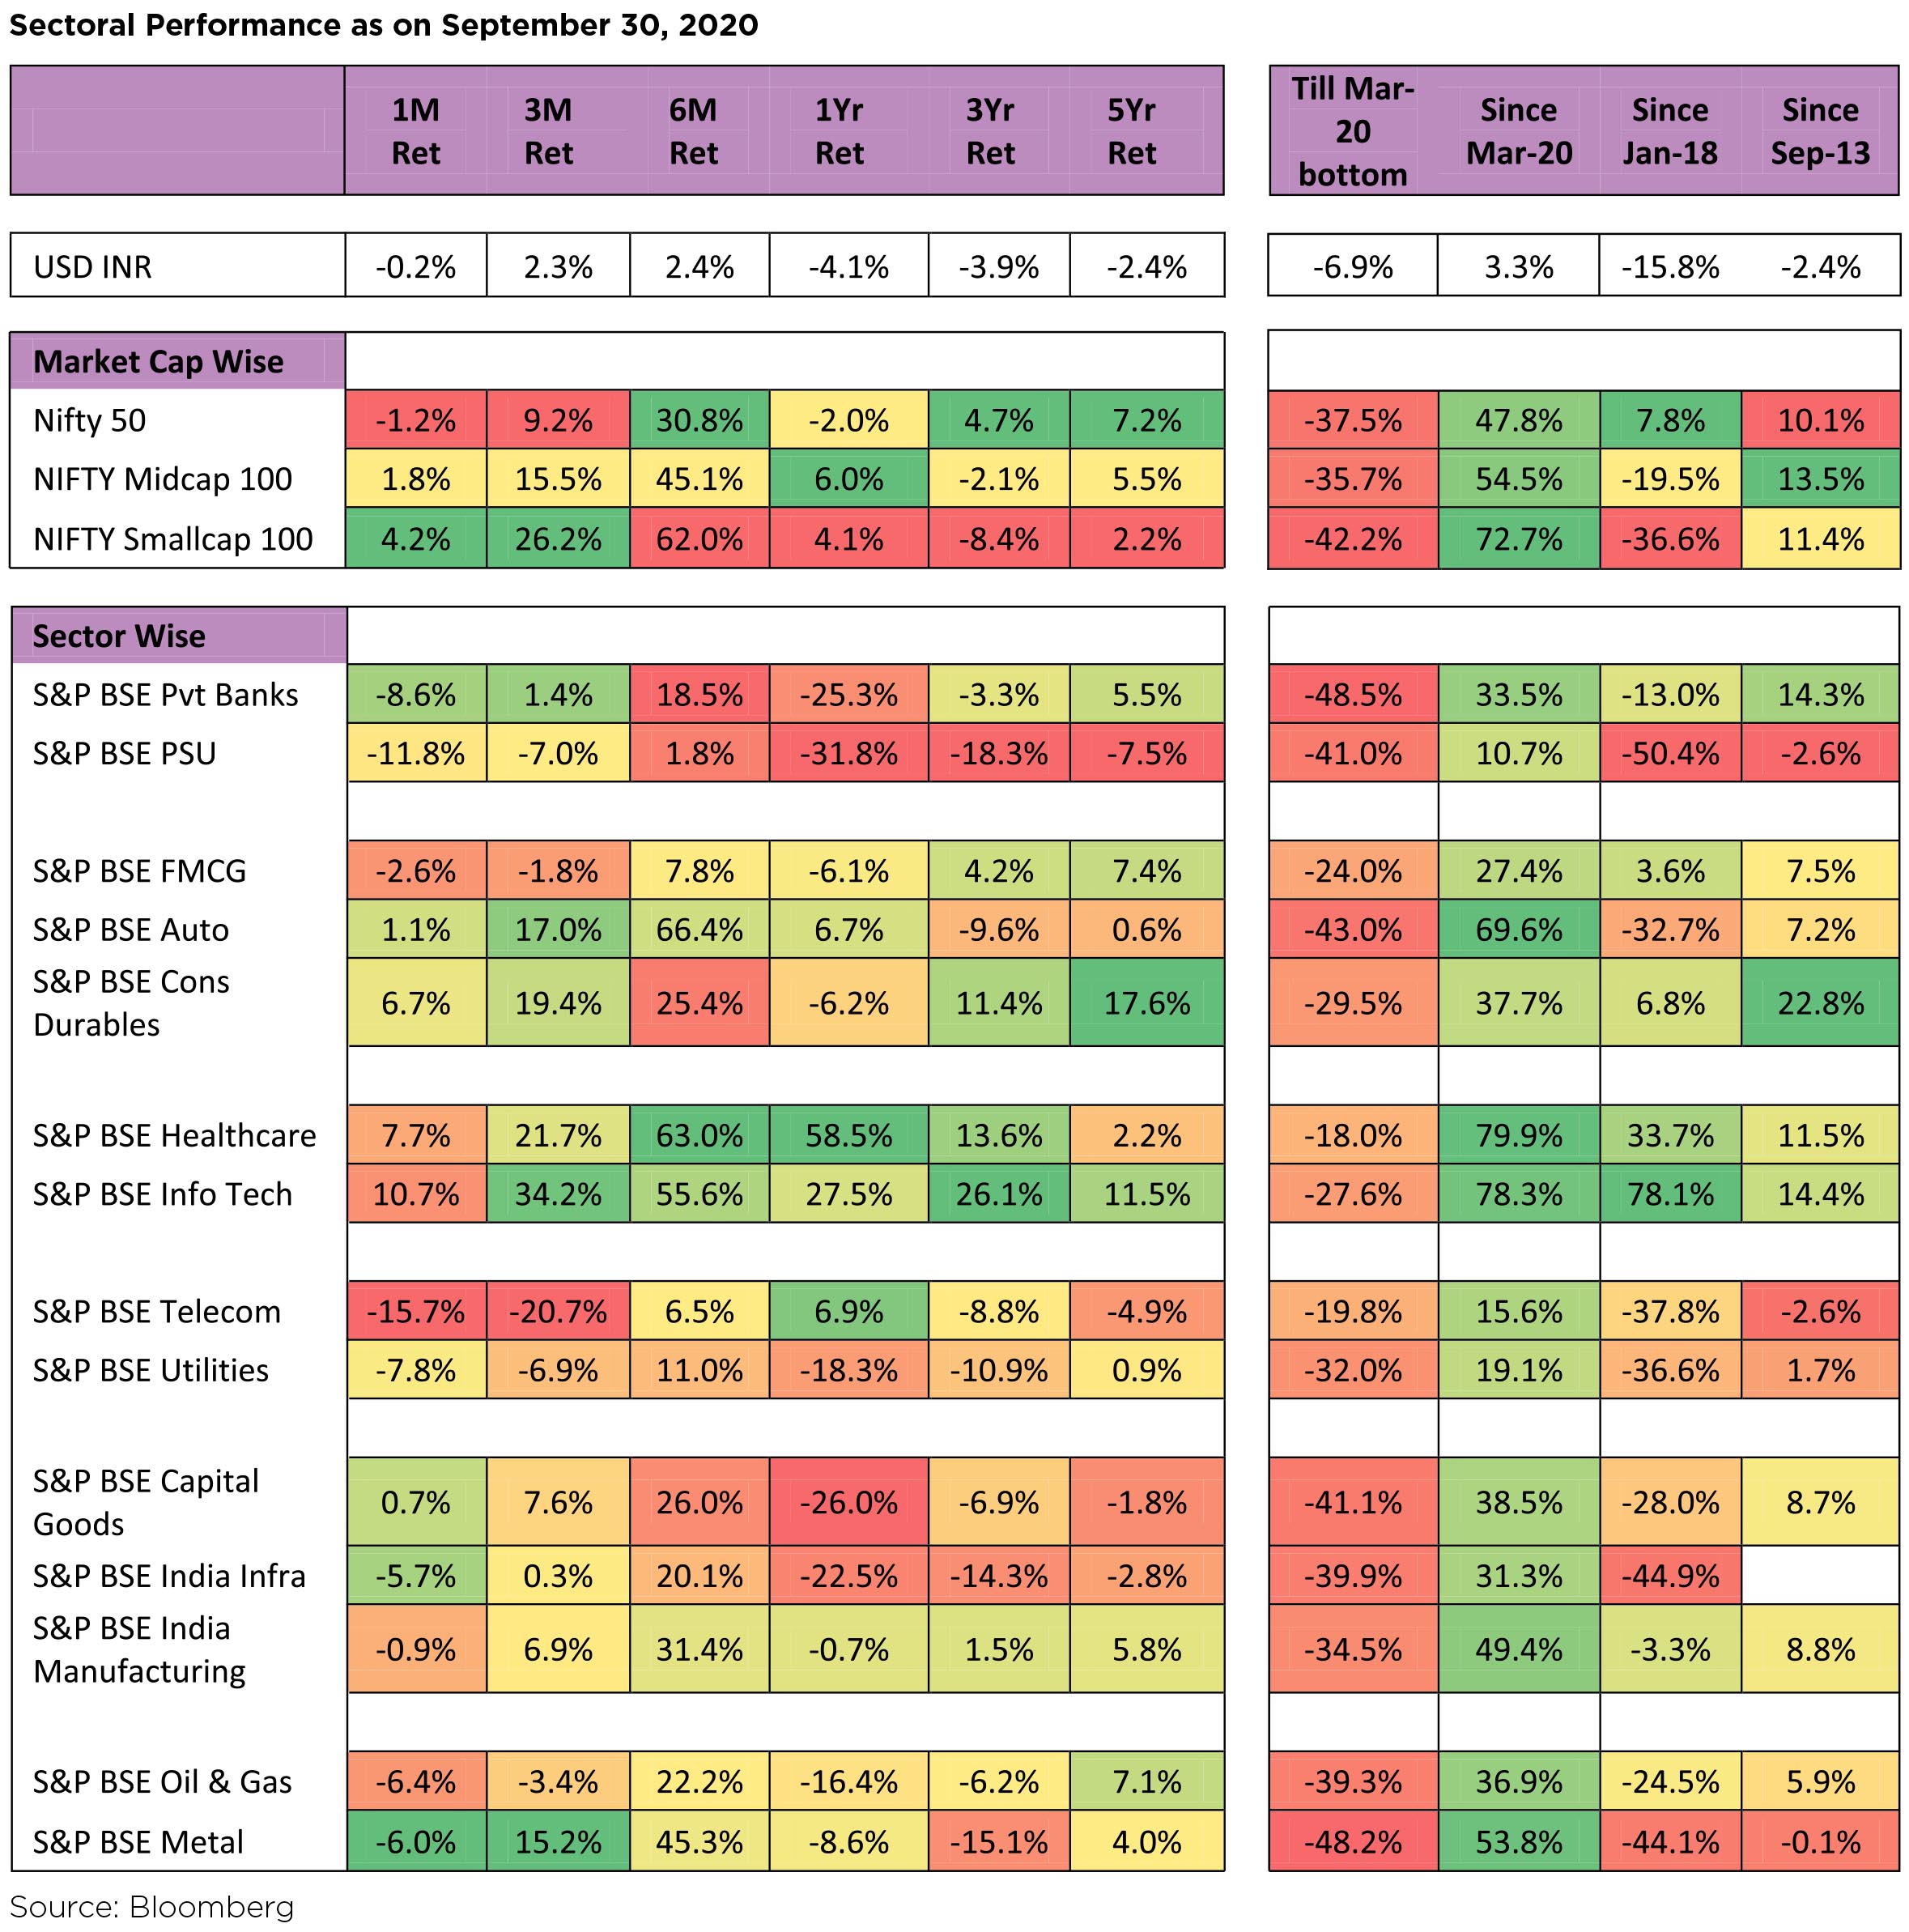
Sectoral Returns even in India point to a K-shaped economic recovery with a significant divergence across sector returns. Sectors which has done well have seen a broad-based outperformance across stocks; whereas sectors which have struggled have seen a broad-based underperformance.
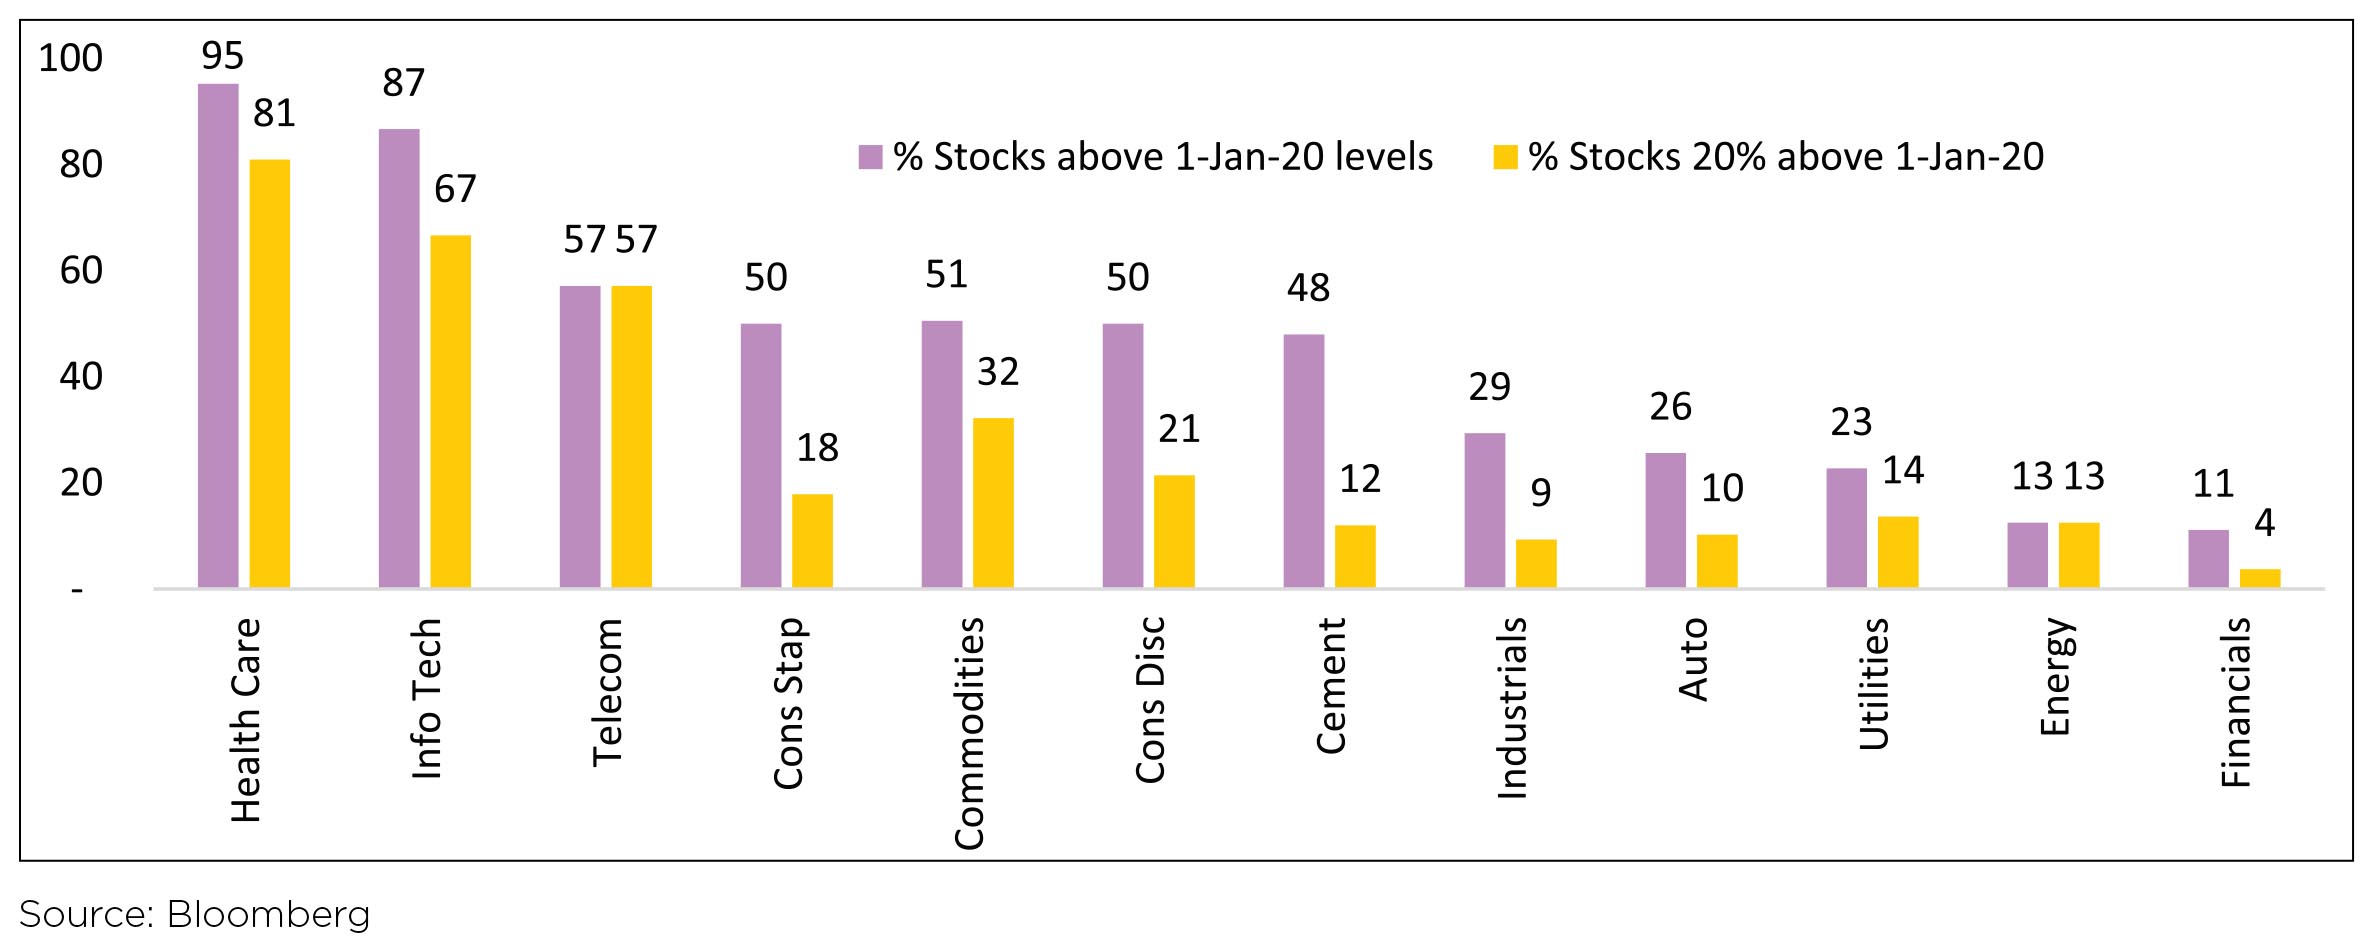
As can be seen in the above chart, for sectors like IT and HealthCare, returns have been broad-based. In HealthCare, 95% of BSE500 stocks are above Jan-20 levels and 81% are more than 20% above. Financials have seen broadbased underperformance. Auto Index is almost back to Jan-20 levels, though only 26% of stocks are above positive for the year. Sectors like Staples, Commodities and Discretionary have been mixed.
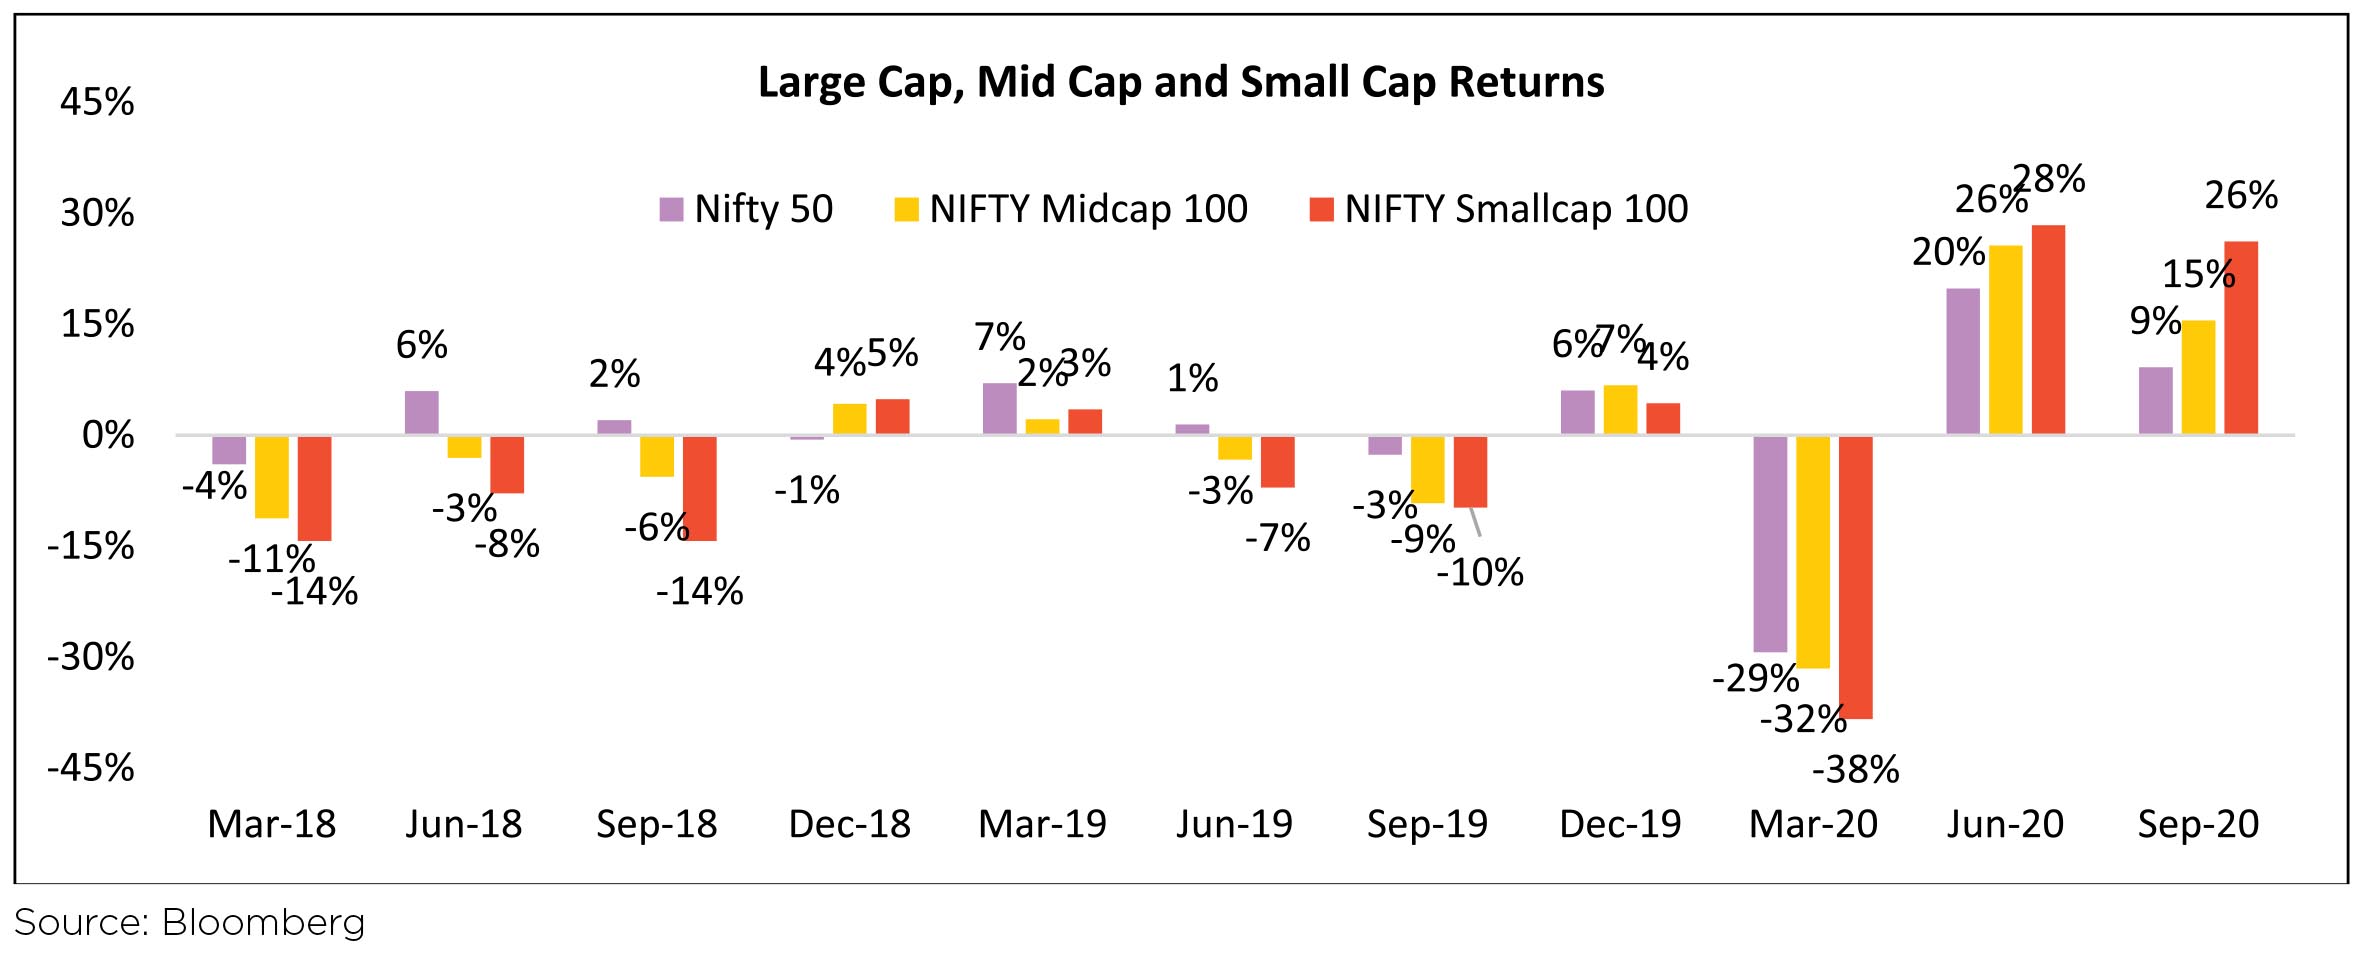
The Indian markets have given one key signal, which even the mighty the US hasn't. The rally from April has been broad based, with Mid and Small Caps participating equally in the upmove. This is indeed a relief, after the bashing Small Cap index has received during CY18 and CY19. This is reflected in the few charts below. Clearly, most Small cap stocks have moved up from their March lows and a significant proportion have crossed the 1-Jan-20 level as such. Hence, undervaluation of small cap segment during March/April is behind us. What will drive Small caps, like rest of the market will be the path of earnings growth and the steepness of this growth curve in FY22. We believe companies which are leaders in their segments and which have low reliance on debt could emerge as beneficiaries of this unfortunate pandemic.
Small Cap Index has outperformed for 2 consecutive quarters, first time since Dec-17.
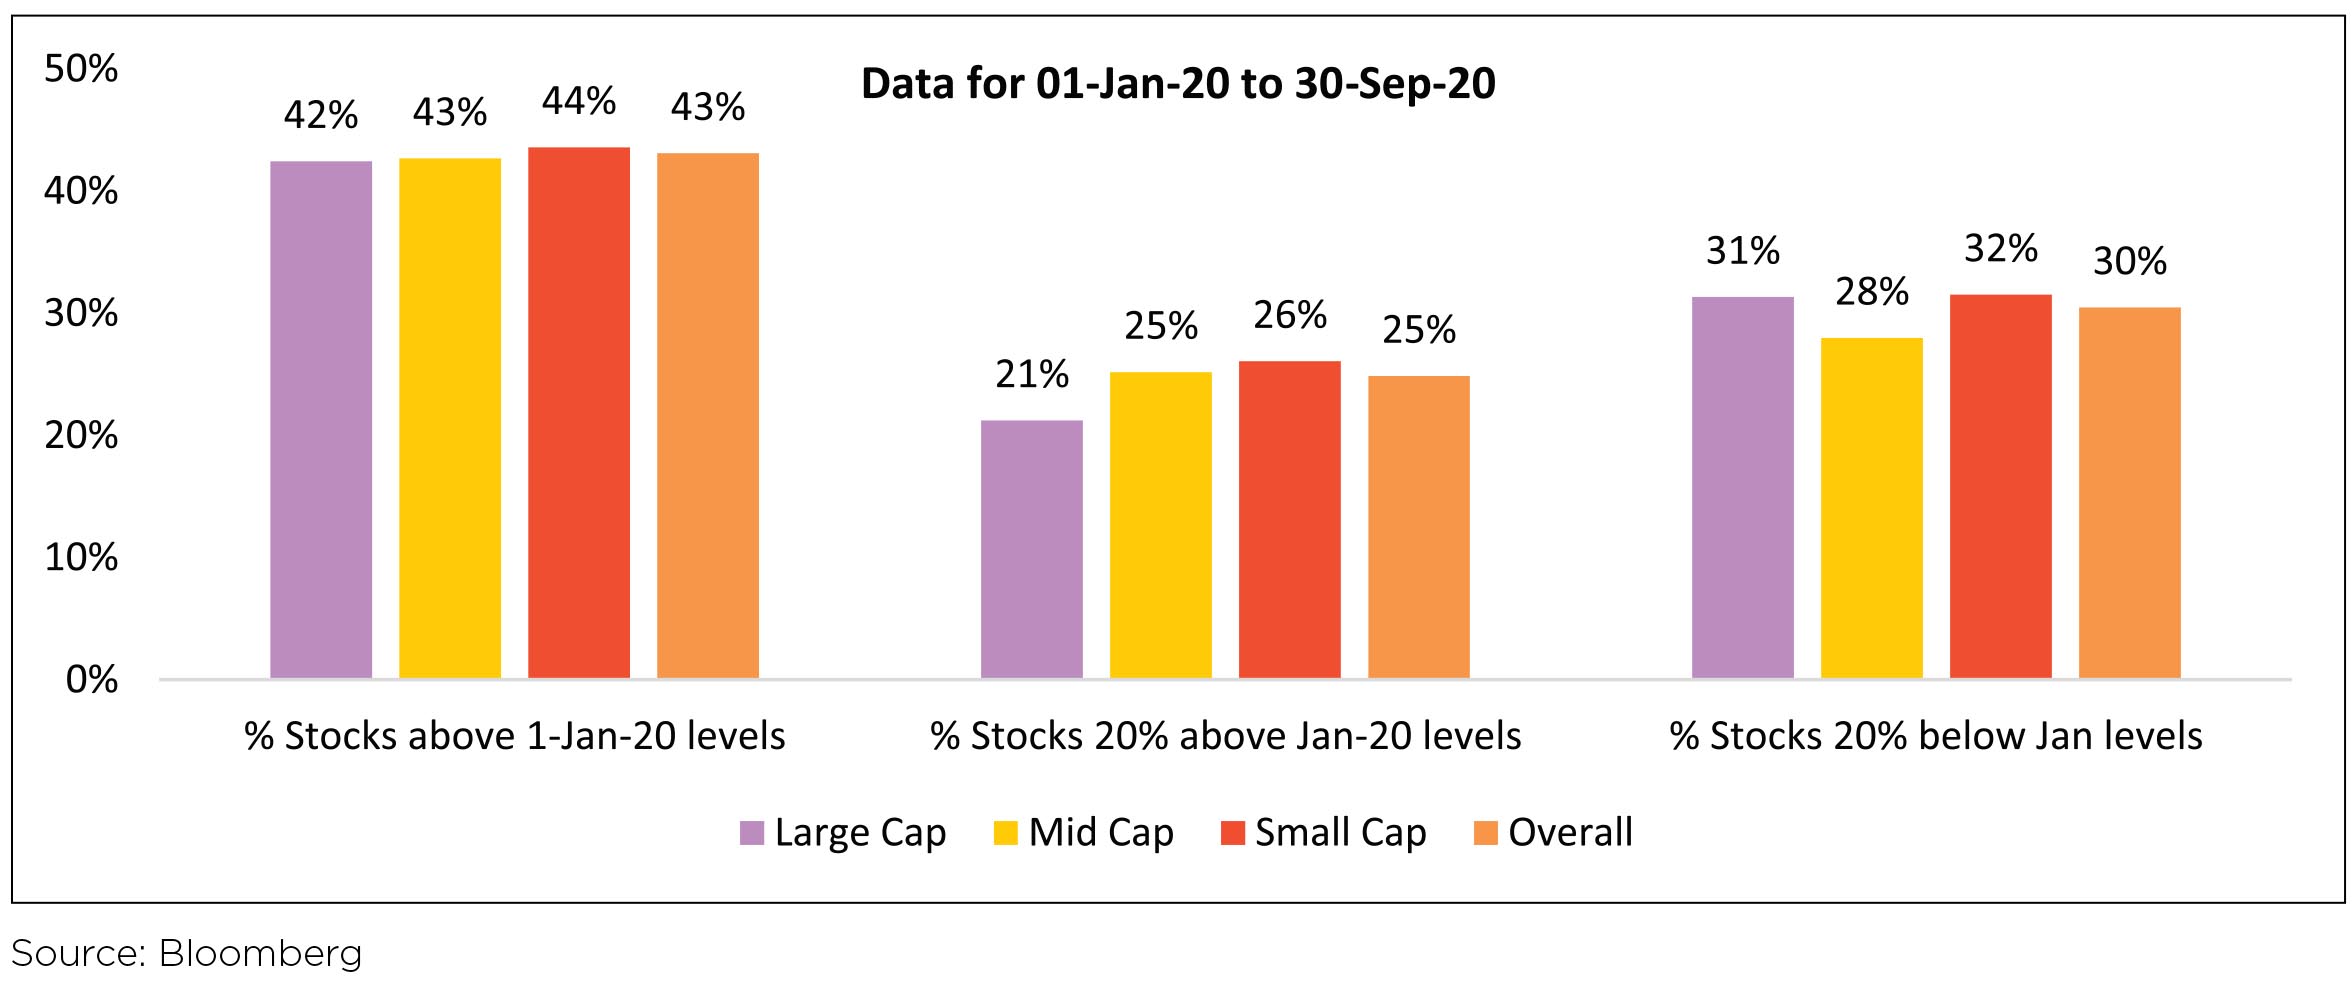
In the above chart, 43% of BSE 500 stocks are above their levels on 01-Jan-20, spread equally across Large, Mid and Small. 25% are 20% above their Jan levels and 30% are 20% below Jan levels, spread almost identically across Large, Mid and Small.
A correction, "healthy" or not is also a feature of any uptrend. The table below shows that all bull markets take a breather, consolidate and then prepare for the next stage. Similarly, the move from April'20 till now has seen a long stretch of the market upmove, with only one correction, which happened quite early in the bull market. Investors should expect such corrections in the current upmove as well.
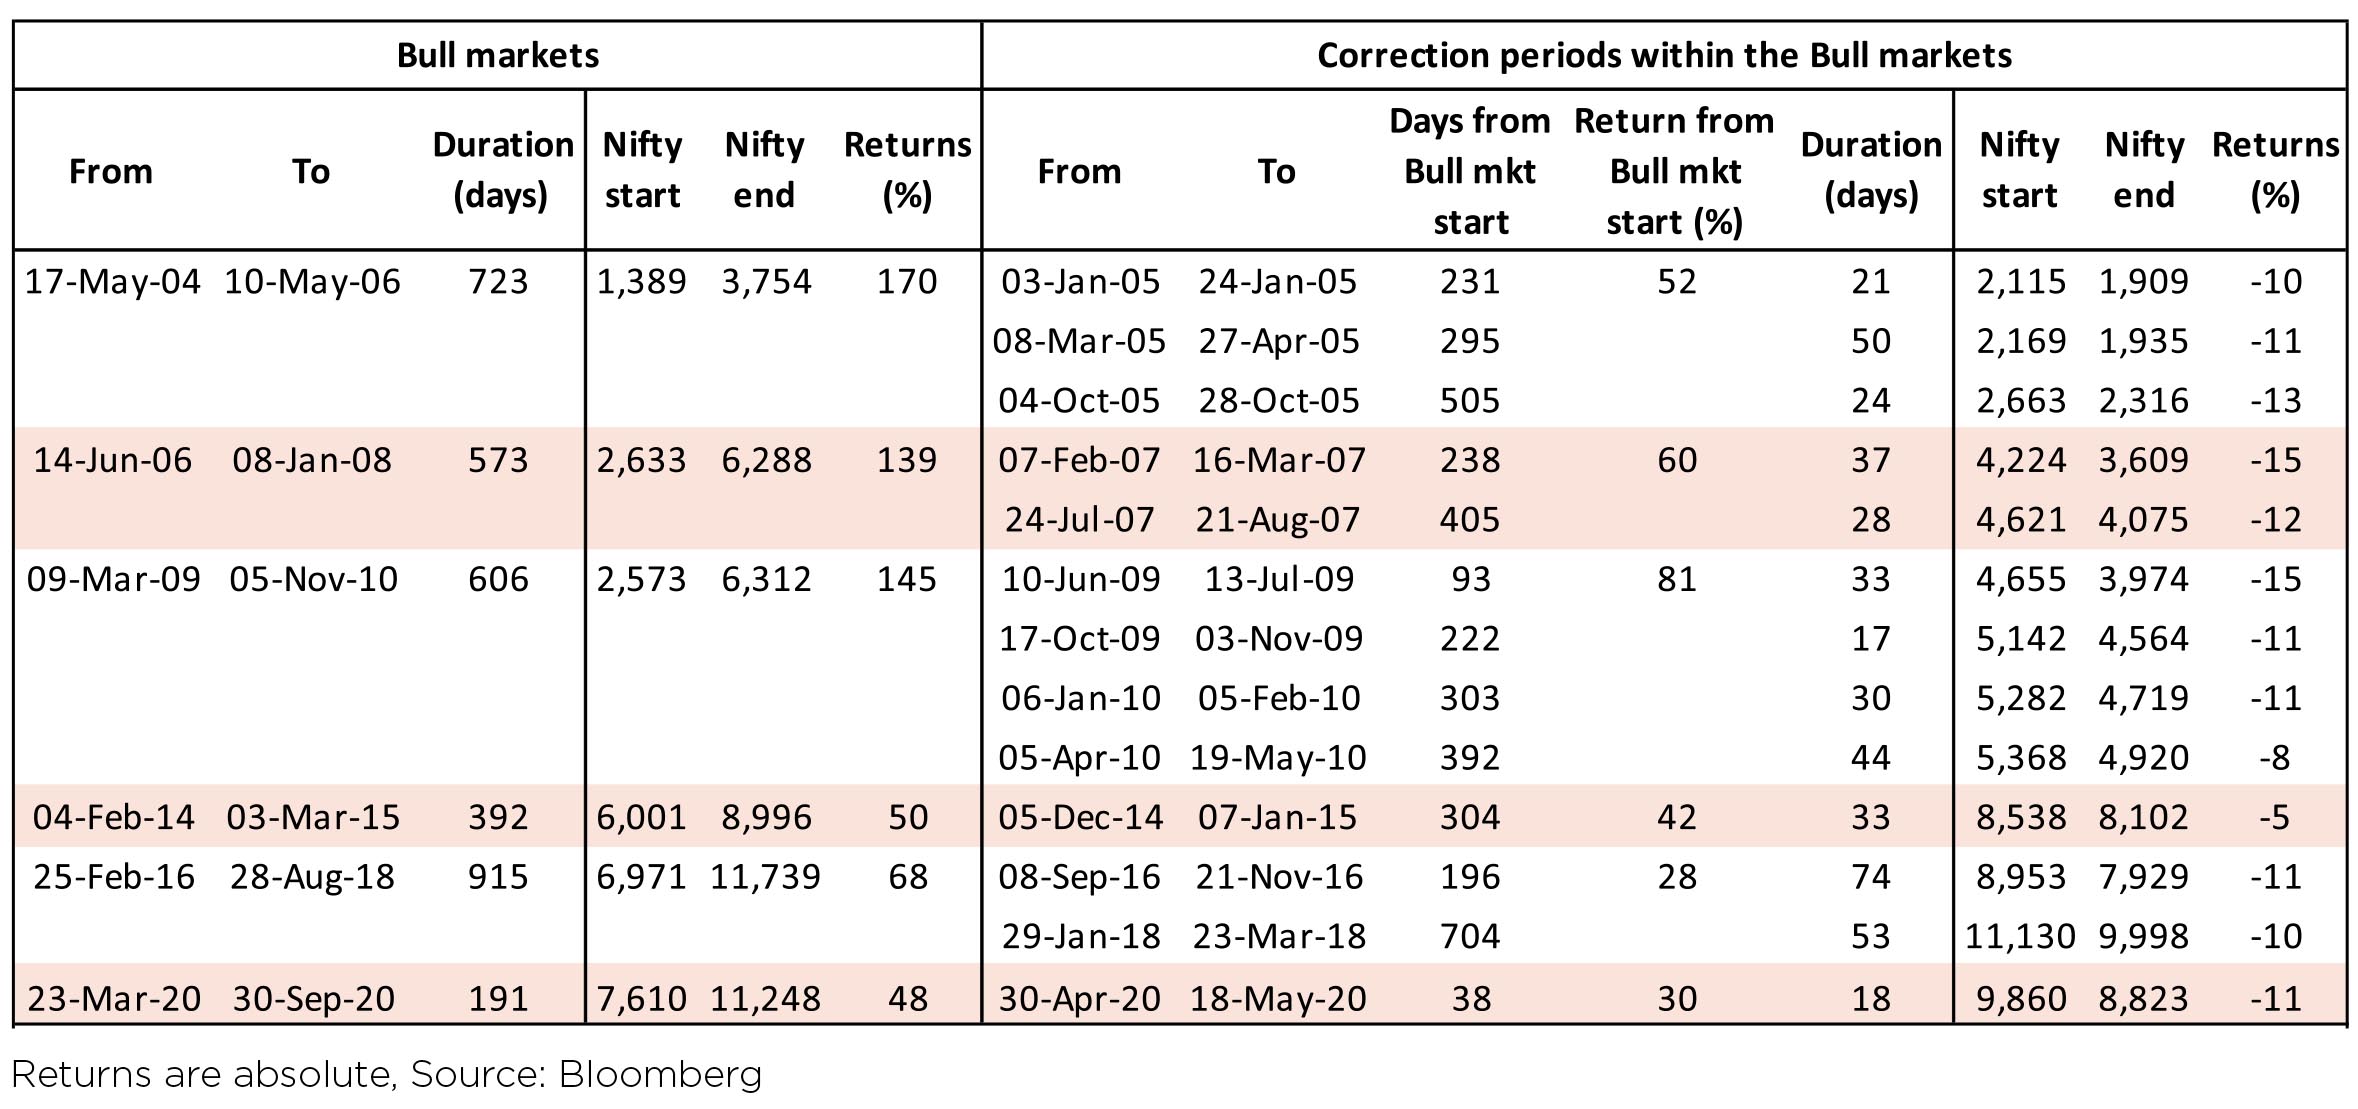
The sooner, it happens, the "healthier", such a correction would be, as it would help unwind excesses, at an earlier stage. Though, to be said, excesses, are an essential element of any bull uptrend (refer Tesla). So be ready for a correction and use it to your advantage. Usually factors for a correction could be something unrelated to the economy and stock markets - Geo political tension, Trade war, currency market gyrations or another emerging country having a big sell off.
Finally, the world over the next couple years will experience the extension of the monetary "experiment" unleashed in March'09 along with a similarly ferocious fiscal stimuli announced by Governments world over. As per "experts" such a scenario could lead to outcomes like higher inflation, Government yields increasing, asset inflation, gold prices shooting up or currency volatility, importantly none of these outcomes would be severely negative for equity as an asset class to be held by investors.
Stay invested, invest at dips and stay Safe.


Source: Bloomberg
IT, Consumer Discretionary (Ecommerce) and Healthcare lead the pack globally. In India, IT & HealthCare lead the pack in line with global markets. In India, Discretionary has been a laggard as India has no meaningful Ecommerce player, except Reliance which gets categorized under 'Energy'. Clear global trend of outperformance of 'Growth' over 'Value' with growth stocks significantly outperforming Value. India is only exception where MSCI Value has outperformed and that too due to 41% weight in 2 stocks - 27% in Reliance and 14% in Infosys.

US Elections: US elections are slated to be held in the first week of November. Currently, the Democratic party candidate holds a significant lead over the incumbent Republican candidate. Despite Democrat candidate Joe Biden announcing reversion in Corporate Tax Rates to 27%, markets are not showing any signs of nervousness. A democratic victory could lead to stricter regulatory regime, which could impact business confidence going forward. Historically, US stock markets have been positive 70%+ times in the 4th year of a presidential cycle. Also, in case of an incumbent victory, markets tend to outperform compared to a regime change.
COVID impact: Globally, daily new cases seem to have plateaued and daily deaths seem to be tapering downwards - both good signs. Though, the differential across countries has been quite high with some countries seeing second waves while the first wave seems to be receding for others. Mass vaccination is at least 6-9 months away, so the scare of large 2nd and 3rd waves especially in the winter remains.

Domestic Markets
Domestic markets have been broad-based with broader markets outperforming the Nifty 50, first time after 2 years.
After the trough seen in the June quarter, earnings estimates for FY22 across sectors have seen upgrades.

Domestic Coronavirus updates: Daily new COVID- 19 cases have averaged ~87k in September vs. ~64k in August. However, the daily case count which increased to 90k+ cases for 11 consecutive days during the month, has now declined to ~83k cases (average of last seven days). Globally, India has the third highest number of deaths at ~99k behind US and Brazil. However, the mortality rate has been trending lower at ~1.6% (vs. 1.9% in August); while recovery rate continues to pick up ~83% (vs. ~75% at end-August). COVID-19 continues to broaden its geographical reach within the country. ICMR's (Indian Council of Medical Research) second sero survey stated that ~7.1% of the adult population is estimated to be exposed to COVID-19. A considerable population is still vulnerable and susceptible to COVID-19. Further, ICMR noted that the risk in urban slums is twice than that in non-slum areas and four times the risk in rural setting.
Unlock 5.0: Both State and Central governments have further eased restrictions in Unlock 5.0 guidelines for October except for containment zones. Under the new guidelines, cinemas, theatres and multiplexes can open with maximum 50% seating capacity. States and UTs (Union Territories) can decide on reopening of schools and other educational institutions, although attendance will not be mandatory.
Capital Flows: After record monthly net inflows in August, FPIs turned net sellers in September with outflows of USD731mn from Indian equities (vs. inflow of USD6.1bn in August). YTD, FPIs remain net buyers at USD4.1bn in Indian equities. FPIs recorded net inflows in the debt markets at USD569mn in September, first month of net inflows after six consecutive months of outflows. YTD, FPIs have sold USD14.5bn in the debt markets. DIIs were marginal net equity buyers of USD15mn in September (vs. outflows of USD1.5bn in August). While Insurance Funds turned net buyers in September, Mutual Funds (MFs) remained net sellers. MFs were net equity sellers at USD636mn; while insurance funds bought USD517mn of equities in September.
Sectoral Impact
On a sectoral front, Pharma and IT have been the key beneficiaries whereas Financials have been the major laggards.
The Macro Picture
Industrial Activity: After plateauing in July, the Composite PMI gained 8.8pt MoM to print at 46.0 in August. India's
services PMI improved to 41.8 in August (+7.6pt MoM) while the Manufacturing PMI printed at 52.0 in August (+6.0pt
MoM). Within the forward-looking demand indicators recovery was seen in Composite PMI new orders which came
at 45.4 (+7.6pt) and Composite PMI new export orders at 40.2 (+4.6pt). Our economists note that PMIs typically
lag sharp recoveries as managers tend to compare current activity with that of the "past few months" rather than
the "previous month".Monsoon trends: Cumulative rainfall is tracking +9% ahead of the long-period average (LPA) levels on an aggregate basis (over June 1 - September 30, 2020). Out of the 36 meteorological subdivisions, rainfall has so far been excess / normal in 31 meteorological subdivisions and deficient in 5. North West India (-16% vs LPA) is lagging while Southern Peninsula (+29% vs LPA) and Central India (+15% vs LPA) and Eastern India (+6% vs LPA) have received higher than normal rainfall.
Reform Measures: Government passed key agriculture reforms to deregulate agriculture commodities and liberalize agriculture marketing. The government has now deregulated key commodities (including cereals, edible oils, oilseeds, pulses, onions and potatoes). The Central government has introduced legislation to enable adequate choice for farmers to sell their produce and allow barrier free interstate trade in agriculture commodities. Currently, farmers are bound by a monopsony. The government has also introduced legislation that provides for a farming agreement between farmers and buyers prior to the production or rearing of any farm produce.
Outlook
Will a Combination of Monetary and Fiscal "juice" outrun the cold logic of slow rebuilding economies impacted
by the pandemic?As we enter the third quarter of the pandemic, the stock market' behavior splits the market move in two broad camps: "Those who are focused on the move from April'20 to date" who shake their head in disbelief, most who are in this camp are well meaning or erudite or intellectuals (or all the above). Their main grouse being the present day economic havoc that the pandemic is creating, especially visible across poorer and less equal countries / section of societies. Clearly, the acceptance of a "K" shaped recovery, where a minority of white collared workers - who have been able carry on their work from home/anywhere have worked breaking as little sweat as possible, while countering a pandemic at a personal level as against a larger majority dislocated by not being able to earn their daily wage or being employed in sectors under stress - travel, tourism, retail, airlines, the small business owners - whose livelihoods have been most impacted by social distancing and other measures like lockdowns to control the virus. Most in this camp, have been waiting for a correction to invest, as they believe the current swag of the market is unsustainable. Many from this camp have also redeemed part of their equity holdings shaking their head in disbelief on the perceived disbelief between the ground reality and the maker believe.
The second camp, a vocal minority, who see the market move from January'20 to date gives a fuller picture to explain the market's march since April, they believe that market is "compensating" for the brutal March "Madness" - in a period of three weeks, the markets had equalled the fall during the Apr-Oct 2008, or popularly known as GFC - Great Financial Crisis. To support the fall in March'20, the Central Banks came rushing to the rescue within days of the markets touching lows, rather than months as compared to 2008-09 GFC, where markets touched a low in October'08, bounced around till March'09, till US Fed came out with a QE program which created the base for a monetary policy led rally. In addition, fiscal policy of various key Governments was announced within weeks of the pandemic affected by lockdowns: US, Germany, Japan led the loosening of unprecedented levels, with stimulus packages as large as 10% of GDP announced before the end of April'20, an astonishing speed given the parsimonious behavior of the Governments during the 2008-09 GFC. This camp believes the combination of a loose monetary will stroke inflation and equity amongst financial assets is best placed to hedge inflation. No wonder Gold, has been on a tear during this period. Like every movement, the "fringe" elements in this camp, literally led by a Robin Hood (the discount brokerage firm by the same name in the US), individual investors have jumped into stocks of all stripes and hues putting traditional money managers to shame with their returns in a period of few weeks. To those in the First Camp, such excesses steels their resolves even further, making them shake their head in disbelief. Tesla's market cap peaked at USD500 bn + aggregating that of all other car manufacturers!
Sectoral Returns even in India point to a K-shaped economic recovery with a significant divergence across sector returns. Sectors which has done well have seen a broad-based outperformance across stocks; whereas sectors which have struggled have seen a broad-based underperformance.

As can be seen in the above chart, for sectors like IT and HealthCare, returns have been broad-based. In HealthCare, 95% of BSE500 stocks are above Jan-20 levels and 81% are more than 20% above. Financials have seen broadbased underperformance. Auto Index is almost back to Jan-20 levels, though only 26% of stocks are above positive for the year. Sectors like Staples, Commodities and Discretionary have been mixed.
The Indian markets have given one key signal, which even the mighty the US hasn't. The rally from April has been broad based, with Mid and Small Caps participating equally in the upmove. This is indeed a relief, after the bashing Small Cap index has received during CY18 and CY19. This is reflected in the few charts below. Clearly, most Small cap stocks have moved up from their March lows and a significant proportion have crossed the 1-Jan-20 level as such. Hence, undervaluation of small cap segment during March/April is behind us. What will drive Small caps, like rest of the market will be the path of earnings growth and the steepness of this growth curve in FY22. We believe companies which are leaders in their segments and which have low reliance on debt could emerge as beneficiaries of this unfortunate pandemic.
Small Cap Index has outperformed for 2 consecutive quarters, first time since Dec-17.


In the above chart, 43% of BSE 500 stocks are above their levels on 01-Jan-20, spread equally across Large, Mid and Small. 25% are 20% above their Jan levels and 30% are 20% below Jan levels, spread almost identically across Large, Mid and Small.
A correction, "healthy" or not is also a feature of any uptrend. The table below shows that all bull markets take a breather, consolidate and then prepare for the next stage. Similarly, the move from April'20 till now has seen a long stretch of the market upmove, with only one correction, which happened quite early in the bull market. Investors should expect such corrections in the current upmove as well.

The sooner, it happens, the "healthier", such a correction would be, as it would help unwind excesses, at an earlier stage. Though, to be said, excesses, are an essential element of any bull uptrend (refer Tesla). So be ready for a correction and use it to your advantage. Usually factors for a correction could be something unrelated to the economy and stock markets - Geo political tension, Trade war, currency market gyrations or another emerging country having a big sell off.
Finally, the world over the next couple years will experience the extension of the monetary "experiment" unleashed in March'09 along with a similarly ferocious fiscal stimuli announced by Governments world over. As per "experts" such a scenario could lead to outcomes like higher inflation, Government yields increasing, asset inflation, gold prices shooting up or currency volatility, importantly none of these outcomes would be severely negative for equity as an asset class to be held by investors.
Stay invested, invest at dips and stay Safe.
WHAT WENT BY
Bonds remained range-bound although with a slightly bearish bias due to the consecutive
devolvement of the benchmark paper in the weekly auctions. The 10-year benchmark yield which
touched an intra-month of 6.06% ended the month at 6.01% on secondary market buying by RBI.
The short end segment slightly underperformed with the 10 year to 5-year Government bond
spread narrowing by 13bps to end the month at 61bps.
CPI inflation came in flat at 6.7% YoY in Aug'20, below the market consensus of 6.9% while Jul'20 CPI was revised down to 6.7% from 6.9% earlier. CPI has remained above the Reserve Bank of India (RBI)'s headline inflation target range of 2-6% since Apr'20. Sub-components such as 'Fruits', 'Vegetables', and 'Oils and Fats' still exhibited higher inflation during the month v/s Jul'20.
WPI inflation for August 2020 printed higher than market expectations at 0.16% as compared to -0.58% in July 2020, mainly on account of the price uptick in primary articles and manufactured products. Primary articles inflation stood at 1.60% for August 2020 considerably higher than the previous month's print of 0.63%. Manufactured products index recorded a sharp uptick and printed at 1.27% in August 2020, as compared to 0.51% in July 2020. WPI Core (Non-Food Manufactured Products) inflation moved to a positive territory after 13 months and printed at 0.63% in August 2020 as against -0.31% recorded in July 2020.
Industrial production improved in July, to -10.4% yoy from -15.8% yoy in June. Most sub-indices rose on a m-o-m basis, although at a lower pace than May and June. Manufacturing sector contraction eased to 11.1% in Jul-20 from a contraction of 16.0% in Jun-20. Despite recovery in mining related activities, coal, natural gas and crude oil production remains subdued due to labor migration, closure of wells, and operational issues with restrictions levied on production activities amid regional lockdowns. Consumption goods production deteriorated to -6.3% YoY in Jul-20 from -6.0%YoY in Jun-20.
S&P affirmed India's sovereign long-term rating at "BBB-" with Stable Outlook, reflecting aboveaverage long-term economic growth, sound external profile, and evolving monetary settings. S&P expects India's GDP to contract 9% in FY21 before bouncing back to grow at ~10% in FY22. The rating agency forecast a spike in India's debt levels to 90.6% of its GDP in FY21 from 73.4% a year before.
The outcome of the September FOMC was in line with expectations - forecasts were substantially upgraded, but median "dots" continue to imply policy rates remaining at 0-25bp through 2023. Fed officials upgraded their forecasts with a 2.8% upward revision to 2020 real GDP growth from -6.5% to -3.7% and a downward revision to 7.6% unemployment. With median Fed projections of inflation at or below 2.0% through 2023, imply that the Fed does not expect the "overshoot" to occur until 2024 or beyond and consequently rates could stay on-hold until closer to that point.
FY21 central government borrowing was left unchanged at Rs. 12 trillion in line with market expectations leading to gross borrowing for H2 at INR 4.34 tn. This translates to gross average weekly issuance of between INR 270 bn - INR 280 bn (until end of January 2021) while state government borrowing announced for Q3 is lower than market expectations. State borrowing calendar for Q3 is pegged at INR 2.02 tn as against Rs. 2.5-Rs. 3 trillion expected by some market participants.
Disclaimer: MUTUAL FUND INVESTMENTS ARE SUBJECT TO MARKET RISKS, READ ALL SCHEME RELATED DOCUMENTS CAREFULLY.
The Disclosures of opinions/in house views/strategy incorporated herein is provided solely to enhance the transparency about the investment strategy / theme of the Scheme and should not be treated as endorsement of the views / opinions or as an investment advice. This document should not be construed as a research report or a recommendation to buy or sell any security. This document has been prepared on the basis of information, which is already available in publicly accessible media or developed through analysis of IDFC Mutual Fund. The information/ views / opinions provided is for informative purpose only and may have ceased to be current by the time it may reach the recipient, which should be taken into account before interpreting this document. The recipient should note and understand that the information provided above may not contain all the material aspects relevant for making an investment decision and the security may or may not continue to form part of the scheme's portfolio in future. Investors are advised to consult their own investment advisor before making any investment decision in light of their risk appetite, investment goals and horizon. The decision of the Investment Manager may not always be profitable; as such decisions are based on the prevailing market conditions and the understanding of the Investment Manager. Actual market movements may vary from the anticipated trends. This information is subject to change without any prior notice. The Company reserves the right to make modifications and alterations to this statement as may be required from time to time. Neither IDFC Mutual Fund / IDFC AMC Trustee Co. Ltd./ IDFC Asset Management Co. Ltd nor IDFC, its Directors or representatives shall be liable for any damages whether direct or indirect, incidental, punitive special or consequential including lost revenue or lost profits that may arise from or in connection with the use of the information.
CPI inflation came in flat at 6.7% YoY in Aug'20, below the market consensus of 6.9% while Jul'20 CPI was revised down to 6.7% from 6.9% earlier. CPI has remained above the Reserve Bank of India (RBI)'s headline inflation target range of 2-6% since Apr'20. Sub-components such as 'Fruits', 'Vegetables', and 'Oils and Fats' still exhibited higher inflation during the month v/s Jul'20.
WPI inflation for August 2020 printed higher than market expectations at 0.16% as compared to -0.58% in July 2020, mainly on account of the price uptick in primary articles and manufactured products. Primary articles inflation stood at 1.60% for August 2020 considerably higher than the previous month's print of 0.63%. Manufactured products index recorded a sharp uptick and printed at 1.27% in August 2020, as compared to 0.51% in July 2020. WPI Core (Non-Food Manufactured Products) inflation moved to a positive territory after 13 months and printed at 0.63% in August 2020 as against -0.31% recorded in July 2020.
Industrial production improved in July, to -10.4% yoy from -15.8% yoy in June. Most sub-indices rose on a m-o-m basis, although at a lower pace than May and June. Manufacturing sector contraction eased to 11.1% in Jul-20 from a contraction of 16.0% in Jun-20. Despite recovery in mining related activities, coal, natural gas and crude oil production remains subdued due to labor migration, closure of wells, and operational issues with restrictions levied on production activities amid regional lockdowns. Consumption goods production deteriorated to -6.3% YoY in Jul-20 from -6.0%YoY in Jun-20.
S&P affirmed India's sovereign long-term rating at "BBB-" with Stable Outlook, reflecting aboveaverage long-term economic growth, sound external profile, and evolving monetary settings. S&P expects India's GDP to contract 9% in FY21 before bouncing back to grow at ~10% in FY22. The rating agency forecast a spike in India's debt levels to 90.6% of its GDP in FY21 from 73.4% a year before.
The outcome of the September FOMC was in line with expectations - forecasts were substantially upgraded, but median "dots" continue to imply policy rates remaining at 0-25bp through 2023. Fed officials upgraded their forecasts with a 2.8% upward revision to 2020 real GDP growth from -6.5% to -3.7% and a downward revision to 7.6% unemployment. With median Fed projections of inflation at or below 2.0% through 2023, imply that the Fed does not expect the "overshoot" to occur until 2024 or beyond and consequently rates could stay on-hold until closer to that point.
FY21 central government borrowing was left unchanged at Rs. 12 trillion in line with market expectations leading to gross borrowing for H2 at INR 4.34 tn. This translates to gross average weekly issuance of between INR 270 bn - INR 280 bn (until end of January 2021) while state government borrowing announced for Q3 is lower than market expectations. State borrowing calendar for Q3 is pegged at INR 2.02 tn as against Rs. 2.5-Rs. 3 trillion expected by some market participants.
Outlook
From a bond market perspective, the RBI is expected to make good on its stated commitment
to ensure smooth execution of the borrowing program. Nevertheless, it could be difficult to
actively play this as it is inconceivable to assess the lag entailed in RBI's reaction once disruption
becomes evident, and the strength of the reaction RBI could display when it acts. However, the
extra-ordinary steepness in the bond curve throws up all sorts of interesting portfolio constructs.
There are points on the curve (for instance in the 6 - 9-year segment on government bonds)
where the carry versus duration trade-off looks very attractive. This is because most of the
steepness in the curve is between the overnight rate and this segment which provides significant
protection for this segment of bonds and can help withstand some rise in yields over a period
of time and still return close to money market rates. As always, the construct can change basis
evolving views. The external account is our one significant macro strength and provides adequate
cushion to RBI to persist with a dovish policy for the time-being. For all these reasons, our view
remains that the important current pillars of policy will sustain for the foreseeable future. The
spike in inflation presents an interpretation problem for now and it remains our base case that
it will not shift the narrative away from growth for monetary policy, despite throwing up higher
average CPI prints for the year.
Disclaimer: MUTUAL FUND INVESTMENTS ARE SUBJECT TO MARKET RISKS, READ ALL SCHEME RELATED DOCUMENTS CAREFULLY.
The Disclosures of opinions/in house views/strategy incorporated herein is provided solely to enhance the transparency about the investment strategy / theme of the Scheme and should not be treated as endorsement of the views / opinions or as an investment advice. This document should not be construed as a research report or a recommendation to buy or sell any security. This document has been prepared on the basis of information, which is already available in publicly accessible media or developed through analysis of IDFC Mutual Fund. The information/ views / opinions provided is for informative purpose only and may have ceased to be current by the time it may reach the recipient, which should be taken into account before interpreting this document. The recipient should note and understand that the information provided above may not contain all the material aspects relevant for making an investment decision and the security may or may not continue to form part of the scheme's portfolio in future. Investors are advised to consult their own investment advisor before making any investment decision in light of their risk appetite, investment goals and horizon. The decision of the Investment Manager may not always be profitable; as such decisions are based on the prevailing market conditions and the understanding of the Investment Manager. Actual market movements may vary from the anticipated trends. This information is subject to change without any prior notice. The Company reserves the right to make modifications and alterations to this statement as may be required from time to time. Neither IDFC Mutual Fund / IDFC AMC Trustee Co. Ltd./ IDFC Asset Management Co. Ltd nor IDFC, its Directors or representatives shall be liable for any damages whether direct or indirect, incidental, punitive special or consequential including lost revenue or lost profits that may arise from or in connection with the use of the information.


