IDFC Emerging Businesses Fund
(Small Cap Fund - An open ended equity scheme predominantly investing in small cap stocks)

IDFC Emerging Businesses Fund
(Small Cap Fund - An open ended equity scheme predominantly investing in small cap stocks)
|
|
|
|
|

|


About the Fund: Fund focuses on building a diversified portfolio within the small cap segment.
• Portfolio will contain buy and hold strategies as well as opportunistic picks in the cyclical space.
• Fund may also look to participate in new businesses via IPOs.
Category: Small Cap Fund
 : ₹ 944.63 Crores
AUM or assets under management refers to the recent / updated cumulative market value of investments managed by a mutual fund or any investment firm.
: ₹ 951.03 Crores
AUM or assets under management refers to the recent / updated cumulative market value of investments managed by a mutual fund or any investment firm.
:
An employee of the asset management company such as a mutual fund or life insurer, who manages investments of the scheme. He is usually part of a larger team of fund managers and research analysts.
| Portfolio Turnover | |
| Equity | 0.49 |
| Aggregate^ | 0.49 |
| Total Expense Ratio | |
| Regular | 2.42% |
| Direct | 0.29% |
SIP (Minimum Amount): ₹ 100/- and in multiples of Rs.1 thereafter
SIP Frequency: Monthly
SIP Dates (Monthly): Investor may choose any day of the month except 29th, 30th and 31st as the date of instalment.
Investment Objective: Click here
Minimum Investment Amount : ₹ 5,000/- and any amount thereafter
Option Available: The Scheme offer IDCW@ Option & Growth Option. IDCW@ Option under each Plan further offers of choice of Payout & Sweep facilities.
:
Exit load is charged at the time an investor redeems the units of a mutual fund. The exit load is deducted from the prevailing NAV at the time of redemption. For instance, if the NAV is ₹ 100 and the exit load is 1%, the redemption price would be ₹ 99 per unit.
NAV (₹) as on March 31, 2021
| Regular Plan | Growth | 16.16 |
| Regular Plan | IDCW@ | 16.16 |
| Name | % of NAV |
| Equity and Equity related Instruments | 97.07% |
| Consumer Non Durables | 13.01% |
| oRadico Khaitan | 4.22% |
| Balrampur Chini Mills | 2.15% |
| DCM Shriram | 1.53% |
| DFM Foods | 1.50% |
| Emami | 1.07% |
| Heritage Foods | 1.02% |
| Godfrey Phillips India | 1.00% |
| Jyothy Labs | 0.51% |
| Industrial Products | 10.82% |
| oShaily Engineering Plastics | 2.96% |
| Graphite India | 2.14% |
| Polycab India | 1.72% |
| EPL | 1.60% |
| Carborundum Universal | 1.24% |
| Huhtamaki India | 1.15% |
| Software | 9.11% |
| oBirlasoft | 3.00% |
| Cyient | 2.24% |
| eClerx Services | 1.45% |
| Tech Mahindra | 0.86% |
| Infosys | 0.78% |
| Mastek | 0.77% |
| Consumer Durables | 8.49% |
| oKajaria Ceramics | 3.13% |
| Blue Star | 1.69% |
| Mayur Uniquoters | 1.39% |
| Cera Sanitaryware | 1.10% |
| Greenply Industries | 0.58% |
| Orient Electric | 0.39% |
| Borosil | 0.19% |
| Chemicals | 7.66% |
| oNavin Fluorine International | 3.40% |
| oNOCIL | 3.32% |
| Chemcon Speciality Chemicals | 0.94% |
| Leisure Services | 4.79% |
| oWestlife Development | 2.46% |
| Jubilant Foodworks | 1.13% |
| Burger King India | 0.81% |
| EIH | 0.39% |
| Auto Ancillaries | 4.66% |
| Jamna Auto Industries | 1.63% |
| GNA Axles | 1.13% |
| Automotive Axles | 0.99% |
| Wheels India | 0.91% |
| Name | % of NAV |
| Pharmaceuticals | 4.27% |
| FDC | 1.72% |
| Gland Pharma | 1.45% |
| Laurus Labs | 1.09% |
| Capital Markets | 3.85% |
| oMulti Commodity Exchange of India | 2.62% |
| UTI Asset Management Company | 1.23% |
| Banks | 3.69% |
| State Bank of India | 1.53% |
| Kotak Mahindra Bank | 1.16% |
| Suryoday Small Finance Bank | 1.00% |
| Cement & Cement Products | 3.56% |
| Sagar Cements | 1.55% |
| ACC | 1.11% |
| Deccan Cements | 0.89% |
| Petroleum Products | 3.26% |
| oGulf Oil Lubricants India | 2.74% |
| Hindustan Petroleum Corporation | 0.52% |
| Auto | 3.08% |
| Ashok Leyland | 1.65% |
| Tata Motors | 1.43% |
| Pesticides | 3.06% |
| Rallis India | 1.86% |
| Heranba Industries | 1.20% |
| Commercial Services | 2.87% |
| oTeamLease Services | 2.87% |
| Power | 2.00% |
| Kalpataru Power Transmission | 2.00% |
| Healthcare Services | 1.79% |
| Narayana Hrudayalaya | 1.79% |
| Retailing | 1.73% |
| V-Mart Retail | 1.73% |
| Textiles - Cotton | 1.67% |
| Vardhman Textiles | 1.09% |
| Nitin Spinners | 0.58% |
| Telecom - Services | 1.39% |
| Bharti Airtel | 1.39% |
| Finance | 1.24% |
| JM Financial | 0.84% |
| Magma Fincorp | 0.41% |
| Construction Project | 1.07% |
| Power Mech Projects | 1.07% |
| Net Cash and Cash Equivalent | 2.93% |
| Grand Total | 100.00% |
| oTop 10 Equity Holdings |
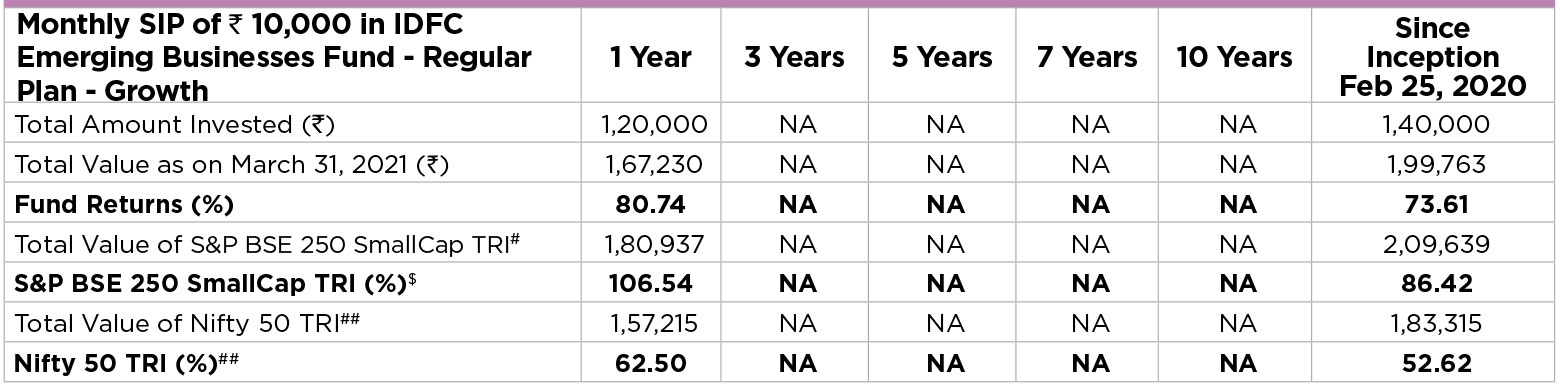
Past performance may or may not be sustained in future. IDCW@ are assumed to be reinvested and bonus is adjusted. Load is not taken into consideration. To illustrate the advantages of SIP investment, this is how your investment would have grown if you had invested say ₹10,000 systematically on the first business Day of every month over a period of time. Returns are calculated by using XIRR approach. XIRR helps in calculating return on investment given an initial and final value and a series of cash inflows and outflows with the correct allowance for the time impact of the transactions. Data as on 31st March 2021
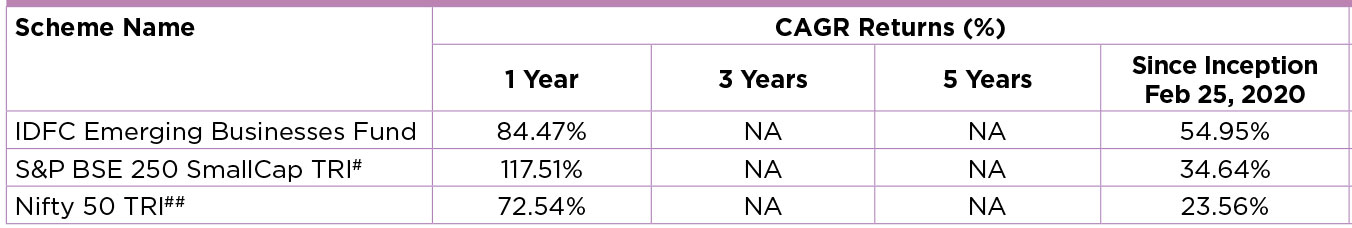
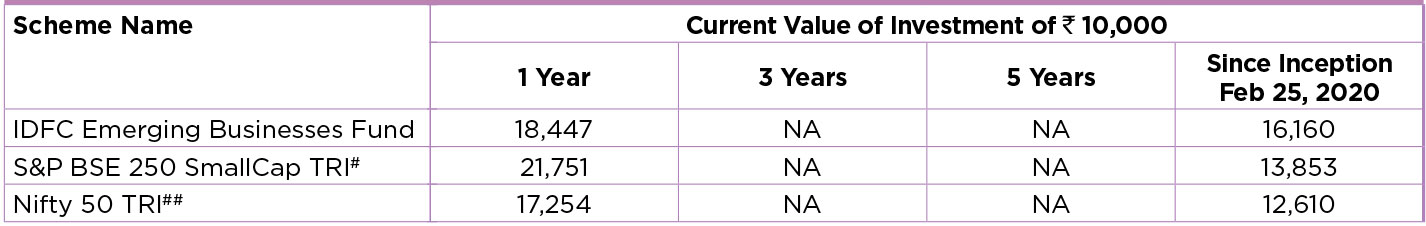
Performance based on NAV as on 31/03/2021. Past performance may or may not be sustained in future.
The performances given are of regular plan growth option.
Click here for other funds managed by the fund manager and refer to the respective fund pages
#Benchmark Returns. ##Alternate Benchmark Returns.
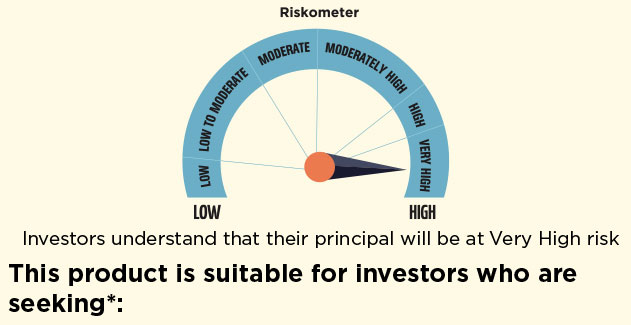
- To create wealth over long term.
- Investment in equity and equity related instrument of small cap companies.
* Investors should consult their financial advisers if in doubt about whether the product is suitable for them.
The scheme has been in existence for more than 1 year but less than 3 years.
Regular and Direct Plans have different expense structure. Direct Plan shall have a lower expense ratio excluding distribution expenses, commission expenses etc..
Other ratios are not given as scheme has not completed 3 years.
^Portfolio Turnover ratio is calculated as Lower of purchase or sale during the period / Average AUM for the last one year (includes Fixed Income securities and Equity derivatives).
