IDFC Sterling Value Fund
An open ended equity scheme following a value investment strategy

IDFC Sterling Value Fund
An open ended equity scheme following a value investment strategy
|
|
|
|
|

|


About the Fund: IDFC Sterling Value Fund is a value fund that focuses on active stock selection strategy.
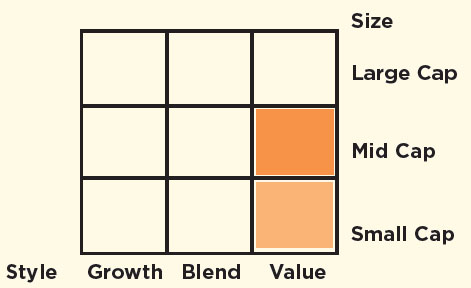
Category: Value
 : ₹ 3,220.23 Crores
AUM or assets under management refers to the recent / updated cumulative market value of investments managed by a mutual fund or any investment firm.
: ₹ 3,208.06 Crores
AUM or assets under management refers to the recent / updated cumulative market value of investments managed by a mutual fund or any investment firm.
:
An employee of the asset management company such as a mutual fund or life insurer, who manages investments of the scheme. He is usually part of a larger team of fund managers and research analysts.
Other Parameter:
| Beta
Beta is a measure of an investment's volatility vis-a-vis the market. Beta of less than 1 means that the security will be less volatile than the market. A beta of greater than 1 implies that the security's price will be more volatile than the market. | 1.05 |
| R Square | 0.97 |
| Standard Deviation (Annualized)
Standard deviation is a statistical measure of the range of an investment's performance. When a mutual fund has a high standard deviation, its means its range of performance is wide, implying greater volatility. | 30.59% |
| Sharpe*
The Sharpe Ratio, named after its founder, the Nobel Laureate William Sharpe, is a measure of risk-adjusted returns. It is calculated using standard deviation and excess return to determine reward per unit of risk. | 0.08 |
| Portfolio Turnover | |
| Equity | 0.18 |
| Aggregate^ | 0.18 |
| Total Expense Ratio | |
| Regular | 2.01% |
| Direct | 0.91% |
(w.e.f. 11th November, 2019)
SIP (Minimum Amount): ₹ 100/- (Minimum 6 instalments)
SIP Frequency: Monthly
SIP Dates (Monthly): Investor may choose any day of the month except 29th, 30th and 31st as the date of instalment.
Investment Objective: Click here
Minimum Investment Amount : ₹ 5,000/- and any amount thereafter
Option Available: Growth, IDCW@ (Payout, Reinvestment and Sweep (from Equity Schemes to Debt Schemes only))
:
Exit load is charged at the time an investor redeems the units of a mutual fund. The exit load is deducted from the prevailing NAV at the time of redemption. For instance, if the NAV is ₹ 100 and the exit load is 1%, the redemption price would be ₹ 99 per unit.
from the date of allotment:
► Upto 10% of investment:Nil,
► For remaining investment: 1% of applicable NAV.
• If redeemed / switched out after 365 days from date
of allotment: Nil. (w.e.f. May 08, 2020)
NAV (₹) as on March 31, 2021
| Regular Plan | Growth | 64.67 |
| Regular Plan | IDCW@ | 23.44 |
| Name | % of NAV |
| Equity and Equity related Instruments | 96.81% |
| Cement & Cement Products | 9.81% |
| oJK Cement | 3.37% |
| The Ramco Cements | 2.19% |
| Prism Johnson | 2.04% |
| ACC | 1.54% |
| Sagar Cements | 0.67% |
| Consumer Durables | 9.33% |
| oVoltas | 2.50% |
| Crompton Greaves Consumer Electricals | 1.77% |
| Greenpanel Industries | 1.55% |
| Greenply Industries | 1.44% |
| Butterfly Gandhimathi Appliances | 1.21% |
| Mayur Uniquoters | 0.86% |
| Auto Ancillaries | 7.81% |
| oMinda Industries | 2.53% |
| Bosch | 1.93% |
| Tube Investments of India | 1.56% |
| Wheels India | 0.95% |
| MRF | 0.52% |
| Sterling Tools | 0.29% |
| WABCO India | 0.02% |
| Software | 6.53% |
| Birlasoft | 2.45% |
| Persistent Systems | 1.68% |
| HCL Technologies | 1.30% |
| KPIT Technologies | 1.11% |
| Consumer Non Durables | 6.52% |
| oEmami | 2.58% |
| Radico Khaitan | 2.05% |
| Tata Consumer Products | 1.89% |
| Industrial Products | 5.81% |
| Graphite India | 2.23% |
| Bharat Forge | 1.86% |
| Polycab India | 1.72% |
| Banks | 5.42% |
| oICICI Bank | 3.99% |
| RBL Bank | 1.42% |
| Chemicals | 5.24% |
| oDeepak Nitrite | 4.65% |
| SRF | 0.60% |
| Ferrous Metals | 5.03% |
| oJindal Steel & Power | 3.21% |
| Kirloskar Ferrous Industries | 1.00% |
| Name | % of NAV |
| Maharashtra Seamless | 0.82% |
| Power | 4.24% |
| oKEC International | 3.01% |
| Kalpataru Power Transmission | 1.23% |
| Pharmaceuticals | 4.04% |
| Aurobindo Pharma | 1.92% |
| IPCA Laboratories | 1.07% |
| Alembic Pharmaceuticals | 0.92% |
| Dishman Carbogen Amcis | 0.13% |
| Gas | 3.34% |
| oGujarat Gas | 3.34% |
| Finance | 3.30% |
| Mas Financial Services | 1.86% |
| Magma Fincorp | 1.44% |
| Construction Project | 2.71% |
| oNCC | 2.71% |
| Leisure Services | 2.48% |
| The Indian Hotels Company | 1.62% |
| EIH | 0.86% |
| Textiles - Cotton | 2.44% |
| Vardhman Textiles | 1.96% |
| Nitin Spinners | 0.48% |
| Textile Products | 2.07% |
| K.P.R. Mill | 1.56% |
| Dollar Industries | 0.50% |
| Transportation | 1.76% |
| VRL Logistics | 1.76% |
| Industrial Capital Goods | 1.70% |
| CG Power and Industrial Solutions | 1.33% |
| Skipper | 0.36% |
| Retailing | 1.56% |
| V-Mart Retail | 1.56% |
| Petroleum Products | 1.53% |
| Bharat Petroleum Corporation | 1.53% |
| Insurance | 1.43% |
| ICICI Lombard General Insurance Company | 1.43% |
| Aerospace & Defense | 1.40% |
| Bharat Electronics | 1.40% |
| Capital Markets | 1.31% |
| ICICI Securities | 1.31% |
| Net Cash and Cash Equivalent | 3.19% |
| Grand Total | 100.00% |
| oTop 10 Equity Holdings |
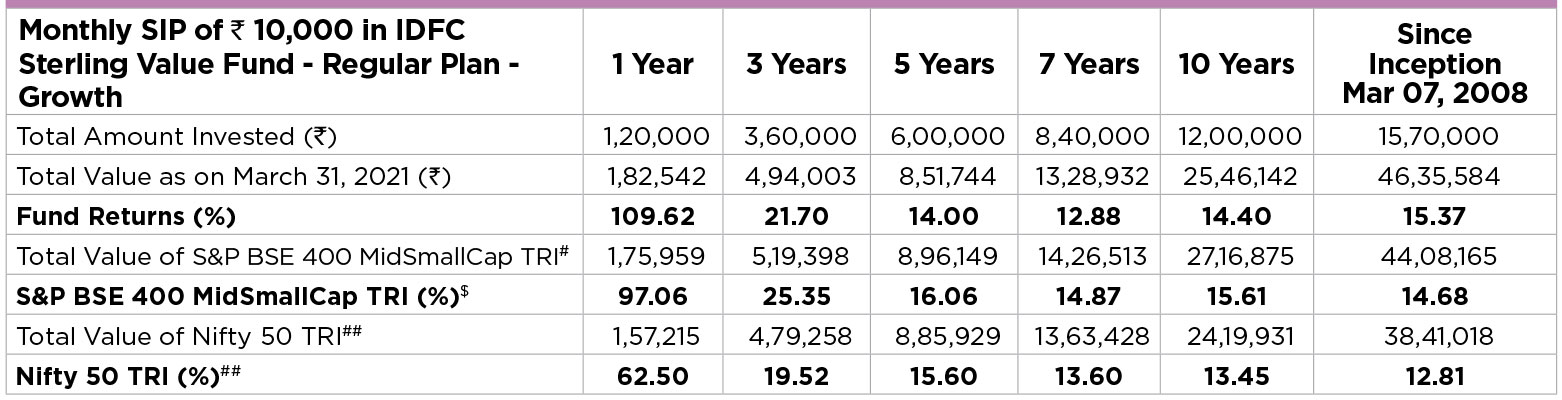
Past performance may or may not be sustained in future. IDCW @ are assumed to be reinvested and bonus is adjusted. Load is not taken into consideration. To illustrate the advantages of SIP investment, this is how your investment would have grown if you had invested say ₹10,000 systematically on the first business Day of every month over a period of time. Returns are calculated by using XIRR approach. XIRR helps in calculating return on investment given an initial and final value and a series of cash inflows and outflows with the correct allowance for the time impact of the transactions. Data as on 31st March 2021
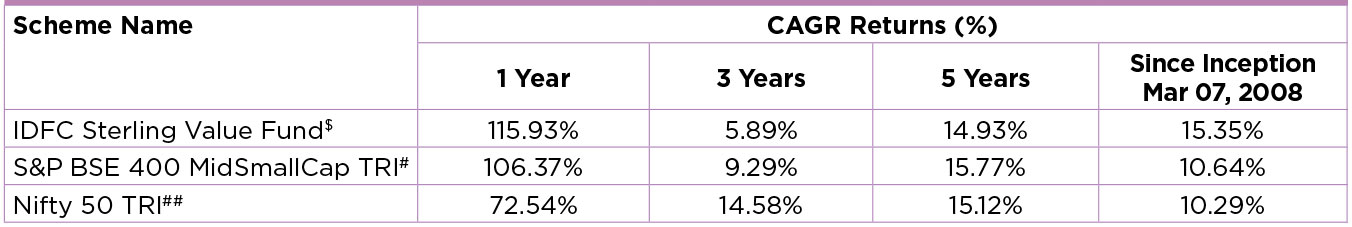
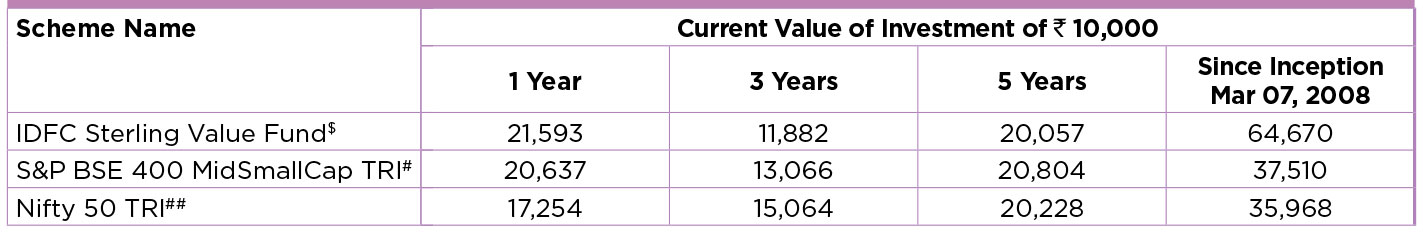
Performance based on NAV as on 31/03/2021. Past performance may or may not be sustained in future.
The performances given are of regular plan growth option.
Click here for other funds managed by the fund manager and refer to the respective fund pages
#Benchmark Returns. ##Alternate Benchmark Returns.
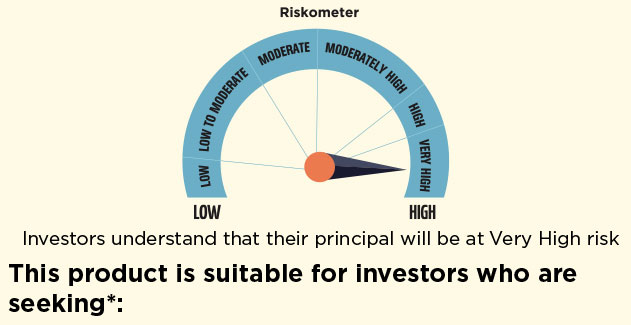
- To create wealth over long term.
- Investment predominantly in equity and equity related instruments following a value investment strategy.
* Investors should consult their financial advisers if in doubt about whether the product is suitable for them.
Regular and Direct Plans have different expense structure. Direct Plan shall have a lower expense ratio excluding distribution expenses, commission expenses etc.
*Risk-free rate assumed to be 3.50% (FBIL OVERNIGHT MIBOR as on 31st March 2021). Ratios calculated on the basis of 3 years history of monthly data.
^Portfolio Turnover ratio is calculated as Lower of purchase or sale during the period / Average AUM for the last one year (includes Fixed Income securities and Equity derivatives).
$The fund has been repositioned from a mid cap fund to a value fund w.e.f. May 28, 2018.
