IDFC Hybrid Equity Fund
An open ended hybrid scheme investing predominantly in equity and equity related instruments

IDFC Hybrid Equity Fund
An open ended hybrid scheme investing predominantly in equity and equity related instruments
|
|
|
|
|

|


Category: Aggressive Hybrid
 : ₹ 552.85 Crores
AUM or assets under management refers to the recent / updated cumulative market value of investments managed by a mutual fund or any investment firm.
: ₹ 560.85 Crores
AUM or assets under management refers to the recent / updated cumulative market value of investments managed by a mutual fund or any investment firm.
:
An employee of the asset management company such as a mutual fund or life insurer, who manages investments of the scheme. He is usually part of a larger team of fund managers and research analysts.
Debt Portion: Mr. Harshal Joshi (w.e.f. 28th July 2021) &
Mr. Anurag Mittal
Other Parameter:
| Standard Deviation (Annualized)
Standard deviation is a statistical measure of the range of an investment's performance. When a mutual fund has a high standard deviation, its means its range of performance is wide, implying greater volatility. | 18.02% | |
| Beta
Beta is a measure of an investment's volatility vis-a-vis the market. Beta of less than 1 means that the security will be less volatile than the market. A beta of greater than 1 implies that the security's price will be more volatile than the market. | 1.11 | |
| R Square | 0.94 | |
| Sharpe*
The Sharpe Ratio, named after its founder, the Nobel Laureate William Sharpe, is a measure of risk-adjusted returns. It is calculated using standard deviation and excess return to determine reward per unit of risk. | 0.42 | |
| Modified Duration ₤
Modified duration is the price sensitivity and the percentage change in price for a unit change in yield | 1.40 years |
| Average Maturity ₤ | 1.65 years |
| Macaulay Duration ₤ | 1.45 years |
| Yield to Maturity ₤
The Yield to Maturity or the YTM is the rate of return anticipated on a bond if held until maturity. YTM is expressed as an annual rate. The YTM factors in the bond's current market price, par value, coupon interest rate and time to maturity. | 4.24% |
| ₤For debt allocation only | |
| Portfolio Turnover | |
| Equity | 0.21 |
| Aggregate^ | 0.27 |
| Total Expense Ratio | |
| Regular | 2.47% |
| Direct | 1.18% |
SIP (Minimum Amount): ₹ 100/- (Minimum 6 instalments)
SIP Frequency: Monthly
SIP Dates (Monthly): Investor may choose any day of the month except 29th, 30th and 31st as the date of instalment.
Investment Objective: Click here
Minimum Investment Amount : ₹ 5,000/- and any amount thereafter
Option Available: Growth & IDCW@ (Payout, Reinvestment & Sweep facility)
:
Exit load is charged at the time an investor redeems the units of a mutual fund. The exit load is deducted from the prevailing NAV at the time of redemption. For instance, if the NAV is ₹ 100 and the exit load is 1%, the redemption price would be ₹ 99 per unit.
Remaining investment: 1% if redeemed/switched out within 1 year from the date of allotment
NAV (₹) as on July 30, 2021
| Regular Plan | Growth | 16.13 |
| Regular Plan | IDCW¥ | 14.61 |
| Name | Rating | % of NAV |
| Equity and Equity related Instruments | 79.37% | |
| Banks | 17.54% | |
| oICICI Bank | 6.80% | |
| oHDFC Bank | 4.78% | |
| oState Bank of India | 2.85% | |
| Axis Bank | 2.24% | |
| City Union Bank | 0.87% | |
| Software | 13.07% | |
| oInfosys | 6.14% | |
| oHCL Technologies | 3.30% | |
| Mastek | 2.38% | |
| Zensar Technologies | 1.26% | |
| Consumer Non Durables | 12.12% | |
| oTata Consumer Products | 3.27% | |
| oRadico Khaitan | 3.01% | |
| Nestle India | 1.98% | |
| Marico | 1.85% | |
| Godrej Consumer Products | 1.05% | |
| ITC | 0.95% | |
| Pharmaceuticals | 11.60% | |
| oLaurus Labs | 4.35% | |
| Gland Pharma | 2.34% | |
| Sun Pharmaceutical Industries | 1.86% | |
| IPCA Laboratories | 1.83% | |
| Cipla | 1.21% | |
| Construction Project | 4.01% | |
| oLarsen & Toubro | 4.01% | |
| Auto | 3.43% | |
| Tata Motors | 2.13% | |
| Mahindra & Mahindra | 1.30% | |
| Chemicals | 3.27% | |
| oDeepak Nitrite | 3.27% | |
| Cement & Cement Products | 2.70% | |
| UltraTech Cement | 1.50% | |
| Name | Rating | % of NAV |
| The Ramco Cements | 1.20% | |
| Telecom - Services | 2.66% | |
| Bharti Airtel | 2.66% | |
| Auto Ancillaries | 1.60% | |
| MRF | 1.60% | |
| Power | 1.57% | |
| Kalpataru Power Transmission | 1.57% | |
| Petroleum Products | 1.47% | |
| Reliance Industries | 1.47% | |
| Retailing | 1.38% | |
| Avenue Supermarts | 1.38% | |
| Consumer Durables | 1.10% | |
| Bata India | 1.10% | |
| Insurance | 1.02% | |
| SBI Life Insurance Company | 1.02% | |
| Industrial Products | 0.83% | |
| Bharat Forge | 0.83% | |
| Government Bond | 6.27% | |
| 7.32% - 2024 G-Sec | SOV | 3.79% |
| 6.79% - 2027 G-Sec | SOV | 1.11% |
| 8.24% - 2027 G-Sec | SOV | 0.98% |
| 7.17% - 2028 G-Sec | SOV | 0.37% |
| 6.84% - 2022 G-Sec | SOV | 0.02% |
| Corporate Bond | 4.80% | |
| LIC Housing Finance | AAA | 2.34% |
| Power Finance Corporation | AAA | 0.97% |
| HDFC | AAA | 0.91% |
| NABARD | AAA | 0.57% |
| State Government Bond | 0.07% | |
| 9.13% Gujarat SDL - 2022 | SOV | 0.07% |
| Net Cash and Cash Equivalent | 9.48% | |
| Grand Total | 100.00% | |
| oTop 10 Equity Holdings |
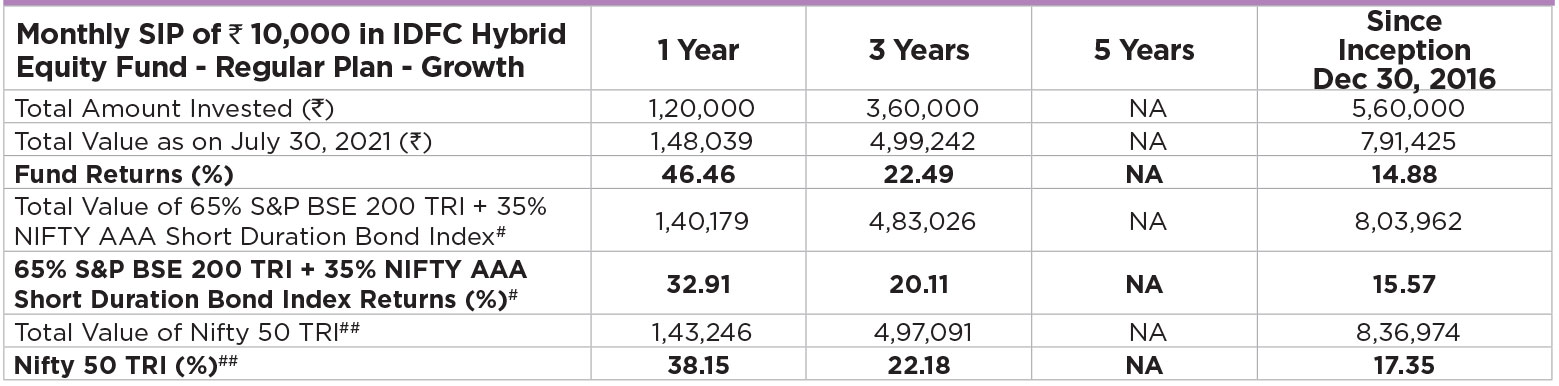
Past performance may or may not be sustained in future.IDCW¥ are assumed to be reinvested and bonus is adjusted. Load is not taken into consideration. To illustrate the advantages of SIP investment, this is how your investment would have grown if you had invested say ₹10,000 systematically on the first business Day of every month over a period of time. Returns are calculated by using XIRR approach. XIRR helps in calculating return on investment given an initial and final value and a series of cash inflows and outflows with the correct allowance for the time impact of the transactions. Data as on 30th July 2021
| Banks | 17.54% |
| Software | 13.07% |
| Consumer Non Durables | 12.12% |
| Pharmaceuticals | 11.60% |
| Construction Project | 4.01% |
| Auto | 3.43% |
| Chemicals | 3.27% |
| Cement & Cement Products | 2.70% |
| Telecom - Services | 2.66% |
| Auto Ancillaries | 1.60% |
| Power | 1.57% |
| Petroleum Products | 1.47% |
| Retailing | 1.38% |
| Consumer Durables | 1.10% |
| Insurance | 1.02% |
| Industrial Products | 0.83% |
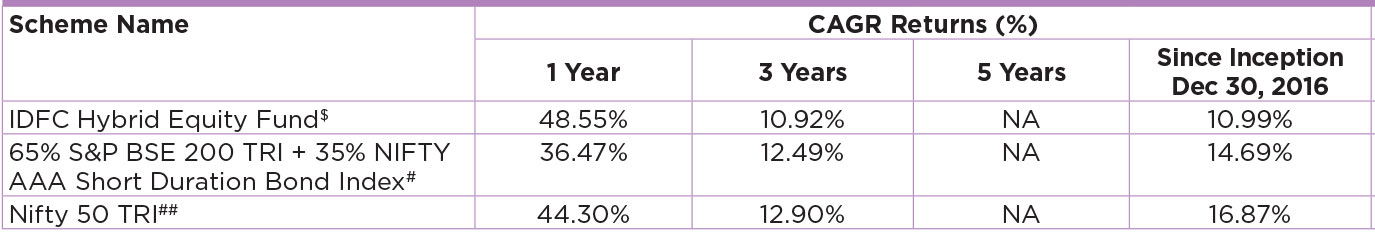
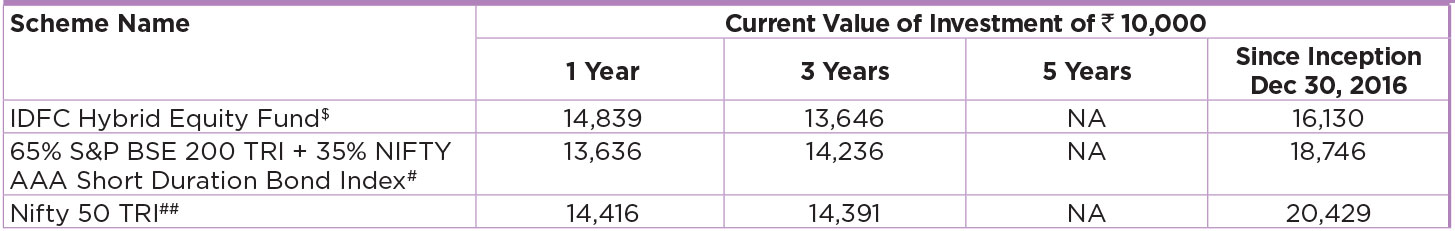
The scheme has been in existence for more than 3 year but less than 5 years.
Performance based on NAV as on 30/07/2021. Past performance may or may not be sustained in future.
The performances given are of regular plan growth option.
Click here for other funds managed by the fund manager and refer to the respective fund pages
#Benchmark Returns. ##Alternate Benchmark Returns.
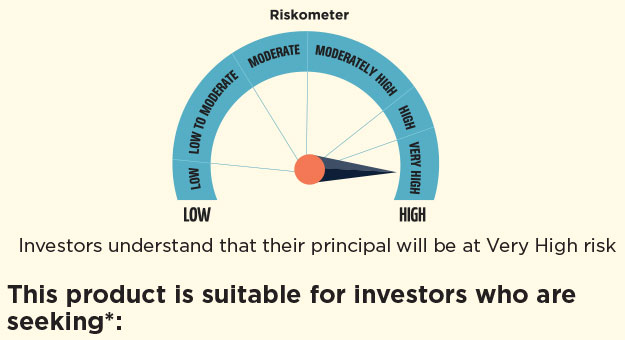
- To create wealth over long term.
- Investment predominantly in equity and equity related securities and balance exposure in debt and money market instruments.
* Investors should consult their financial advisers if in doubt about whether the product is suitable for them.
Regular and Direct Plans have different expense structure. Direct Plan shall have a lower expense ratio excluding distribution expenses, commission expenses etc.
*Risk-free rate assumed to be 3.40% (FBIL OVERNIGHT MIBOR as on 30th July 2021). Ratios calculated on the basis of 3 years history of monthly data.
^Portfolio Turnover ratio is calculated as Lower of purchase or sale during the period / Average AUM for the last one year (includes Fixed Income securities and Equity derivatives).
The portfolio shall be rebalanced on the first business day of every month.
$The fund has been repositioned from Balanced category to Aggressive Hybrid category w.e.f. April 30, 2018.
@Mr. Suyash Choudhary no longer manages the debt portion of the fund. For details please refer Notice (https://www.idfcmf.com/uploads/201120181124Change-in-the-Fund-Manager-for-the- Debt-Portion-of-IDFC-Hybrid-Equity-Fund.pdf )
