IDFC Large Cap Fund
Large Cap Fund- An open ended equity scheme predominantly investing in large cap stocks

IDFC Large Cap Fund
Large Cap Fund- An open ended equity scheme predominantly investing in large cap stocks
|
|
|
|
|

|


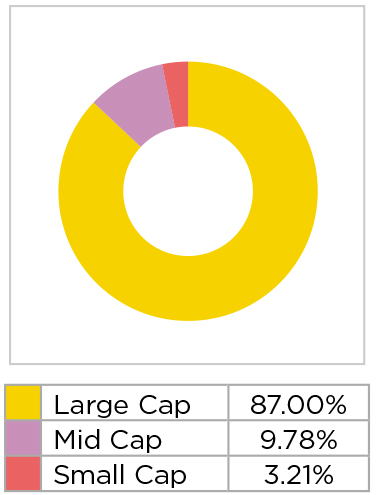
About the Fund: • A Large Cap fund with opportunistic mid/small cap allocation up to 20%
• Focuses on investing in the right sectors as well investing in sector leader companies.
• Fund has a "Growth" and "Quality" oriented investment style with emphasis on visibility of earnings and healthy return ratios
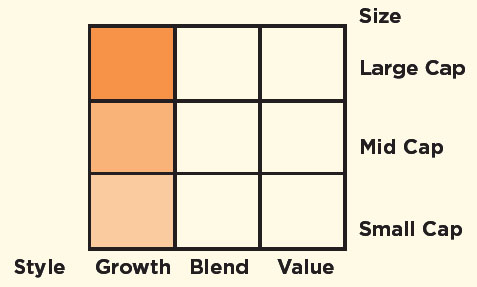
Category: Large Cap
 : ₹ 810.22 Crores
AUM or assets under management refers to the recent / updated cumulative market value of investments managed by a mutual fund or any investment firm.
: ₹ 822.96 Crores
AUM or assets under management refers to the recent / updated cumulative market value of investments managed by a mutual fund or any investment firm.
:
An employee of the asset management company such as a mutual fund or life insurer, who manages investments of the scheme. He is usually part of a larger team of fund managers and research analysts.
Other Parameter:
| Beta
Beta is a measure of an investment's volatility vis-a-vis the market. Beta of less than 1 means that the security will be less volatile than the market. A beta of greater than 1 implies that the security's price will be more volatile than the market. | 0.89 |
| R Square | 0.96 |
| Standard Deviation (Annualized)
Standard deviation is a statistical measure of the range of an investment's performance. When a mutual fund has a high standard deviation, its means its range of performance is wide, implying greater volatility. | 19.84% |
| Sharpe*
The Sharpe Ratio, named after its founder, the Nobel Laureate William Sharpe, is a measure of risk-adjusted returns. It is calculated using standard deviation and excess return to determine reward per unit of risk. | 0.38 |
| Portfolio Turnover | |
| Equity | 0.59 |
| Aggregate^ | 0.75 |
| Total Expense Ratio | |
| Regular | 2.47% |
| Direct | 1.23% |
(w.e.f. April 18, 2017)
SIP (Minimum Amount): ₹ 100/- (Minimum 6 instalments)
SIP Frequency: Monthly
SIP Dates (Monthly): Investor may choose any day of the month except 29th, 30th and 31st as the date of instalment.
Investment Objective: Click here
Minimum Investment Amount : ₹ 5,000/- and any amount thereafter
Option Available: Growth, IDCW$ (Payout, Reinvestment and Sweep (from Equity Schemes to Debt Schemes only))
:
Exit load is charged at the time an investor redeems the units of a mutual fund. The exit load is deducted from the prevailing NAV at the time of redemption. For instance, if the NAV is ₹ 100 and the exit load is 1%, the redemption price would be ₹ 99 per unit.
from the date of allotment:
►Up to 10% of investment: Nil,
►For remaining investment: 1% of applicable NAV
•If redeemed / switched out after 365 days from date
of allotment: Nil. (w.e.f. June 25, 2021)
NAV (₹) as on July 30, 2021
| Regular Plan | Growth | 45.37 |
| Regular Plan | IDCW$ | 17.17 |
| Name | % of NAV | |
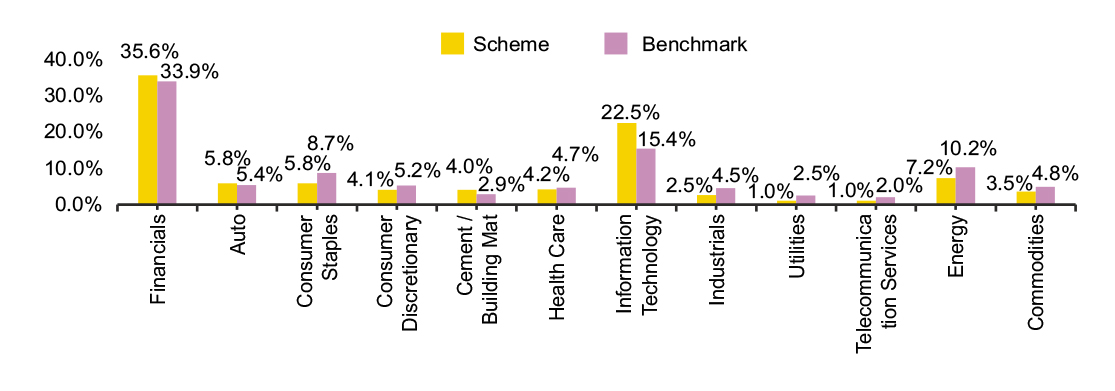
| Equity and Equity related Instruments | 97.29% | |
| Banks | 26.78% | |
| oICICI Bank | 7.41% | |
| oHDFC Bank | 7.07% | |
| oState Bank of India | 5.01% | |
| oAxis Bank | 3.55% | |
| oKotak Mahindra Bank | 3.28% | |
| City Union Bank | 0.46% | |
| Software | 19.28% | |
| oInfosys | 8.23% | |
| oTata Consultancy Services | 3.96% | |
| Tech Mahindra | 2.21% | |
| HCL Technologies | 1.91% | |
| Wipro | 0.93% | |
| Larsen & Toubro Infotech | 0.54% | |
| L&T Technology Services | 0.49% | |
| Coforge | 0.35% | |
| MphasiS | 0.34% | |
| MindTree | 0.31% | |
| Finance | 8.43% | |
| oHDFC | 5.18% | |
| oBajaj Finance | 3.25% | |
| Petroleum Products | 7.16% | |
| oReliance Industries | 5.79% | |
| Bharat Petroleum Corporation | 1.37% | |
| Consumer Non Durables | 7.11% | |
| Hindustan Unilever | 2.12% | |
| Asian Paints | 1.30% | |
| Godrej Consumer Products | 1.10% | |
| Dabur India | 1.02% | |
| Tata Consumer Products | 0.95% | |
| Nestle India | 0.63% | |
| Auto | 4.51% | |
| Mahindra & Mahindra | 1.44% | |
| Maruti Suzuki India | 1.22% | |
| TVS Motor Company | 1.10% | |
| Bajaj Auto | 0.75% | |
| Pharmaceuticals | 4.22% | |
| Divi's Laboratories | 1.31% | |
| Natco Pharma | 1.11% | |
| Dr. Reddy's Laboratories | 1.10% |
| Name | % of NAV | |
| Cipla | 0.69% | |
| Cement & Cement Products | 4.02% | |
| UltraTech Cement | 3.14% | |
| JK Cement | 0.50% | |
| Ambuja Cements | 0.38% | |
| Retailing | 3.76% | |
| Zomato | 2.56% | |
| Avenue Supermarts | 1.19% | |
| Construction Project | 2.54% | |
| Larsen & Toubro | 2.54% | |
| Ferrous Metals | 1.34% | |
| Tata Steel | 1.34% | |
| Non - Ferrous Metals | 1.15% | |
| Hindalco Industries | 1.15% | |
| Consumer Durables | 1.10% | |
| Titan Company | 0.72% | |
| Voltas | 0.37% | |
| Power | 1.02% | |
| Tata Power Company | 1.02% | |
| Telecom - Services | 1.00% | |
| Bharti Airtel | 1.00% | |
| Industrial Products | 0.99% | |
| Bharat Forge | 0.99% | |
| Transportation | 0.56% | |
| Indian Railway Catering And Tourism Corporation | 0.56% | |
| Chemicals | 0.55% | |
| SRF | 0.55% | |
| Textile Products | 0.50% | |
| Page Industries | 0.50% | |
| Capital Markets | 0.50% | |
| UTI Asset Management Company | 0.50% | |
| Pesticides | 0.48% | |
| PI Industries | 0.48% | |
| Auto Ancillaries | 0.30% | |
| Minda Industries | 0.30% | |
| Corporate Bond | 0.005% | |
| Britannia Industries | AAA | 0.005% |
| Net Cash and Cash Equivalent | 2.71% | |
| Grand Total | 100.00% | |
| oTop 10 Equity Holdings |
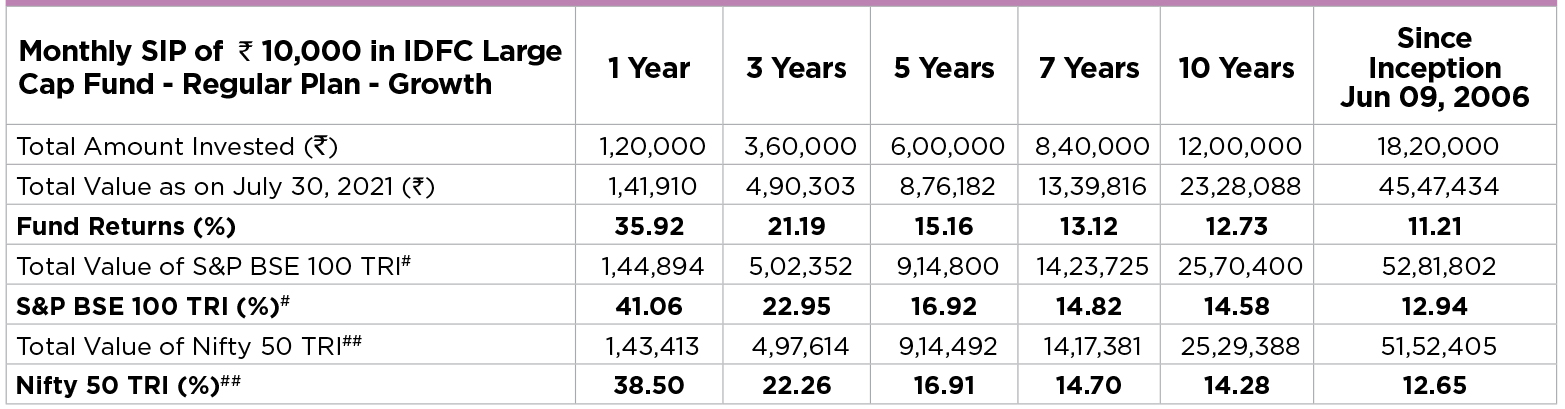
Past performance may or may not be sustained in future. IDCW$ are assumed to be reinvested and bonus is adjusted. Load is not taken into consideration. To illustrate the advantages of SIP investment, this is how your investment would have grown if you had invested say ₹10,000 systematically on the first business Day of every month over a period of time. Returns are calculated by using XIRR approach. XIRR helps in calculating return on investment given an initial and final value and a series of cash inflows and outflows with the correct allowance for the time impact of the transactions. Data as on 30th July 2021
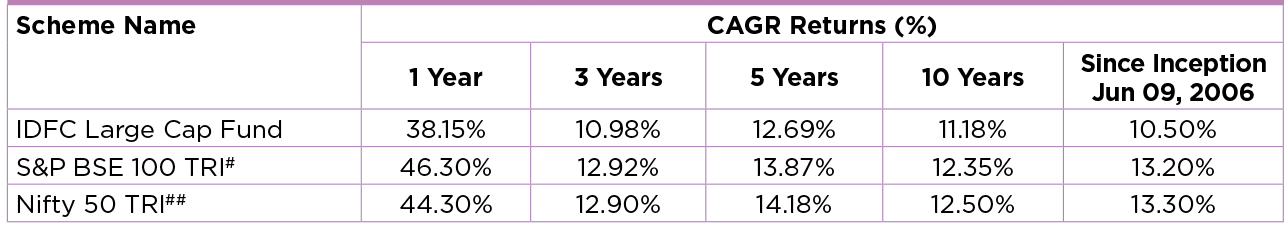
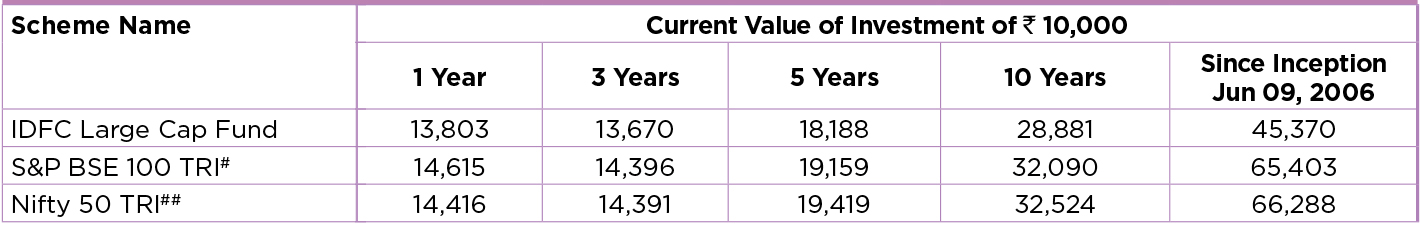
Performance based on NAV as on 30/07/2021. Past performance may or may not be sustained in future.
The performances given are of regular plan growth option.
Click here for other funds managed by the fund manager and refer to the respective fund pages
#Benchmark Returns. ##Alternate Benchmark Returns.
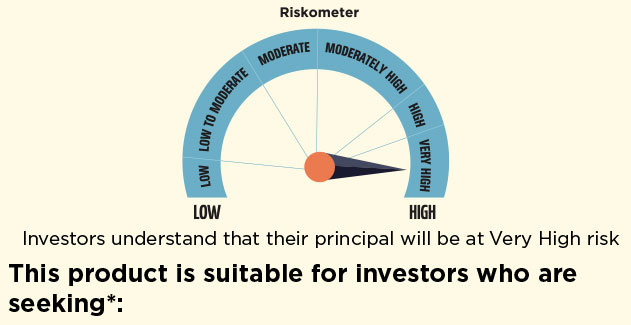
- To create wealth over long term.
- Investment predominantly in equity and equity related instruments of the large cap companies
* Investors should consult their financial advisers if in doubt about whether the product is suitable for them.
Regular and Direct Plans have different expense structure. Direct Plan shall have a lower expense ratio excluding distribution expenses, commission expenses etc.
*Risk-free rate assumed to be 3.40% (FBIL OVERNIGHT MIBOR as on 30th July 2021). Ratios calculated on the basis of 3 years history of monthly data.
^Portfolio Turnover ratio is calculated as Lower of purchase or sale during the period / Average AUM for the last one year (includes Fixed Income securities and Equity derivatives).
Current Index performance adjusted for the period from since inception to April 18, 2017 with the performance of Nifty 50 TRI (Benchmark)
Current Index performance adjusted for the period from since inception to June 28, 2007 with the performance of S&P BSE 100 price return index (Benchmark)
The fund has been repositioned from an IPO fund to a large cap fund w.e.f. April 18, 2017
