IDFC Sensex ETF
An open ended scheme tracking S&P BSE Sensex Index

IDFC Sensex ETF
An open ended scheme tracking S&P BSE Sensex Index
|
|
|
|
|

|


Category: Exchange Traded Fund
 : ₹ 0.73 Crores
AUM or assets under management refers to the recent / updated cumulative market value of investments managed by a mutual fund or any investment firm.
: ₹ 0.76 Crores
AUM or assets under management refers to the recent / updated cumulative market value of investments managed by a mutual fund or any investment firm.
:
An employee of the asset management company such as a mutual fund or life insurer, who manages investments of the scheme. He is usually part of a larger team of fund managers and research analysts.
Other Parameter:
| Beta | 0.98 |
| R Square | 1.00 |
| Standard Deviation (Annualized) | 21.68% |
| Sharpe* | 0.52 |
| Portfolio Turnover | |
| Equity | 0.07 |
| Aggregate^ | 0.07 |
| Tracking Error(Annualized) | 0.70% | Total Expense Ratio : | 0.35% |
SIP (Minimum Amount): NA
SIP Frequency: NA
SIP Dates (Monthly): NA
Investment Objective: Click here
Minimum Investment Amount : Directly with Fund - Authorised Participants and Large Investors can directly purchase / redeem in blocks from the fund in "Creation unit size" on any business day. On the Exchange - The units of the Scheme can be purchased and sold in minimum lot of 1 unit and in multiples thereof
Option Available: Presently the scheme does not offer any Plan/Options for Investment
:
Exit load is charged at the time an investor redeems the units of a mutual fund. The exit load is deducted from the prevailing NAV at the time of redemption. For instance, if the NAV is ₹ 100 and the exit load is 1%, the redemption price would be ₹ 99 per unit.
NAV (₹) as on May 31, 2021
| Regular Plan | Growth | 541.7144 |
| Regular Plan | IDCW@ | NA |
| Name | % of NAV |
| Equity and Equity related Instruments | 98.58% |
| Banks | 30.09% |
| oHDFC Bank | 10.68% |
| oICICI Bank | 8.07% |
| oKotak Mahindra Bank | 4.10% |
| oAxis Bank | 3.41% |
| State Bank of India | 2.83% |
| IndusInd Bank | 1.00% |
| Software | 17.32% |
| oInfosys | 8.79% |
| oTata Consultancy Services | 5.67% |
| HCL Technologies | 1.77% |
| Tech Mahindra | 1.09% |
| Petroleum Products | 12.32% |
| oReliance Industries | 12.32% |
| Finance | 10.48% |
| oHDFC | 7.90% |
| Bajaj Finance | 2.58% |
| Consumer Non Durables | 10.47% |
| oHindustan Unilever | 3.62% |
| oITC | 3.34% |
| Asian Paints | 2.34% |
| Nestle India | 1.16% |
| Auto | 3.87% |
| Maruti Suzuki India | 1.67% |
| Name | % of NAV |
| Mahindra & Mahindra | 1.26% |
| Bajaj Auto | 0.93% |
| Construction Project | 3.05% |
| Larsen & Toubro | 3.05% |
| Pharmaceuticals | 2.37% |
| Sun Pharmaceutical Industries | 1.25% |
| Dr. Reddy's Laboratories | 1.11% |
| Telecom - Services | 2.26% |
| Bharti Airtel | 2.26% |
| Power | 1.92% |
| Power Grid Corporation of India | 1.00% |
| NTPC | 0.92% |
| Cement & Cement Products | 1.32% |
| UltraTech Cement | 1.32% |
| Insurance | 1.24% |
| Bajaj Finserv | 1.24% |
| Consumer Durables | 1.17% |
| Titan Company | 1.17% |
| Oil | 0.72% |
| Oil & Natural Gas Corporation | 0.72% |
| Net Cash and Cash Equivalent | 1.42% |
| Grand Total | 100.00% |
| oTop 10 Equity Holdings |
| Banks | 30.09% |
| Software | 17.32% |
| Petroleum Products | 12.32% |
| Finance | 10.48% |
| Consumer Non Durables | 10.47% |
| Auto | 3.87% |
| Construction Project | 3.05% |
| Pharmaceuticals | 2.37% |
| Telecom - Services | 2.26% |
| Power | 1.92% |
| Cement & Cement Products | 1.32% |
| Insurance | 1.24% |
| Consumer Durables | 1.17% |
| Oil | 0.72% |
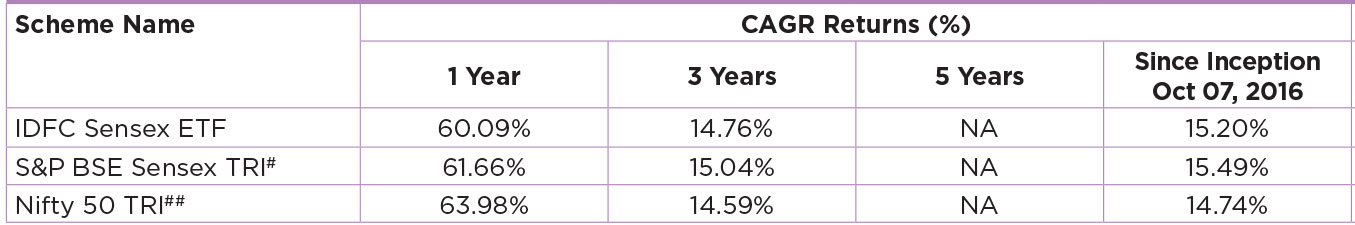
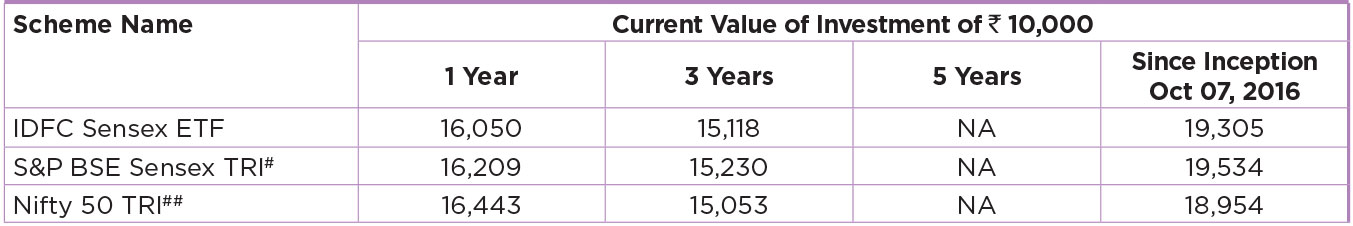
The scheme has been in existence for more than 3 year but less than 5 years.
Performance based on NAV as on 31/05/2021. Past performance may or may not be sustained in future.
Click here for other funds managed by the fund manager and refer to the respective fund pages
#Benchmark Returns. ##Alternate Benchmark Returns.
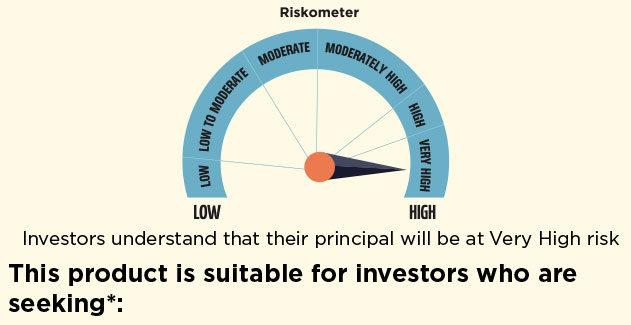
- To create wealth over long term.
- Investing in equity and equity related instruments forming part of S&P BSE Sensex Index.
* Investors should consult their financial advisers if in doubt about whether the product is suitable for them.
*Risk-free rate assumed to be 3.39% (FBIL OVERNIGHT MIBOR as on 31st May 2021). Ratios calculated on the basis of 3 years history of monthly data.
Portfolio Turnover ratio is calculated as Lower of purchase or sale during the period / Average AUM for the last one year (includes Fixed Income securities and Equity derivatives).
