Commentary

GLOBAL MARKETS
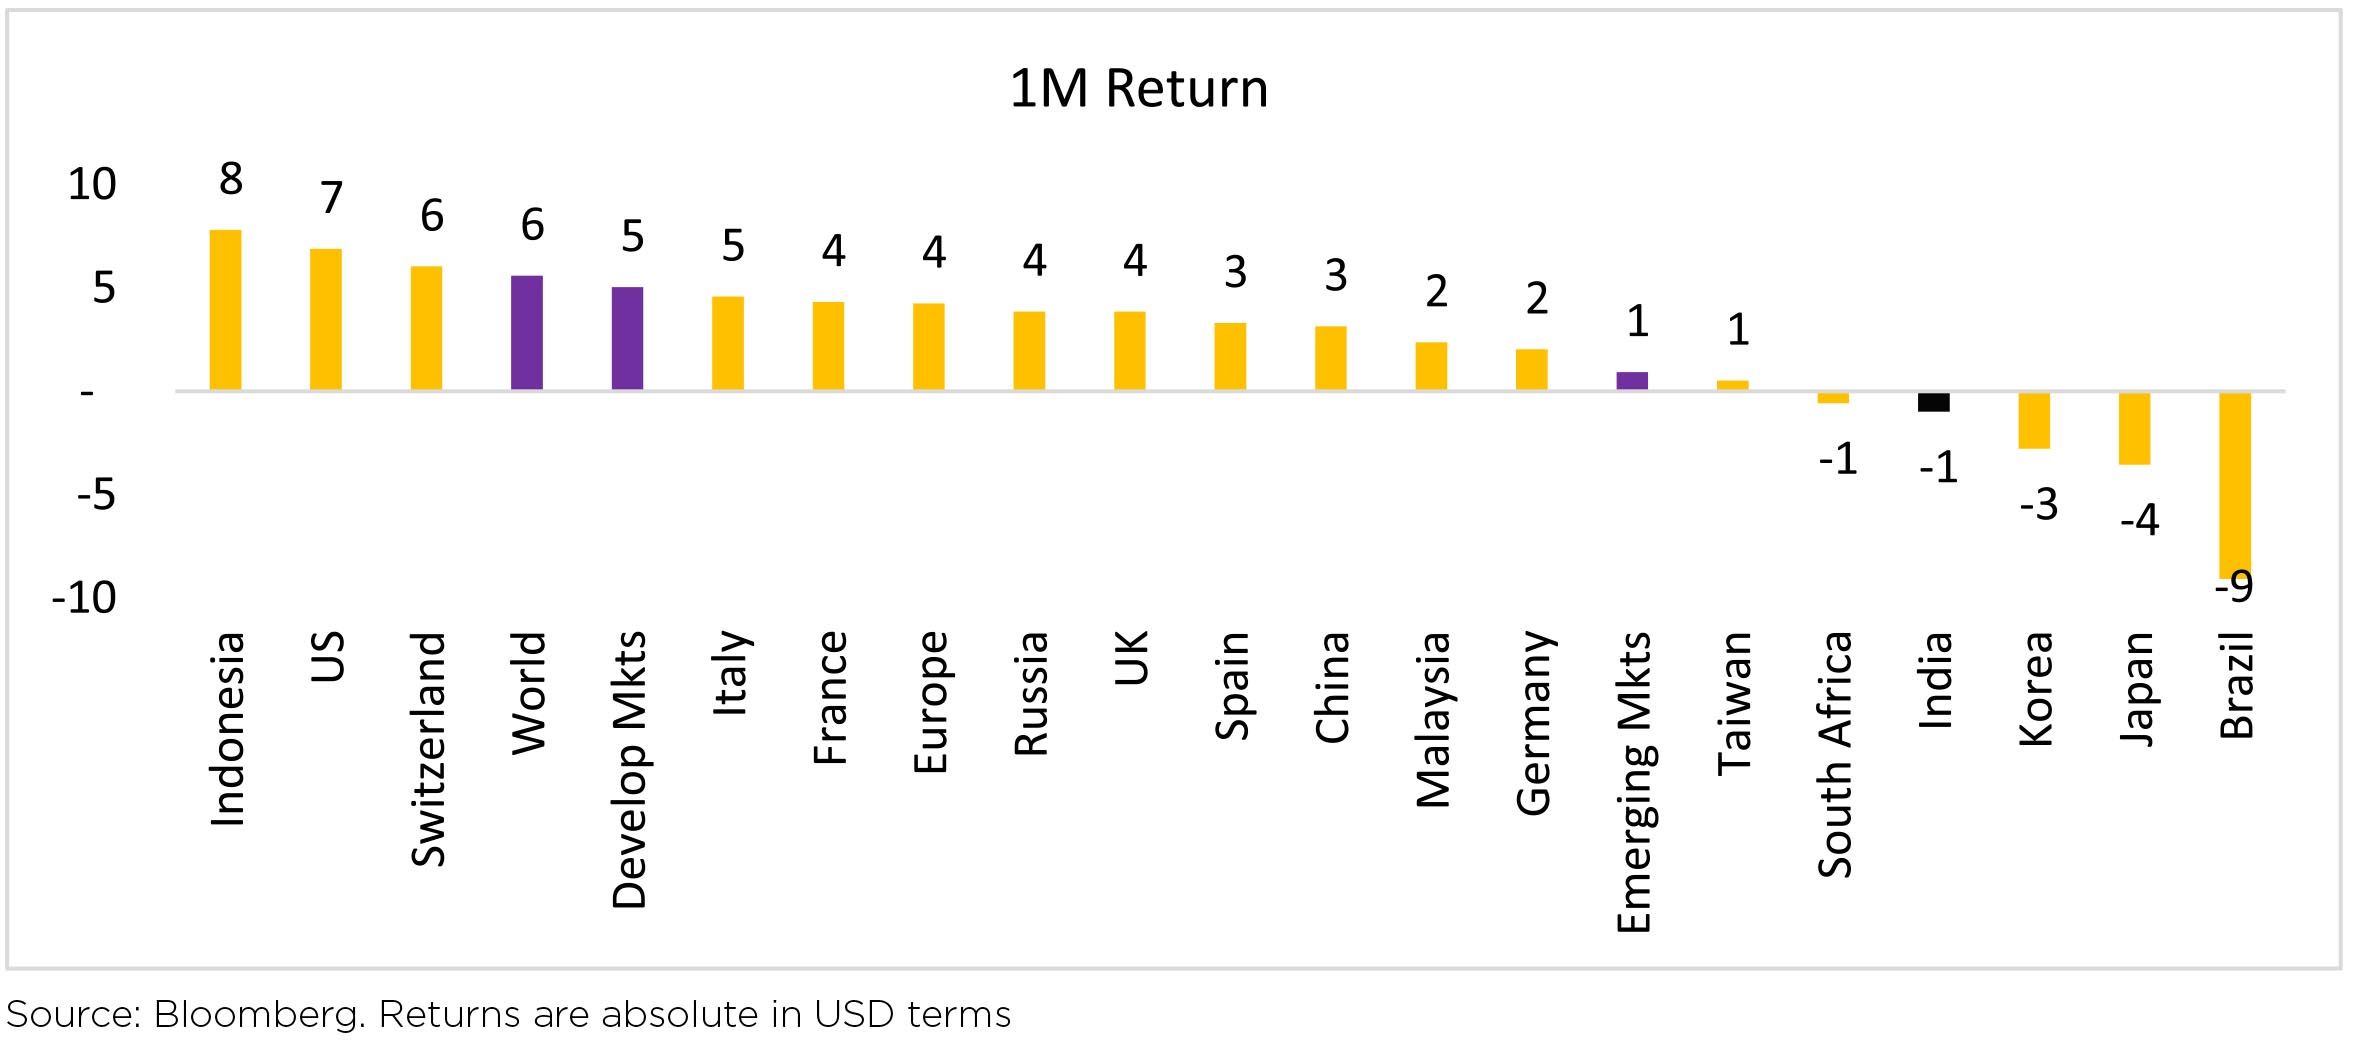
Global equities gained 5% in October, with the US up +6.9% ahead of Emerging Markets (up +0.9%). Jul-
Sep'21 quarter earnings are likely a bullish catalyst for equities globally given undemanding expectations,
and reporting thus far points to better than expected results across the regions. In the quarter, global
GDP growth likely expanded but there was a substantial step back in the speed of the recovery. Growth
is likely to stay at a robust pace while inflation moderates to a higher than pre-pandemic rate.
Indian equities were broadly flat (USD terms), but saw one of the weakest performances across the broader markets in October - MSCI APxJ/EM (+1.7%/+0.9%).
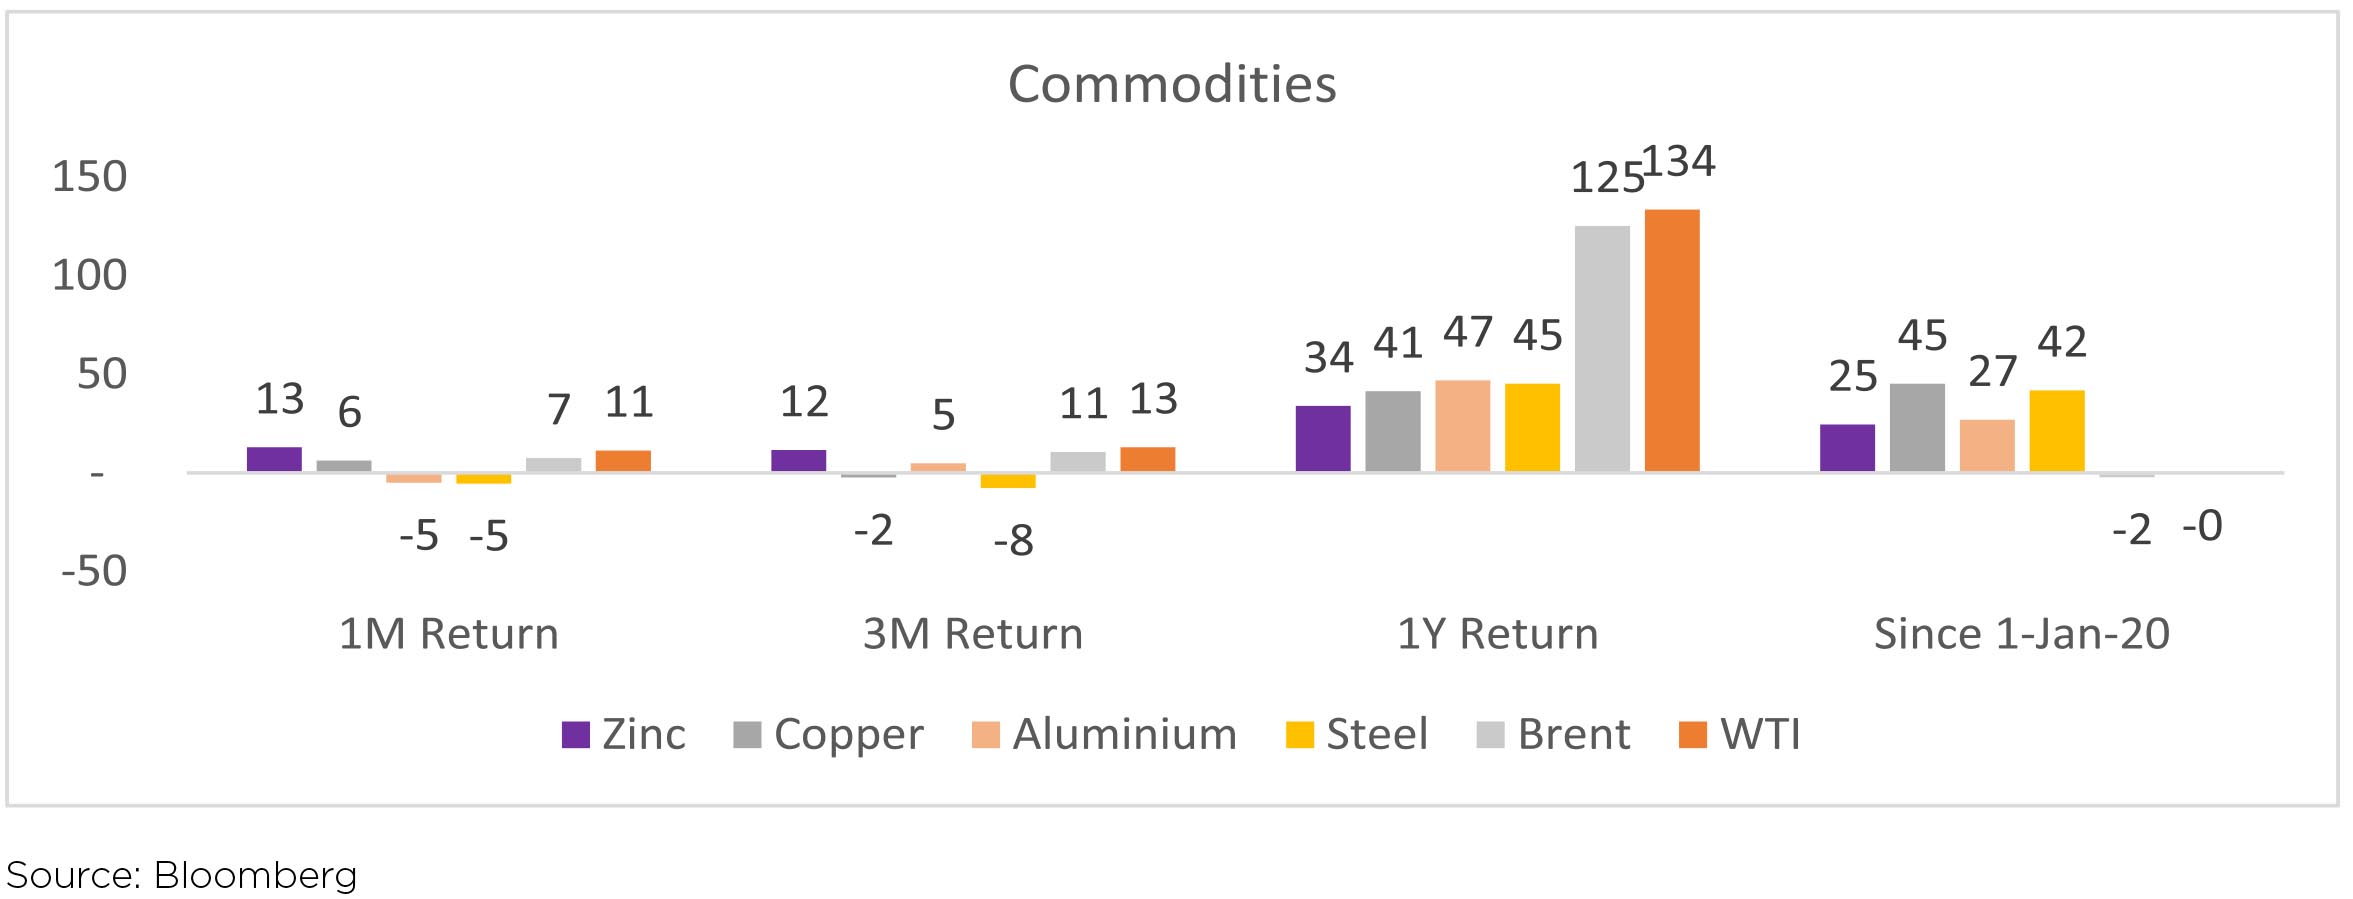
Brent and Commodities: Oil prices continued to gain with a 6.5% increase in October, closing at $84/ barrel. Oil prices rose on the back of a shortage of natural gas that has increased demand for other energy sources. With OECD commercial oil inventories 5.4% below the 5-year average and demand rapidly normalizing, OPEC+'s preference to keep production policy unchanged reflects an alliance that is significantly more tolerant of higher prices. The Chinese market was mixed. HRC prices fell 1% while Rebar/billet prices improved 1%. Iron ore prices fell 3% on news of further production cuts during the winter season. Export HRC FoB prices improved by 1%.
Indian equities were broadly flat (USD terms), but saw one of the weakest performances across the broader markets in October - MSCI APxJ/EM (+1.7%/+0.9%).

Brent and Commodities: Oil prices continued to gain with a 6.5% increase in October, closing at $84/ barrel. Oil prices rose on the back of a shortage of natural gas that has increased demand for other energy sources. With OECD commercial oil inventories 5.4% below the 5-year average and demand rapidly normalizing, OPEC+'s preference to keep production policy unchanged reflects an alliance that is significantly more tolerant of higher prices. The Chinese market was mixed. HRC prices fell 1% while Rebar/billet prices improved 1%. Iron ore prices fell 3% on news of further production cuts during the winter season. Export HRC FoB prices improved by 1%.

Domestic Markets
Indian markets corrected in the second half of October with NIFTY closing above 17500 levels at monthend. YTD, Indian equities are up 24%+, tracking SPX, in USD terms. It has outperformed EM by 22%; though with the recent correction the gap has reduced. The correction could be for three reasons: firstly, elevated valuations - MSCI India is trading at ~24x on forward earnings, well above its 15Y average of 16.4x, secondly due to a relatively weak start to the earnings season, and thirdly due to increases in the oil price resulting in inflationary pressure.
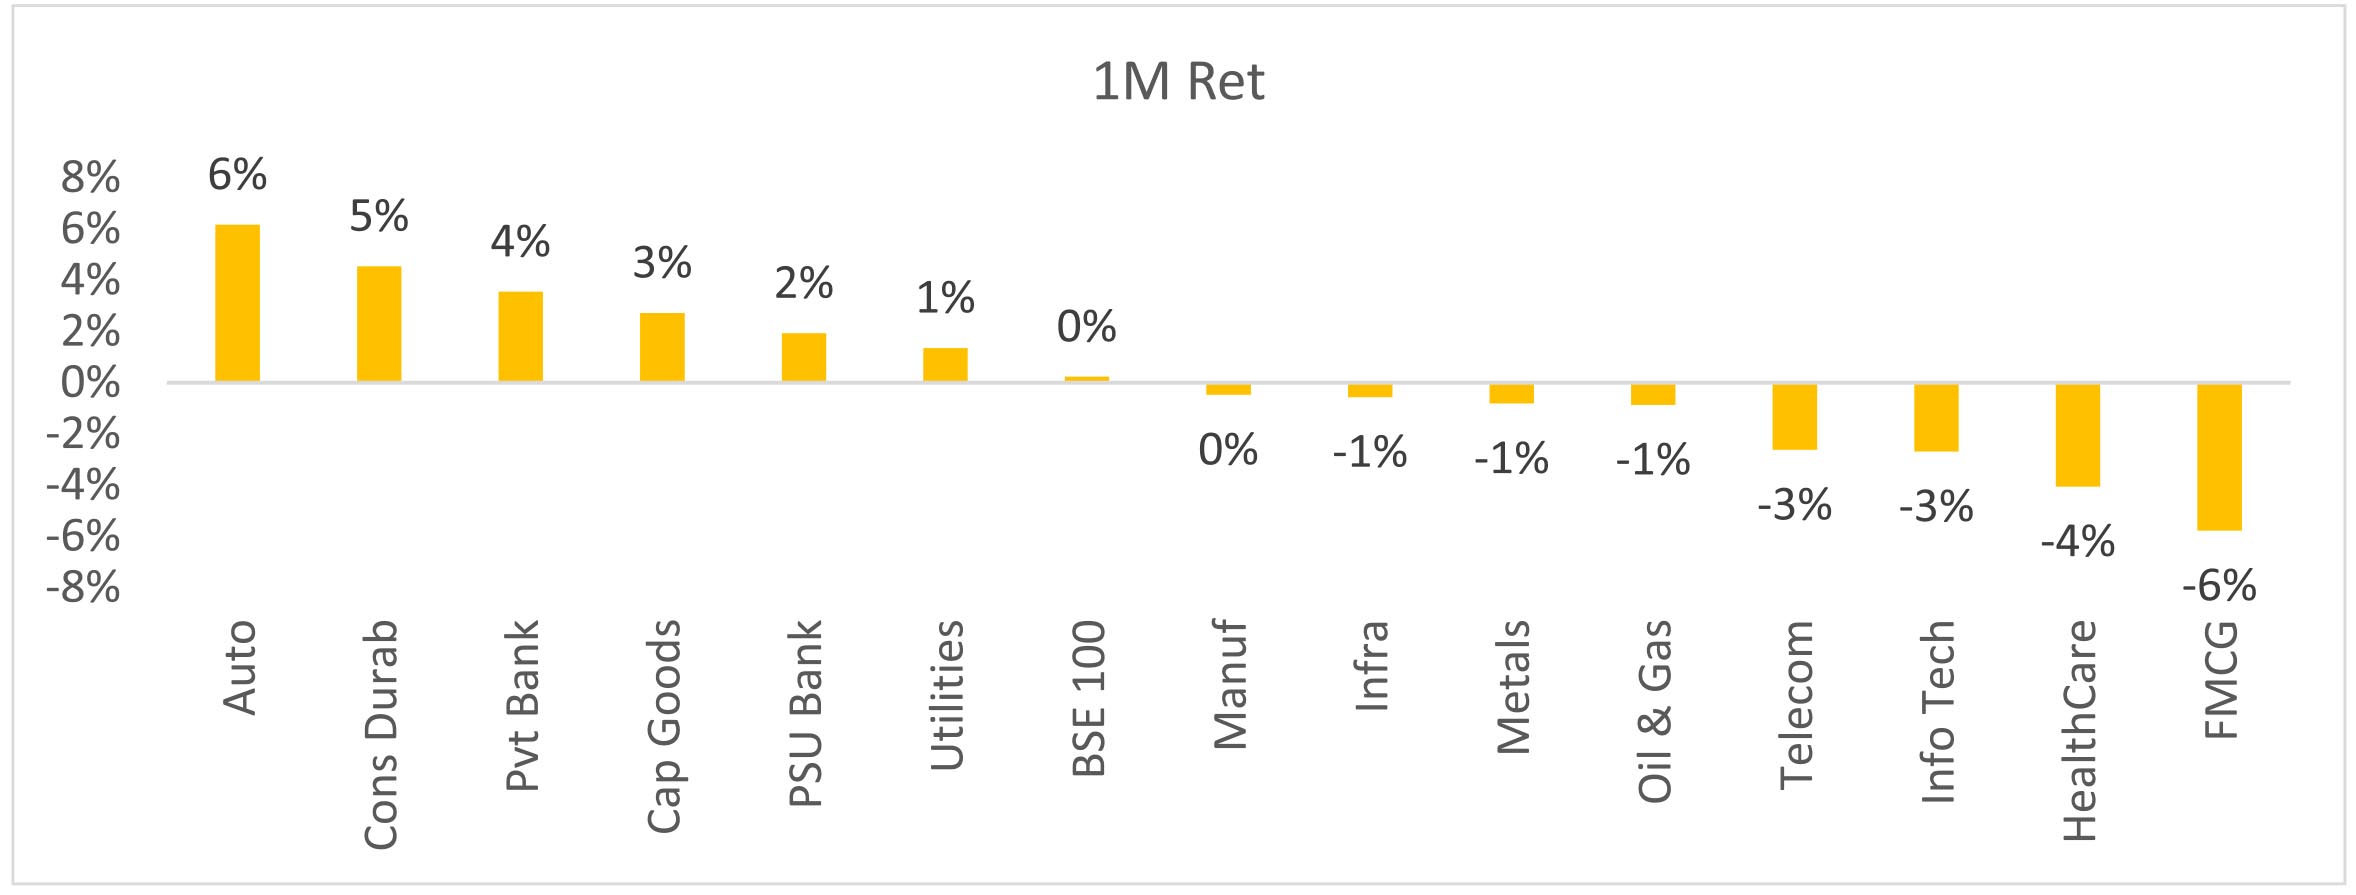
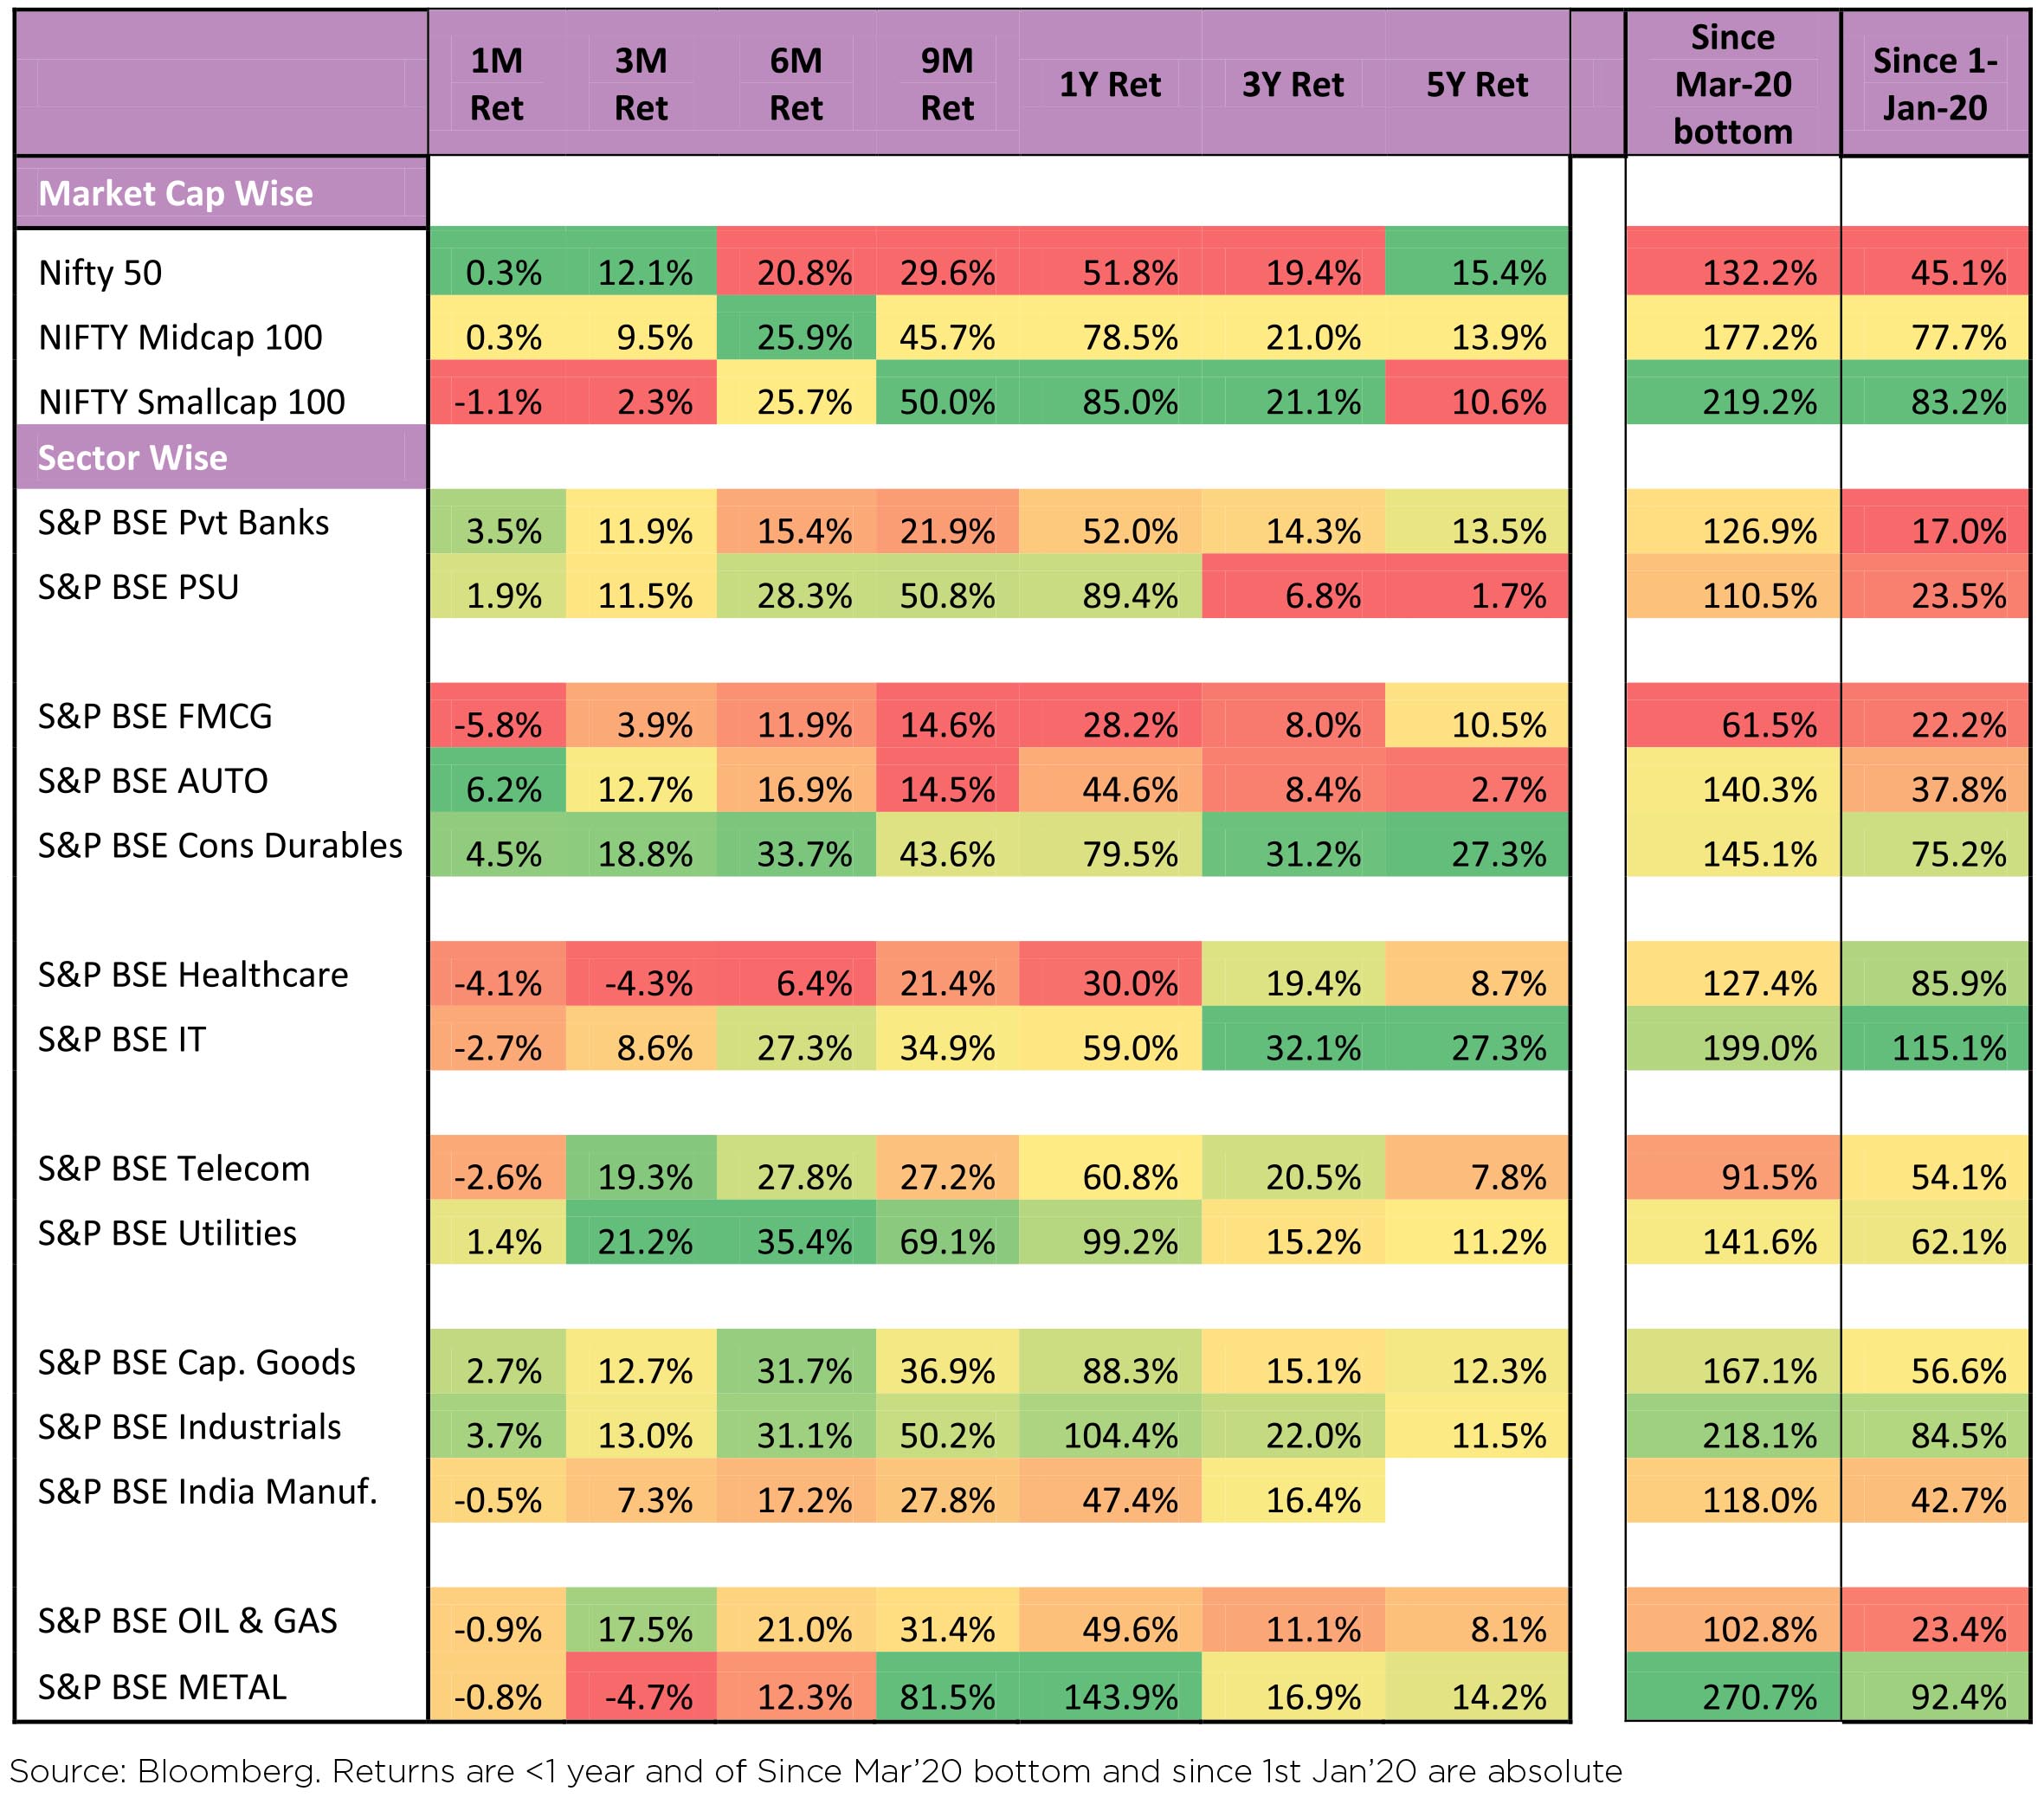
By sector, Consumer Discretionary, Financials, Cap Goods outperformed while Healthcare, IT, and Consumer Staples were notable laggards. INR ended at ~74.88/USD, down 0.9%. DXY ended flat with -0.1% over the month.
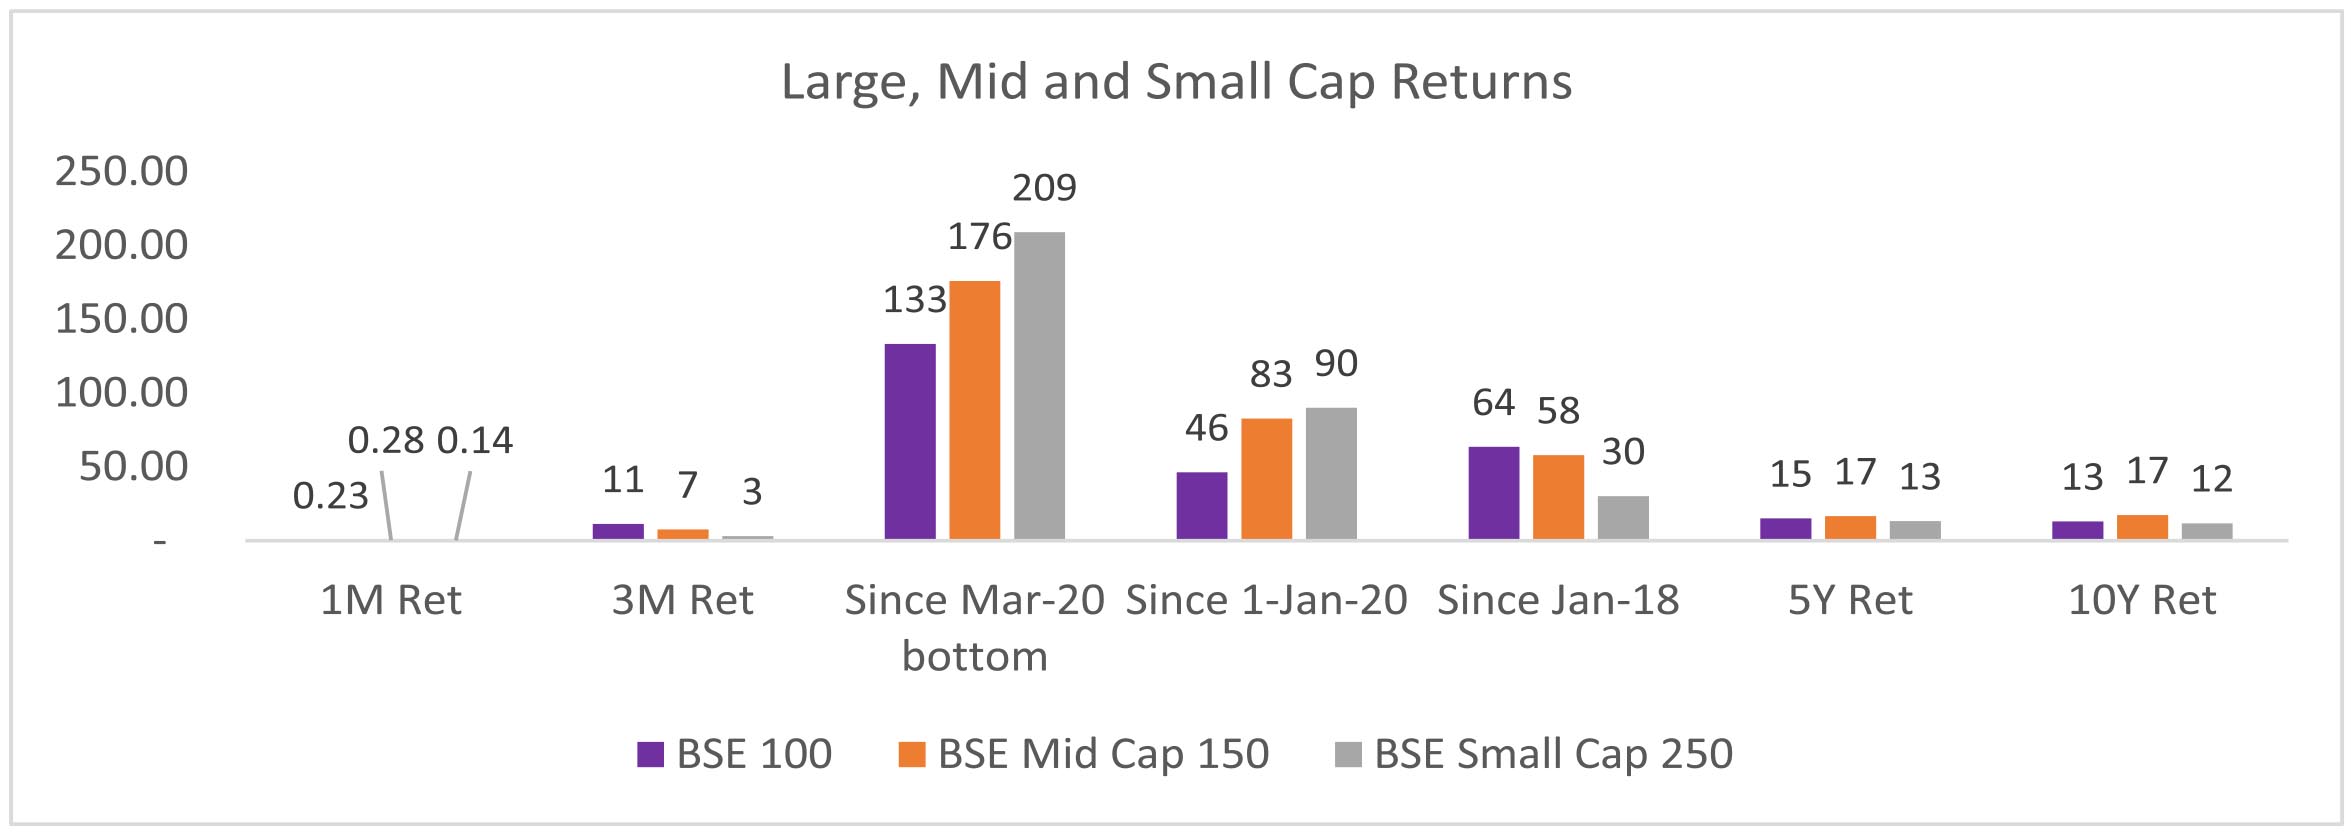
Source: Bloomberg. Less than 1-year absolute returns, Greater than 1-year CAGR. The above graph is for representation purposes only and should not be used for the development or implementation of an investment strategy. Past performance may or may not be sustained in the future.
Rural demand encouraging: Steady improvement in consumer sentiment in Rural has been aided by
► Monsoon rainfall saw late pick-up, agri production flat. Cumulative monsoon season rainfall was 1% below normal; improving from a 9% deficit as of end Aug. The summer crop area sown was flat YoY and the government's initial estimate of summer crop indicates flattish production.
► Aggregate COVID-19 daily cases have started to come down, to ~14k/day from 25k in early October.
► Resumption of schools/colleges in the last 2 months has further boosted sentiment, particularly in North and Eastern India
Macro prints have been mixed
• September PMI recovered broadly but modestly. The recovery in the manufacturing sector after May's lockdowns has been modest on a smaller brunt in May. The services sector has seen a much larger fall and rebound in activity.
• India's Sep'21 CPI at 4.35% was slightly below expectations. For the 3rd consecutive month, food prices contracted, declining 0.1% in Sep'21, thereby bucking the global trend of rising food prices. Vegetable prices have remained volatile and are rising sharply in October, which will show up in the next CPI print.
• GST collections in October increased sharply to Rs1.3tn on the back of festive demand and improving compliance.
• Indian fiscal situation is pretty healthy owing to healthy tax flows and well-managed expenditure.
• Growth in 2HFY22 would be aided by (1) improved vaccination drive, (2) festive demand, and (3) government spending.
Assembly elections for 5 states which comprise ~20% of India's population and 14% of GDP are slated to take place over Feb-Mar'22 - UP, Punjab, Uttarakhand, Goa and Manipur.
June-quarter results were mixed: Companies struggled to deal with the unprecedented rise in RM costs. Most of these companies have registered steep price hikes since the last week of Sept and it remains to be seen what it does to the volumes in December Quarter.
Even as on one hand the formal sector is witnessing stellar growth, the informal sector continues to remain under stress. The employee costs of the listed companies over the past few quarters point towards a sustained K-shape recovery.
► Financials: The gap between the best and the second-best is closing. For corporate lenders, the balance sheets are cleaner, stronger; the focus on business is well defined and the valuation gap, therefore. Even the grip on asset quality is not as solid as it used to be. Besides, high jump in OPEX was a common irritant in lot of the Banking and NBFC names that reported .
► IT sector: Indian IT services delivered one of its best-ever quarterly performances. Deal wins and Cash conversion across Tier-I IT moderated, attrition spiked and Utilizations were higher
► Oil & Gas (O&G): The performance of OMCs was driven by a better-than-expected margin performance, led by both higher reported GRM and higher-than-estimated marketing margins. Sales volume witnessed a demand recovery post the second COVID wave.
► Autos: High raw material inflation and operating deleverage impacted the sector's 2QFY22 results. OEMs reported a commodity cost impact of 2-4pp QoQ, but expect semi-conductor supply to improve from the 2QFY22 levels. OEMs are walking a thin line between passing on the increased costs as prices rise and managing the current demand situation.
► Consumer: There was a pick-up in discretionary consumption, while the decent momentum in staples. Some staples players have witnessed a slowdown in the rural markets in recent weeks. Nevertheless, the fundamentals of the rural markets remain robust with a good monsoon and Rabi sowing and the outlook, therefore, remains positive. Urban markets continued to recover well. The scorching inflation in several commodities led to significant gross margin pressure for several players despite the companies taking price hikes. The ongoing festive season appears to have started on a good note with upbeat consumer sentiments. 3QFY22 is likely to see a good performance, especially in the discretionary categories.
► Cement: Higher realisation/sales volumes failed to offset rising costs (1) higher energy costs led by an increase in pet coke/coal prices, 2) higher freight costs led by higher diesel prices, and 3) higher other expenses led by normalisation of travel and office expenses as well as increased packaging costs. Cash flow generation from operations was impacted by higher working capital requirements on account of an increase in fuel costs.
► Healthcare: Some tapering in demand for Pharma companies in 2QFY22 due to lower sales of COVID products in Domestic Formulations (DF). US sales remain under pressure for large pharma companies, due to a high level of price erosion. Regulatory risks continue to rise due to an increase in activity by the USFDA in India. The impact of raw material pricing pressure due to disruption in China was less than what was feared.
Global uncertainty remains
► Increased risks of global economic slowdown and inflationary pressures: This has been highlighted in the October MPC minutes also. Global growth expectations are being scaled down through slowdown in China, withdrawal of US fiscal stimulus, and energy crisis.
► FED tapering: The FED signaled to soon commence tapering with median forecasts hinting at rate hikes in 2022
► Real estate crisis in China: Following the suite of China's 2nd largest real estate company, Evergrande, many other real estate companies are struggling to avoid default. With increased challenges to recover the dues, the real estate segment remains under the stress of default risk with the possibility of having a contagion effect.
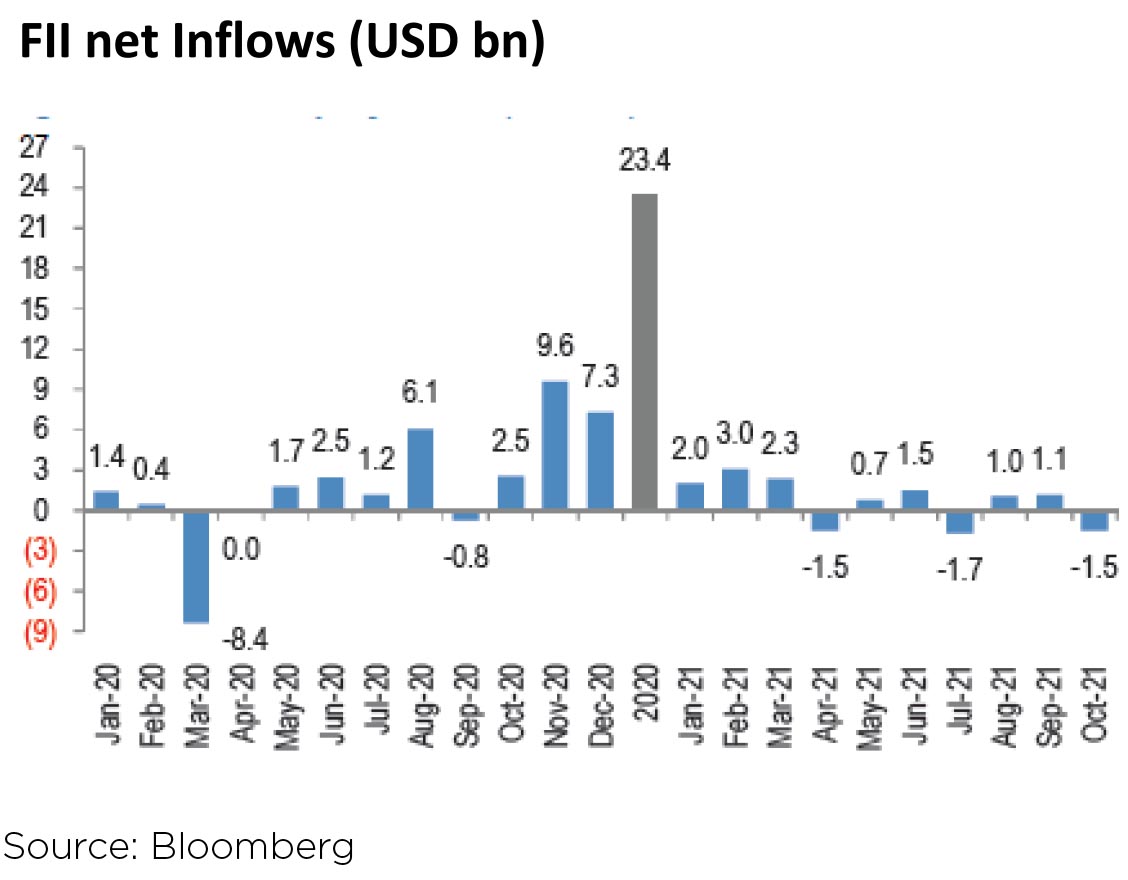
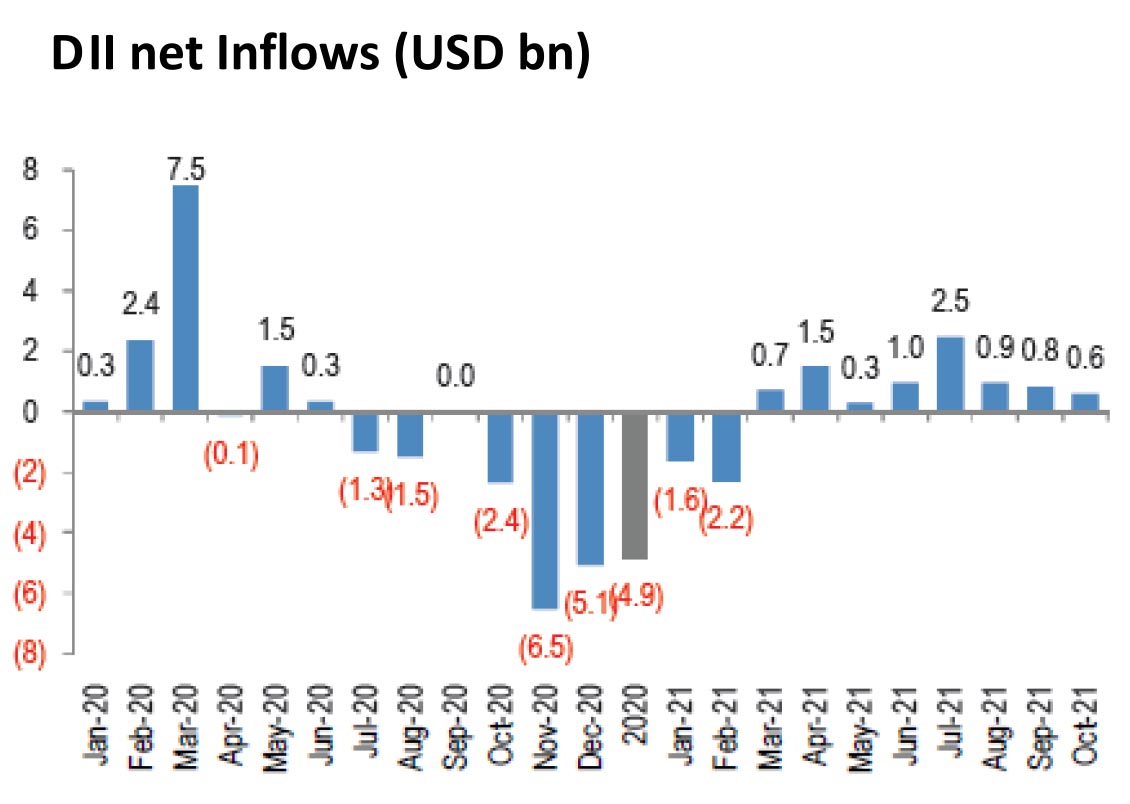
Institutional flows: FIIs were net sellers of Indian equities (-$1.5bn, following +$1.1bn in September). By quarter, Q1CY21 saw $7.3bn of inflows, while Q2CY21 and Q3CY21 ended at a modest $758mn and $446mn of net buying respectively. FIIs were net sellers in the debt markets too, with outflows of US$174mn in October. DIIs remained large net equity buyers for the eight-month running (+$597mn, vs +$809mn in September). Mutual funds were net equity buyers at US$212mn while insurance funds bought US$385mn of equities in October.
Sectoral Performance (as of 29th October 2021)
Outlook
Three key drivers of Equity markets are 1) Earnings 2) Interest Rates and 3) Valuations. Let us look at where these factors stand from a going-forward perspective.
Valuations
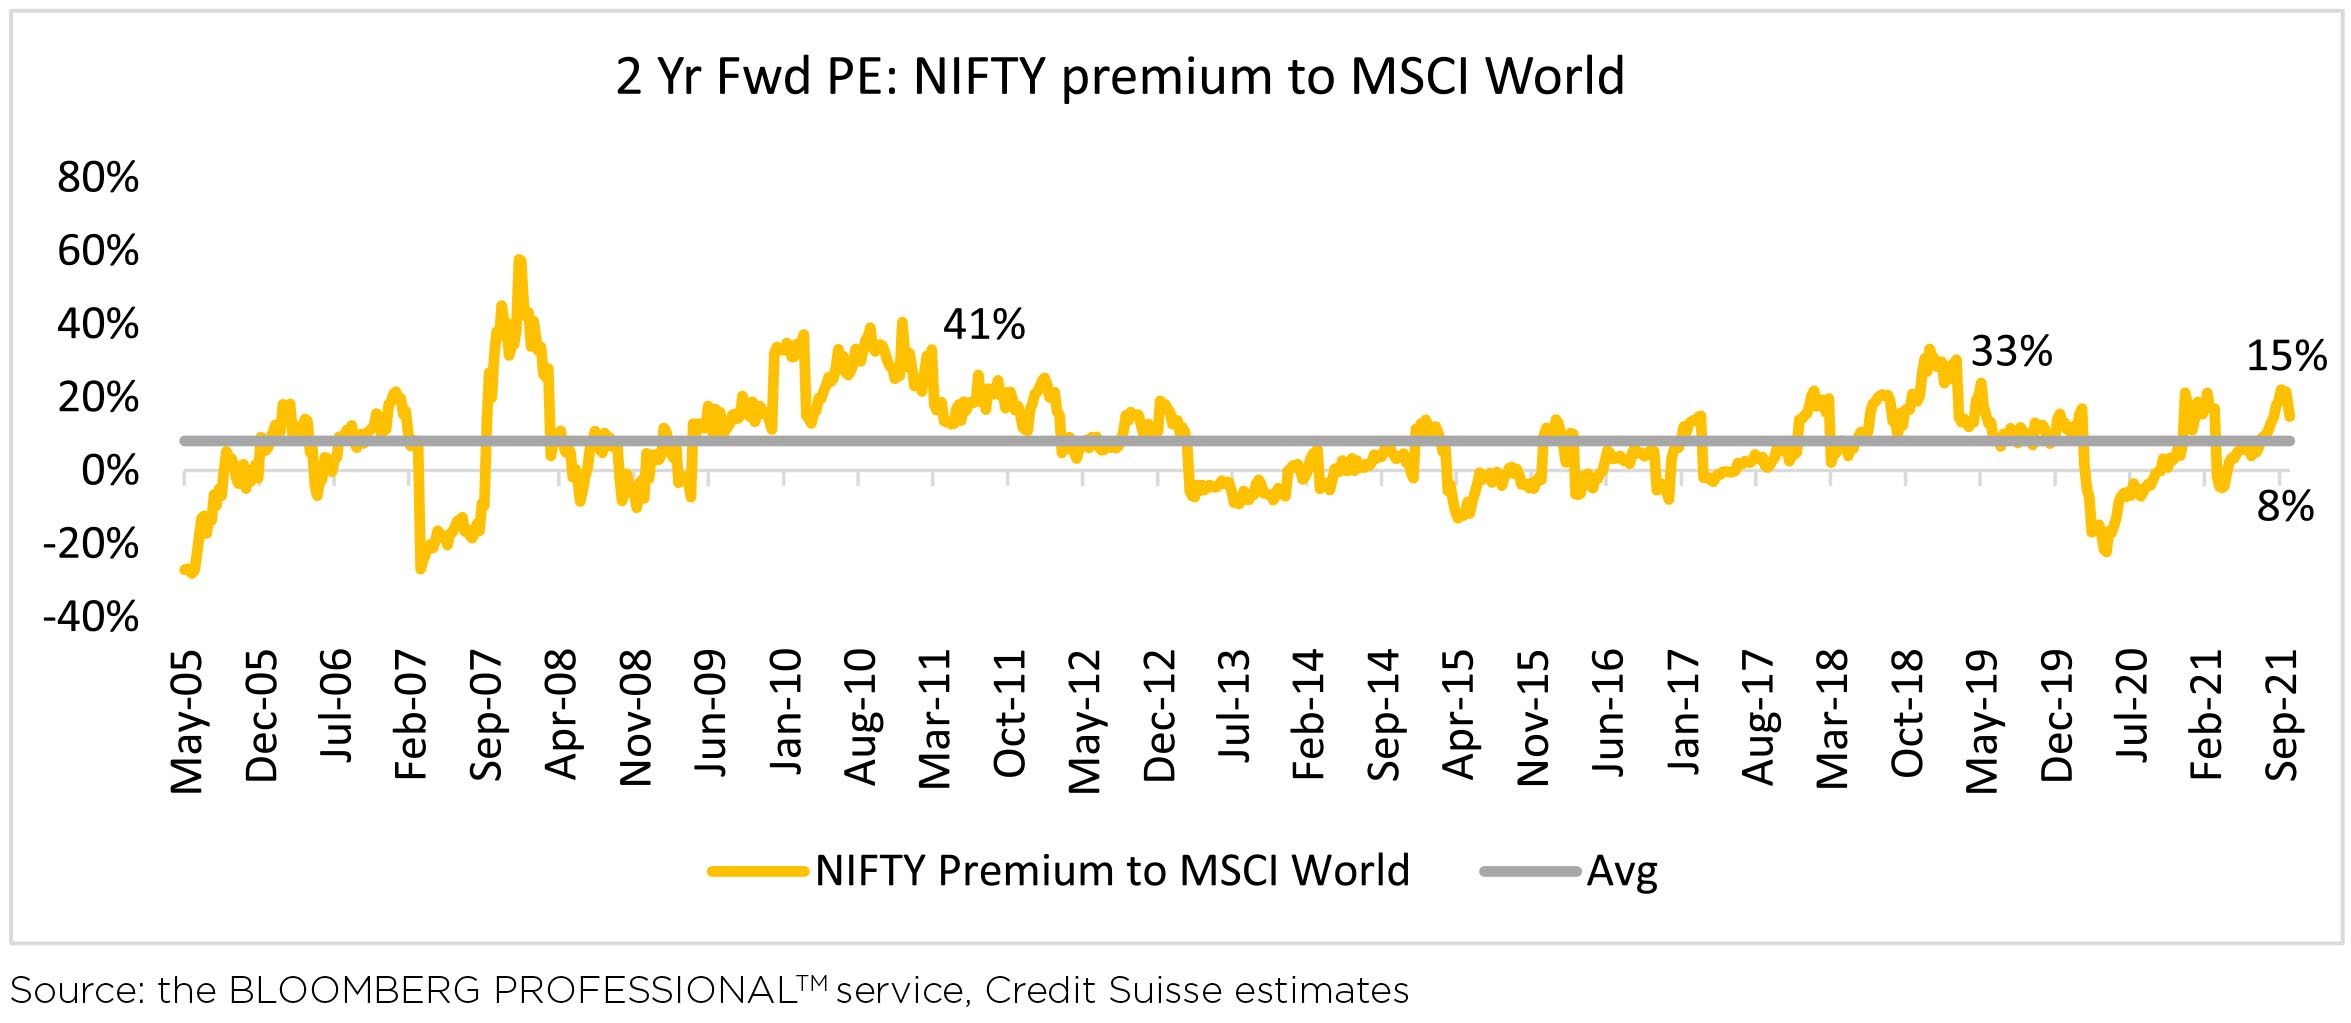
Indian markets have significantly outperformed global markets since the pandemic bottom. As a result, by the end of September, NIFTY was trading at a 22% premium (on a 2 Year Forward PE basis) to MSCI World, as compared to a historical average of 8% premium. The underperformance in October has corrected this to some extent, though NIFTY continues to trade at a 15% premium to global markets. The scope for valuation rerating driven market move is limited.
Interest Rates
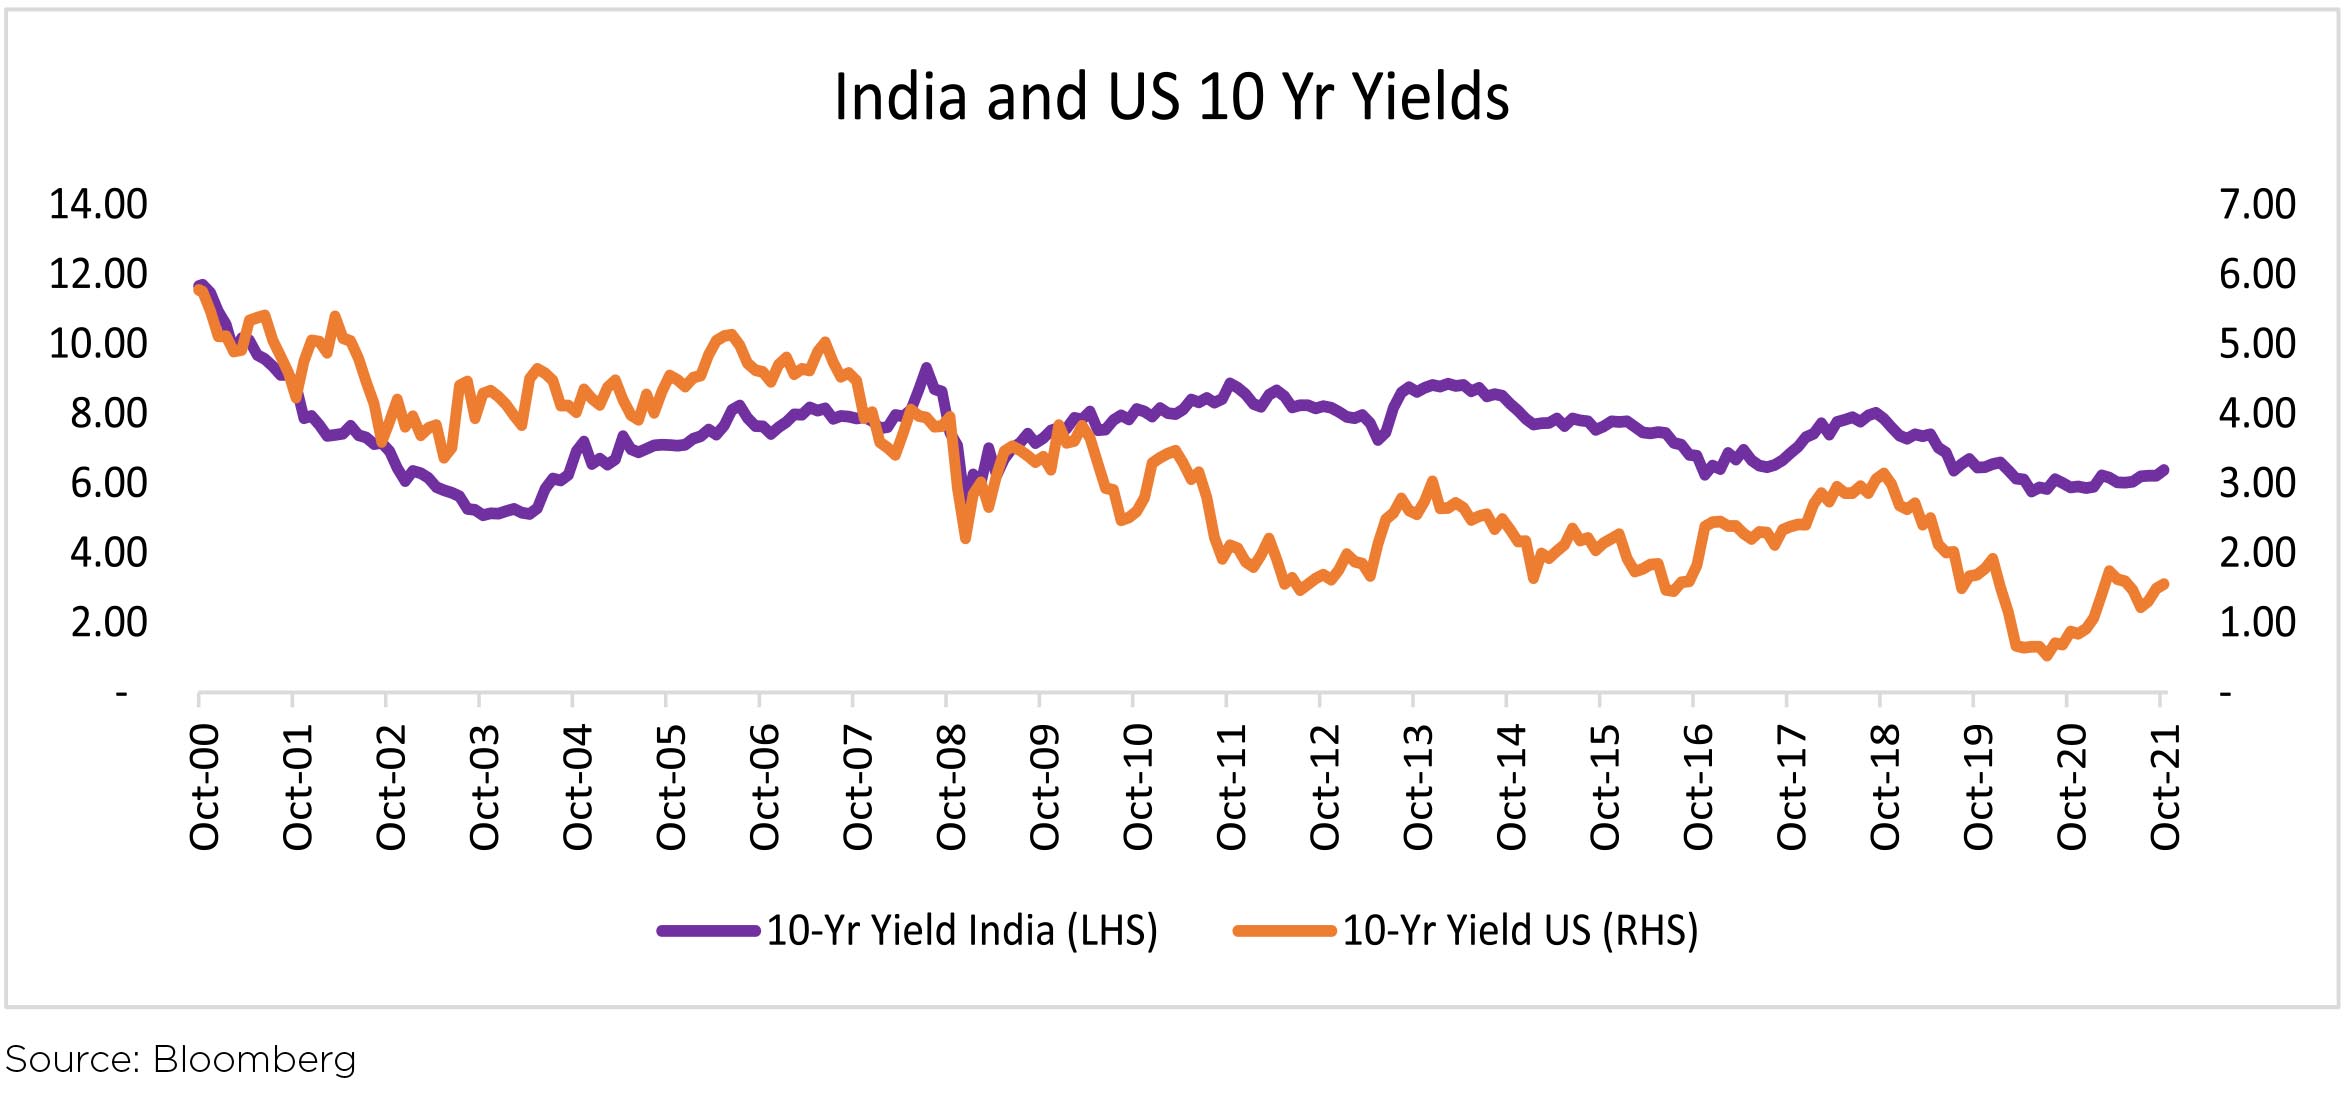
Interest Rates, both in India and globally are trending upwards on account of higher inflation and faster than expected economic recovery. US interest rates bottomed at 0.53% and are currently at 1.55%; whereas Indian yields bottomed at 5.84% and are currently at 6.39%. Higher interest rates are generally negative for Valuations.
Earnings
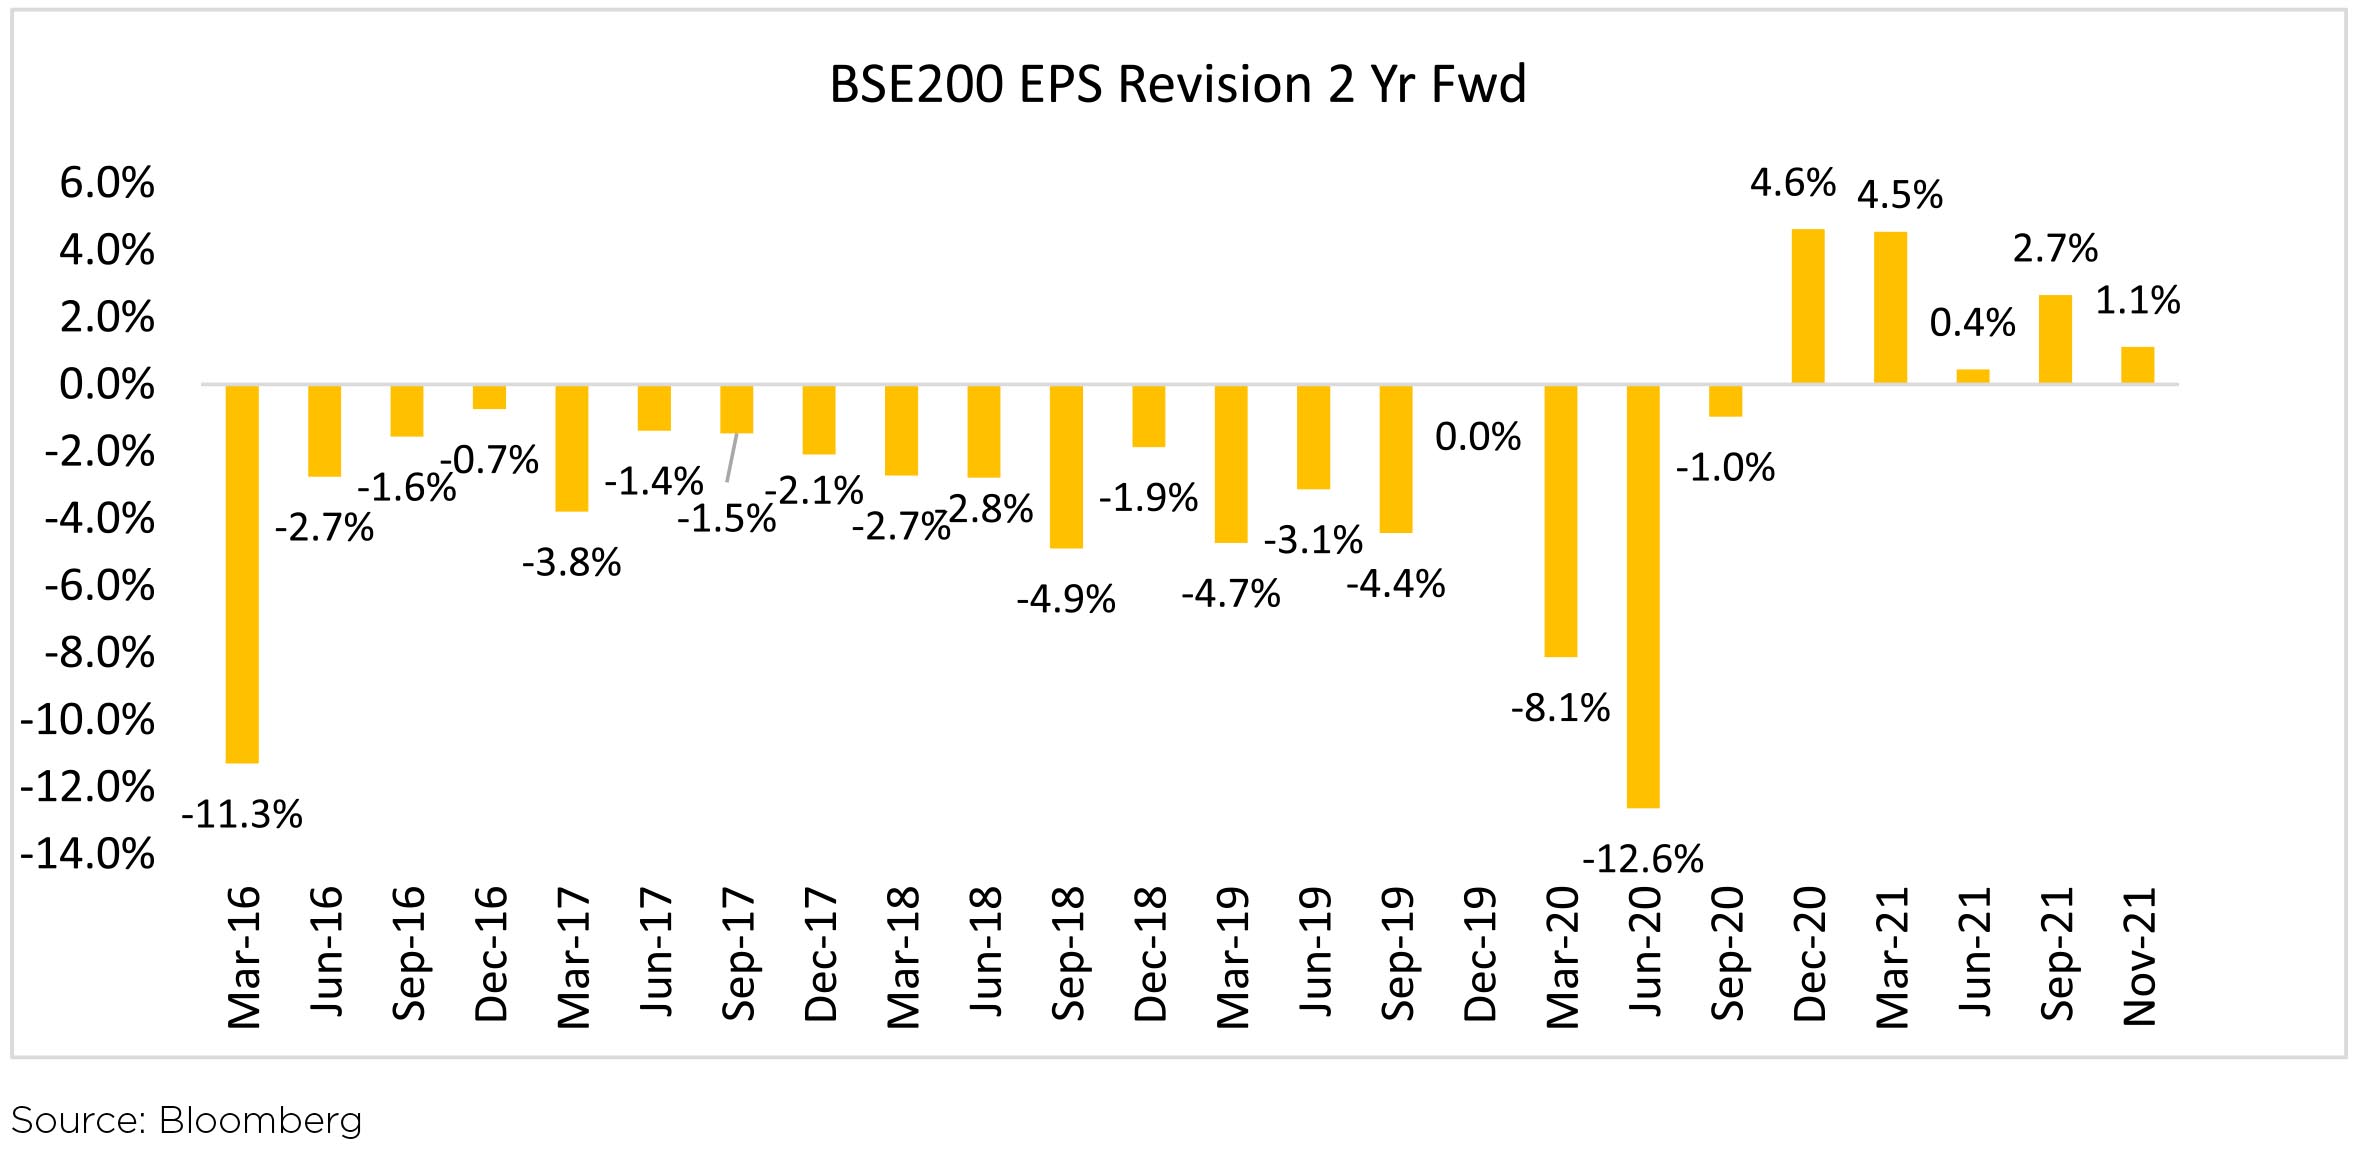
Earning is the key driver that can sustain markets at current levels and drive them higher. For the first time since the 2008 GFC, India has seen 4 consecutive quarters where BSE200 2-year Forward EPS has been upgraded. Even in November, despite the worries about inflation and lower demand, FY 23 earnings have seen a 1.1% upgrade from the end of the September quarter. Sustained momentum in earnings resulting in a cycle of earnings upgrades can help drives markets higher.
The markets are poised at an interesting juncture, will might of the flows overwhelm concerns regarding valuations? The recent bout of volatility shows how merciless the market can be. Stocks from their intraday highs have corrected more than 15-20% before swiftly recommencing their upward march. Brace yourself for more such volatility in the coming weeks, especially if key inflation indicators - crude oil, base metals, and even logistics, do not show signs of cooling off. Such a trend could also shape interest rate movement and policy of Central bankers as fears of "behind the curve" gain further credence. For equity investors, the next few weeks should be seen as a period to "digest" the outsize returns since Mar'20 and nothing more. Happy festival of lights and a prosperous Samvat 2078 ahead.
WHAT WENT BY
The last few weeks have been notable from a global rates environment standpoint, particularly in developed
markets. Markets across many such geographies have brought forward their expectations for interest rate
hikes, as unprecedented supply side shortages (including energy shocks) meet equally unprecedented
fiscal stimuli in some of these economies, thereby challenging the 'transitory' narrative on inflation.
Front end rates, which are most susceptible to interest rate hike expectations, had risen sharply in many
geographies as a result, more than doubling in some cases over this relatively brief span. Subsequently,
many developed market central banks stepped in to push against these rate hike expectations, even as
they are more willing to align with market expectations on their respective balance sheet expansions.
This push back was evident with central banks in Europe, UK, and Australia. The US Fed too continued to
delink taper from subsequent rate hikes even as it seemed more flexible in acknowledging the other side
of the debate on inflation. These developments led to some cooling off in developed market yields.
India was also influenced with these global goings on with yields, particularly on swaps, first rising and subsequently falling in line with these developments. An added dovish development was the long awaited cut in excise duties on petrol and diesel. Consumer Price Index (CPI) inflation was 4.3% y/y in September, down from 6.3% in May, as sequential momentum in food items continued to stay benign. Core inflation (headline CPI excluding food and beverages, fuel and light) momentum eased further but it stayed flat at 5.8% y/y in September and has remained sticky with an average of 5.9% since April 2021.
Central government tax revenue collected in September was strong, with net tax revenue picking up by 58.5% y/y. During H1, net tax revenue is 60% of FY22BE vs. 45% of actuals each in FY19 and FY20. Both revenue and capital expenditure picked up further in September but, during H1, is at 47% FY22BE vs. 56% of actuals each in FY19 and FY20. So, H1 fiscal deficit is 35% of FY22BE vs. 92% of actuals in FY19 and 70% in FY20. Further, small savings collection during H1 FY22 has been Rs. 22,000cr higher than that during the same period of last year. GST collection during the month of October was the second highest ever at Rs. 1.3 lakh crore and 23.7% y/y.
Industrial production (IP) growth for August was 11.9% y/y (11.5% in July) and -0.5% on a m/m seasonally adjusted (3.3% in July). Infrastructure Industries output (core IP), up 4.4% y/y and 0.3% m/m seasonally adjusted in September, witnessed coal, cement and electricity output falling sequentially.
Bank credit outstanding as on 22nd October was up 6.8% y/y, marginally higher than previous fortnightly readings. By sector, bank credit flow during September to services turned negative while it stayed positive for personal and improved for industries. During H1 of FY22, overall bank credit flow was negative to industries and services, while it was positive for agriculture and personal loans.
Merchandise trade deficit for October eased to USD 19.9bn from the sharply higher USD 22.6bn in September, but this was still above the USD 12.2bn average during July-August. Sequentially, exports improved by USD 1.7bn, oil imports eased partially by USD 3bn but non-oil-non-gold imports picked up further by USD 2bn in October.
Among high-frequency variables, some mobility indicators, GST e-way bills generated and motor vehicles registered sequentially picked up likely also due to the festive season. However, energy consumption level continued its fall since August due to the ongoing supply side issues.
In China, in line with the issues faced in the real estate sector and the power crunch, growth in land & property sales, government revenue, fixed asset investment and credit eased in September. Number of Covid cases in China also witnessed an increase in September. In the US, the Federal Open Market Committee (FOMC) last week announced the widely expected start of a moderation in the pace (taper) of its asset purchases and reiterated different and more stringent economic conditions (vs. conditions for taper) that would need to be met before raising interest rates. Sequential momentum in reopeningrelated US CPI drivers (e.g. used cars, lodging away from home) eased in September while food and housing were strong. US non-farm payroll addition in October was 531,000 (persons), up from August and September but well below the 1mn seen in July.
The European Central Bank (ECB) held its policy rates unchanged at its recent meeting. The Bank of England's Monetary Policy Committee also judged the existing monetary policy stance was appropriate and voted by a 7-2 majority to maintain the current policy rate.
The recent few weeks have been extremely volatile for global rates, especially in some key developed markets. India has had its rub-off as well, as should be expected since its hard to think about our markets in isolation. That said, the differentiator in our view is our more nuanced fiscal response and the laserfocus from RBI in accumulating a forex defense. While even this doesn't insulate us, it does provide certain more degrees of freedom to monetary policy. After the recent sharp rise in yields, and even accounting for some recent retracement, the interest rate swap market is no longer a cheap or effective way to hedge against the normalization already underway. For a variety of reasons mentioned in our earlier note ((https://idfcmf.com/article/6175), neither probably are long tenor floating rate instruments. At any rate liquidity in all sorts of floaters is fickle at best and hence these instruments can't be a very large exposure set for open ended funds.
Rather, and we come back to our favorite theme here, bar-belling may remain the best way to navigate these times. Thus intermediate maturity points can be clubbed with near cash to arrive at an appropriate average maturity. How intermediate the maturity and how near the cash will of course depend upon the mandate of the particular fund or risk profile since bar-belling can be done via various iterations. For longer horizons or more aggressive profiles, the view can be expressed as just a plain long position in intermediate maturity 4 - 6 years. More specifically, the naturally thought of defense of hiding in money markets may not work (as has already been the case for some time now) while floating rate (synthetic or natural) may no longer be as effective as the headline description may indicate.
Disclaimer: MUTUAL FUND INVESTMENTS ARE SUBJECT TO MARKET RISKS, READ ALL SCHEME RELATED DOCUMENTS CAREFULLY.
The Disclosures of opinions/in house views/strategy incorporated herein is provided solely to enhance the transparency about the investment strategy / theme of the Scheme and should not be treated as endorsement of the views / opinions or as an investment advice. This document should not be construed as a research report or a recommendation to buy or sell any security. This document has been prepared on the basis of information, which is already available in publicly accessible media or developed through analysis of IDFC Mutual Fund. The information/ views / opinions provided is for informative purpose only and may have ceased to be current by the time it may reach the recipient, which should be taken into account before interpreting this document. The recipient should note and understand that the information provided above may not contain all the material aspects relevant for making an investment decision and the security may or may not continue to form part of the scheme's portfolio in future. Investors are advised to consult their own investment advisor before making any investment decision in light of their risk appetite, investment goals and horizon. The decision of the Investment Manager may not always be profitable; as such decisions are based on the prevailing market conditions and the understanding of the Investment Manager. Actual market movements may vary from the anticipated trends. This information is subject to change without any prior notice. The Company reserves the right to make modifications and alterations to this statement as may be required from time to time. Neither IDFC Mutual Fund / IDFC AMC Trustee Co. Ltd./ IDFC Asset Management Co. Ltd nor IDFC, its Directors or representatives shall be liable for any damages whether direct or indirect, incidental, punitive special or consequential including lost revenue or lost profits that may arise from or in connection with the use of the information.
India was also influenced with these global goings on with yields, particularly on swaps, first rising and subsequently falling in line with these developments. An added dovish development was the long awaited cut in excise duties on petrol and diesel. Consumer Price Index (CPI) inflation was 4.3% y/y in September, down from 6.3% in May, as sequential momentum in food items continued to stay benign. Core inflation (headline CPI excluding food and beverages, fuel and light) momentum eased further but it stayed flat at 5.8% y/y in September and has remained sticky with an average of 5.9% since April 2021.
Central government tax revenue collected in September was strong, with net tax revenue picking up by 58.5% y/y. During H1, net tax revenue is 60% of FY22BE vs. 45% of actuals each in FY19 and FY20. Both revenue and capital expenditure picked up further in September but, during H1, is at 47% FY22BE vs. 56% of actuals each in FY19 and FY20. So, H1 fiscal deficit is 35% of FY22BE vs. 92% of actuals in FY19 and 70% in FY20. Further, small savings collection during H1 FY22 has been Rs. 22,000cr higher than that during the same period of last year. GST collection during the month of October was the second highest ever at Rs. 1.3 lakh crore and 23.7% y/y.
Industrial production (IP) growth for August was 11.9% y/y (11.5% in July) and -0.5% on a m/m seasonally adjusted (3.3% in July). Infrastructure Industries output (core IP), up 4.4% y/y and 0.3% m/m seasonally adjusted in September, witnessed coal, cement and electricity output falling sequentially.
Bank credit outstanding as on 22nd October was up 6.8% y/y, marginally higher than previous fortnightly readings. By sector, bank credit flow during September to services turned negative while it stayed positive for personal and improved for industries. During H1 of FY22, overall bank credit flow was negative to industries and services, while it was positive for agriculture and personal loans.
Merchandise trade deficit for October eased to USD 19.9bn from the sharply higher USD 22.6bn in September, but this was still above the USD 12.2bn average during July-August. Sequentially, exports improved by USD 1.7bn, oil imports eased partially by USD 3bn but non-oil-non-gold imports picked up further by USD 2bn in October.
Among high-frequency variables, some mobility indicators, GST e-way bills generated and motor vehicles registered sequentially picked up likely also due to the festive season. However, energy consumption level continued its fall since August due to the ongoing supply side issues.
In China, in line with the issues faced in the real estate sector and the power crunch, growth in land & property sales, government revenue, fixed asset investment and credit eased in September. Number of Covid cases in China also witnessed an increase in September. In the US, the Federal Open Market Committee (FOMC) last week announced the widely expected start of a moderation in the pace (taper) of its asset purchases and reiterated different and more stringent economic conditions (vs. conditions for taper) that would need to be met before raising interest rates. Sequential momentum in reopeningrelated US CPI drivers (e.g. used cars, lodging away from home) eased in September while food and housing were strong. US non-farm payroll addition in October was 531,000 (persons), up from August and September but well below the 1mn seen in July.
The European Central Bank (ECB) held its policy rates unchanged at its recent meeting. The Bank of England's Monetary Policy Committee also judged the existing monetary policy stance was appropriate and voted by a 7-2 majority to maintain the current policy rate.
Outlook
The recent few weeks have been extremely volatile for global rates, especially in some key developed markets. India has had its rub-off as well, as should be expected since its hard to think about our markets in isolation. That said, the differentiator in our view is our more nuanced fiscal response and the laserfocus from RBI in accumulating a forex defense. While even this doesn't insulate us, it does provide certain more degrees of freedom to monetary policy. After the recent sharp rise in yields, and even accounting for some recent retracement, the interest rate swap market is no longer a cheap or effective way to hedge against the normalization already underway. For a variety of reasons mentioned in our earlier note ((https://idfcmf.com/article/6175), neither probably are long tenor floating rate instruments. At any rate liquidity in all sorts of floaters is fickle at best and hence these instruments can't be a very large exposure set for open ended funds.
Rather, and we come back to our favorite theme here, bar-belling may remain the best way to navigate these times. Thus intermediate maturity points can be clubbed with near cash to arrive at an appropriate average maturity. How intermediate the maturity and how near the cash will of course depend upon the mandate of the particular fund or risk profile since bar-belling can be done via various iterations. For longer horizons or more aggressive profiles, the view can be expressed as just a plain long position in intermediate maturity 4 - 6 years. More specifically, the naturally thought of defense of hiding in money markets may not work (as has already been the case for some time now) while floating rate (synthetic or natural) may no longer be as effective as the headline description may indicate.
Disclaimer: MUTUAL FUND INVESTMENTS ARE SUBJECT TO MARKET RISKS, READ ALL SCHEME RELATED DOCUMENTS CAREFULLY.
The Disclosures of opinions/in house views/strategy incorporated herein is provided solely to enhance the transparency about the investment strategy / theme of the Scheme and should not be treated as endorsement of the views / opinions or as an investment advice. This document should not be construed as a research report or a recommendation to buy or sell any security. This document has been prepared on the basis of information, which is already available in publicly accessible media or developed through analysis of IDFC Mutual Fund. The information/ views / opinions provided is for informative purpose only and may have ceased to be current by the time it may reach the recipient, which should be taken into account before interpreting this document. The recipient should note and understand that the information provided above may not contain all the material aspects relevant for making an investment decision and the security may or may not continue to form part of the scheme's portfolio in future. Investors are advised to consult their own investment advisor before making any investment decision in light of their risk appetite, investment goals and horizon. The decision of the Investment Manager may not always be profitable; as such decisions are based on the prevailing market conditions and the understanding of the Investment Manager. Actual market movements may vary from the anticipated trends. This information is subject to change without any prior notice. The Company reserves the right to make modifications and alterations to this statement as may be required from time to time. Neither IDFC Mutual Fund / IDFC AMC Trustee Co. Ltd./ IDFC Asset Management Co. Ltd nor IDFC, its Directors or representatives shall be liable for any damages whether direct or indirect, incidental, punitive special or consequential including lost revenue or lost profits that may arise from or in connection with the use of the information.


