IDFC Arbitrage Fund
An open ended scheme investing in arbitrage opportunities

IDFC Arbitrage Fund
An open ended scheme investing in arbitrage opportunities.
|
|
|
|
|

|


Category: Arbitrage
 : ₹ 6,843.04 Crores
AUM or assets under management refers to the recent / updated cumulative market value of investments managed by a mutual fund or any investment firm.
: ₹ 6,704.41 Crores
AUM or assets under management refers to the recent / updated cumulative market value of investments managed by a mutual fund or any investment firm.
:
An employee of the asset management company such as a mutual fund or life insurer, who manages investments of the scheme. He is usually part of a larger team of fund managers and research analysts.
Debt Portion: Mr. Harshal Joshi (w.e.f. 20th October 2016)
Other Parameter:
| Beta
Beta is a measure of an investment's volatility vis-a-vis the market. Beta of less than 1 means that the security will be less volatile than the market. A beta of greater than 1 implies that the security's price will be more volatile than the market. | 0.67 |
| R Square | 0.61 |
| Standard Deviation (Annualized)
Standard deviation is a statistical measure of the range of an investment's performance. When a mutual fund has a high standard deviation, its means its range of performance is wide, implying greater volatility. | 0.82% |
| Sharpe*
The Sharpe Ratio, named after its founder, the Nobel Laureate William Sharpe, is a measure of risk-adjusted returns. It is calculated using standard deviation and excess return to determine reward per unit of risk. | 1.92 |
| Portfolio Turnover | |
| Equity | 2.62 |
| Aggregate^ | 13.30 |
| Total Expense Ratio | |
| Regular | 1.03% |
| Direct | 0.35% |
SIP (Minimum Amount): ₹ 100/-
SIP Frequency: Monthly
SIP Dates (Monthly): Investor may choose any day of the month except 29th, 30th and 31st as the date of instalment.
Investment Objective: Click here
Minimum Investment Amount : ₹ 100/- and any amount thereafter
Option Available: Growth, IDCW@ - (Payout, Reinvestment and Sweep (from Equity Schemes to Debt Schemes only)) - Monthly & Annual
:
Exit load is charged at the time an investor redeems the units of a mutual fund. The exit load is deducted from the prevailing NAV at the time of redemption. For instance, if the NAV is ₹ 100 and the exit load is 1%, the redemption price would be ₹ 99 per unit.
(w.e.f 01st July 2016)
NAV (₹) as on August 31, 2021
| Regular Plan | Growth | 25.9371 |
| Regular Plan | Monthly IDCW@ | 12.9253 |
| Regular Plan | Annual IDCW@ | 10.7007 |
| Name | Industries | % of NAV |
| Adani Ports and Special Economic Zone | Transportation | 3.54% |
| ITC | Consumer Non Durables | 3.15% |
| Vedanta | Non - Ferrous Metals | 2.76% |
| HDFC Life Insurance Company | Insurance | 2.04% |
| Tata Power Company | Power | 1.97% |
| JSW Steel | Ferrous Metals | 1.92% |
| Tata Steel | Ferrous Metals | 1.83% |
| Bandhan Bank | Banks | 1.79% |
| ICICI Bank | Banks | 1.70% |
| Hero MotoCorp | Auto | 1.64% |
| NMDC | Minerals/Mining | 1.54% |
| Kotak Mahindra Bank | Banks | 1.48% |
| Larsen & Toubro | Construction Project | 1.45% |
| Jindal Steel & Power | Ferrous Metals | 1.43% |
| The Federal Bank | Banks | 1.37% |
| Zee Entertainment Enterprises | Entertainment | 1.35% |
| Tata Chemicals | Chemicals | 1.35% |
| LIC Housing Finance | Finance | 1.23% |
| Cadila Healthcare | Pharmaceuticals | 1.23% |
| Adani Enterprises | Minerals/Mining | 1.22% |
| Sun Pharmaceutical Industries | Pharmaceuticals | 1.22% |
| Bajaj Finance | Finance | 1.14% |
| State Bank of India | Banks | 1.13% |
| Apollo Hospitals Enterprise | Healthcare Services | 1.10% |
| Cholamandalam Invt and Fin Co | Finance | 0.97% |
| National Aluminium Company | Non - Ferrous Metals | 0.94% |
| ACC | Cement & Cement Products | 0.91% |
| Bank of Baroda | Banks | 0.90% |
| Tata Motors | Auto | 0.90% |
| RBL Bank | Banks | 0.85% |
| Maruti Suzuki India | Auto | 0.83% |
| Muthoot Finance | Finance | 0.75% |
| Shriram Transport Finance Company | Finance | 0.72% |
| Biocon | Pharmaceuticals | 0.64% |
| Escorts | Auto | 0.63% |
| United Spirits | Consumer Non Durables | 0.61% |
| Nestle India | Consumer Non Durables | 0.58% |
| Siemens | Industrial Capital Goods | 0.58% |
| Exide Industries | Auto Ancillaries | 0.54% |
| UPL | Pesticides | 0.49% |
| Bajaj Auto | Auto | 0.47% |
| Canara Bank | Banks | 0.44% |
| Max Financial Services | Insurance | 0.41% |
| Steel Authority of India | Ferrous Metals | 0.40% |
| Tech Mahindra | Software | 0.39% |
| Pidilite Industries | Chemicals | 0.38% |
| Power Grid Corporation of India | Power | 0.35% |
| Asian Paints | Consumer Non Durables | 0.33% |
| Granules India | Pharmaceuticals | 0.33% |
| Bharat Petroleum Corporation | Petroleum Products | 0.32% |
| Indus Towers | Telecom - Services | 0.32% |
| Sun TV Network | Entertainment | 0.31% |
| SBI Life Insurance Company | Insurance | 0.30% |
| Infosys | Software | 0.29% |
| HCL Technologies | Software | 0.28% |
| M&M Financial Services | Finance | 0.27% |
| Petronet LNG | Gas | 0.27% |
| Bharat Heavy Electricals | Industrial Capital Goods | 0.27% |
| DLF | Construction | 0.26% |
| L&T Finance Holdings | Finance | 0.26% |
| Hindustan Petroleum Corporation | Petroleum Products | 0.25% |
| Oil & Natural Gas Corporation | Oil | 0.25% |
| Grasim Industries | Cement & Cement Products | 0.25% |
| Bata India | Consumer Durables | 0.25% |
| Aurobindo Pharma | Pharmaceuticals | 0.24% |
| Torrent Pharmaceuticals | Pharmaceuticals | 0.23% |
| Ashok Leyland | Auto | 0.23% |
| Marico | Consumer Non Durables | 0.23% |
| Voltas | Consumer Durables | 0.23% |
| Indraprastha Gas | Gas | 0.23% |
| Deepak Nitrite | Chemicals | 0.22% |
| Apollo Tyres | Auto Ancillaries | 0.22% |
| MindTree | Software | 0.20% |
| HDFC Bank | Banks | 0.20% |
| Tata Consultancy Services | Software | 0.20% |
| Amara Raja Batteries | Auto Ancillaries | 0.20% |
| Dabur India | Consumer Non Durables | 0.18% |
| Punjab National Bank | Banks | 0.18% |
| Colgate Palmolive (India) | Consumer Non Durables | 0.17% |
| HDFC Asset Management Company | Capital Markets | 0.17% |
| Mahindra & Mahindra | Auto | 0.16% |
| Divi's Laboratories | Pharmaceuticals | 0.16% |
| GAIL (India) | Gas | 0.15% |
| Manappuram Finance | Finance | 0.14% |
| ICICI Lombard General Insurance Company | Insurance | 0.14% |
| Bharat Forge | Industrial Products | 0.13% |
| SRF | Chemicals | 0.13% |
| Name | Industries | % of NAV |
| REC | Finance | 0.11% |
| Info Edge (India) | Retailing | 0.11% |
| Nippon Life India Asset Management | Capital Markets | 0.11% |
| Torrent Power | Power | 0.10% |
| Axis Bank | Banks | 0.10% |
| Cummins India | Industrial Products | 0.09% |
| Berger Paints (I) | Consumer Non Durables | 0.09% |
| Coal India | Minerals/Mining | 0.08% |
| Alembic Pharmaceuticals | Pharmaceuticals | 0.08% |
| Mahanagar Gas | Gas | 0.08% |
| Piramal Enterprises | Finance | 0.08% |
| Reliance Industries | Petroleum Products | 0.08% |
| Coromandel International | Fertilisers | 0.08% |
| IndusInd Bank | Banks | 0.07% |
| HDFC | Finance | 0.07% |
| Strides Pharma Science | Pharmaceuticals | 0.07% |
| Bosch | Auto Ancillaries | 0.07% |
| PI Industries | Pesticides | 0.06% |
| United Breweries | Consumer Non Durables | 0.06% |
| NTPC | Power | 0.06% |
| L&T Technology Services | Software | 0.05% |
| Titan Company | Consumer Durables | 0.05% |
| ICICI Prudential Life Insurance Company | Insurance | 0.05% |
| MRF | Auto Ancillaries | 0.05% |
| Astral | Industrial Products | 0.05% |
| TVS Motor Company | Auto | 0.05% |
| Larsen & Toubro Infotech | Software | 0.05% |
| Dr. Reddy's Laboratories | Pharmaceuticals | 0.04% |
| UltraTech Cement | Cement & Cement Products | 0.04% |
| Glenmark Pharmaceuticals | Pharmaceuticals | 0.04% |
| City Union Bank | Banks | 0.04% |
| Coforge | Software | 0.04% |
| Bharti Airtel | Telecom - Services | 0.04% |
| Power Finance Corporation | Finance | 0.04% |
| Balkrishna Industries | Auto Ancillaries | 0.04% |
| The Indian Hotels Company | Leisure Services | 0.04% |
| Oracle Financial Services Software | Software | 0.03% |
| Hindalco Industries | Non - Ferrous Metals | 0.03% |
| Page Industries | Textile Products | 0.03% |
| Lupin | Pharmaceuticals | 0.03% |
| Pfizer | Pharmaceuticals | 0.03% |
| Jubilant Foodworks | Leisure Services | 0.03% |
| Indian Oil Corporation | Petroleum Products | 0.03% |
| Aditya Birla Fashion and Retail | Retailing | 0.03% |
| Tata Consumer Products | Consumer Non Durables | 0.02% |
| Metropolis Healthcare | Healthcare Services | 0.02% |
| Gujarat Gas | Gas | 0.02% |
| Godrej Consumer Products | Consumer Non Durables | 0.02% |
| Alkem Laboratories | Pharmaceuticals | 0.02% |
| Indian Railway Catering And Tourism Corporation | Transportation | 0.01% |
| Havells India | Consumer Durables | 0.01% |
| Bajaj Finserv | Insurance | 0.01% |
| Indian Energy Exchange | Capital Markets | 0.01% |
| Wipro | Software | 0.01% |
| The Ramco Cements | Cement & Cement Products | 0.01% |
| PVR | Entertainment | 0.01% |
| Shree Cement | Cement & Cement Products | 0.01% |
| Hindustan Unilever | Consumer Non Durables | 0.01% |
| Bharat Electronics | Aerospace & Defense | 0.01% |
| Britannia Industries | Consumer Non Durables | 0.01% |
| Godrej Properties | Construction | 0.01% |
| Trent | Retailing | 0.01% |
| Cipla | Pharmaceuticals | 0.01% |
| Navin Fluorine International | Chemicals | 0.01% |
| AU Small Finance Bank | Banks | 0.01% |
| Multi Commodity Exchange of India | Capital Markets | 0.004% |
| Ambuja Cements | Cement & Cement Products | 0.002% |
| Container Corporation of India | Transportation | 0.002% |
| Total Hedged Equity | 67.24% | |
| Treasury Bill | 17.74% | |
| Government Bond | 1.20% | |
| Corporate Bond | 0.73% | |
| PTC^ | 0.62% | |
| Zero Coupon Bond | 0.02% | |
| Mutual Fund Units | ||
| IDFC Cash Fund | 5.83% | |
| Net Cash and Cash Equivalent | 6.63% | |
| Grand Total | 100.00% | |
| ^First Business Receivables Trust- wt. avg. mat: 1.75 years (PTC originated by Reliance Industries Limited) | ||
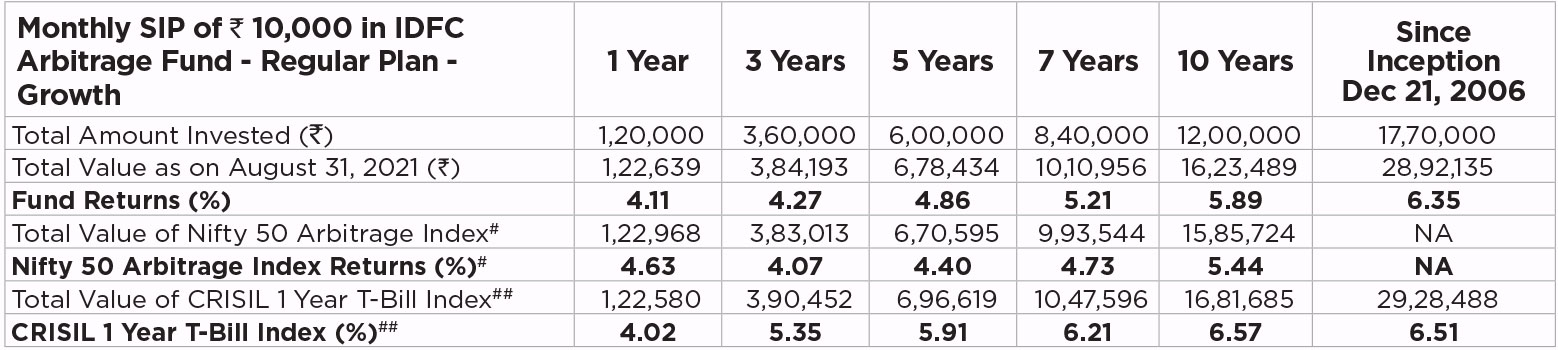
Past performance may or may not be sustained in future.IDCW@ are assumed to be reinvested and bonus is adjusted. Load is not taken into consideration. To illustrate the advantages of SIP investment, this is how your investment would have grown if you had invested say ₹10,000 systematically on the first business Day of every month over a period of time. Returns are calculated by using XIRR approach. XIRR helps in calculating return on investment given an initial and final value and a series of cash inflows and outflows with the correct allowance for the time impact of the transactions. Data as on 31st August 2021
| Banks | 10.25% |
| Finance | 5.78% |
| Ferrous Metals | 5.58% |
| Consumer Non Durables | 5.46% |
| Auto | 4.92% |
| Pharmaceuticals | 4.38% |
| Non - Ferrous Metals | 3.73% |
| Transportation | 3.56% |
| Insurance | 2.95% |
| Minerals/Mining | 2.84% |
| Power | 2.48% |
| Chemicals | 2.08% |
| Entertainment | 1.67% |
| Software | 1.54% |
| Construction Project | 1.45% |
| Cement & Cement Products | 1.22% |
| Healthcare Services | 1.12% |
| Auto Ancillaries | 1.11% |
| Industrial Capital Goods | 0.85% |
| Gas | 0.75% |
| Petroleum Products | 0.68% |
| Pesticides | 0.56% |
| Consumer Durables | 0.54% |
| Telecom - Services | 0.36% |
| Capital Markets | 0.29% |
| Industrial Products | 0.27% |
| Construction | 0.27% |
| Oil | 0.25% |
| Retailing | 0.14% |
| Fertilisers | 0.08% |
| Leisure Services | 0.06% |
| Textile Products | 0.03% |
| Aerospace & Defense | 0.01% |
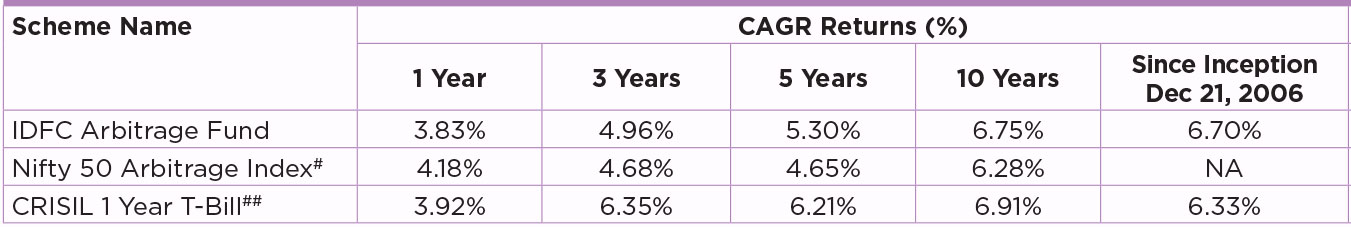
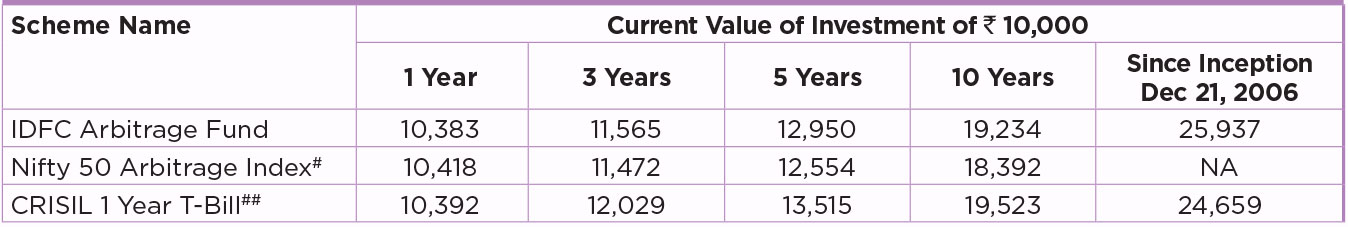
Performance based on NAV as on 31/08/2021. Past performance may or may not be sustained in future.
The performances given are of regular plan growth option.
Click here for other funds managed by the fund manager and refer to the respective fund pages
#Benchmark Returns. ##Alternate Benchmark Returns.
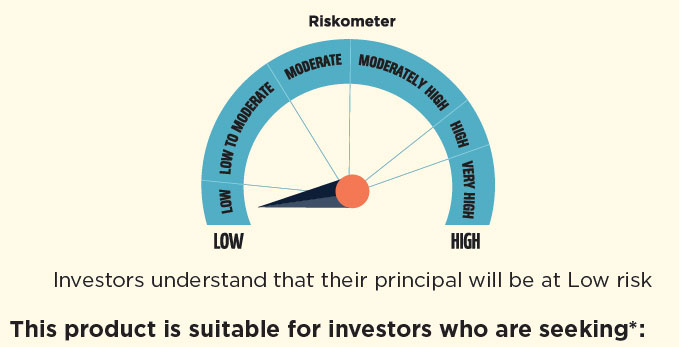
- To generate low volatility returns over short to medium term.
- Investments predominantly in arbitrage opportunities in the cash and derivative segments of the equity markets with balance exposure in debt and money market instruments.
* Investors should consult their financial advisers if in doubt about whether the product is suitable for them.
Regular and Direct Plans have different expense structure. Direct Plan shall have a lower expense ratio excluding distribution expenses, commission expenses etc.
*Risk-free rate assumed to be 3.38% (FBIL OVERNIGHT MIBOR as on 31st August 2021). Ratios calculated on the basis of 3 years history of monthly data.
^Portfolio Turnover ratio is calculated as Lower of purchase or sale during the period / Average AUM for the last one year (includes Fixed Income securities and Equity derivatives).
