Commentary
31st August 2021
Commentary
31st August 2021|
|
|
|
|

|


GLOBAL MARKETS
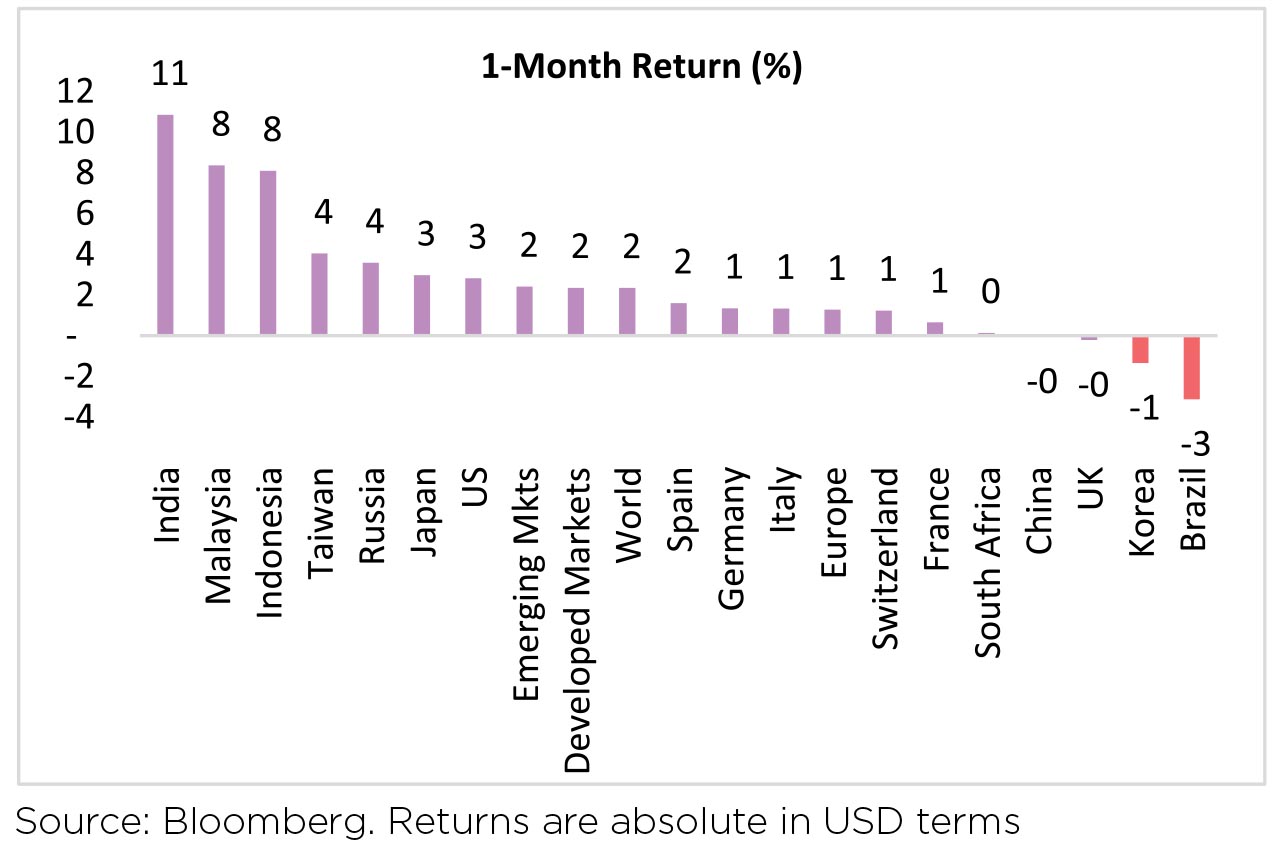
Global equities had a strong run-up of 2.4%
in August. Strong growth, solid earnings
surprises and Fed's accommodative stance
have led global equities higher. Chinese
equities remained flat led by weakness
in July activity data and continued
regulatory overhang. In Emerging Markets,
cyclical sectors focusing on reopening and
reflation shall outperform as both valuation
and positioning are supportive, given their
underperformance vs Developed Markets.
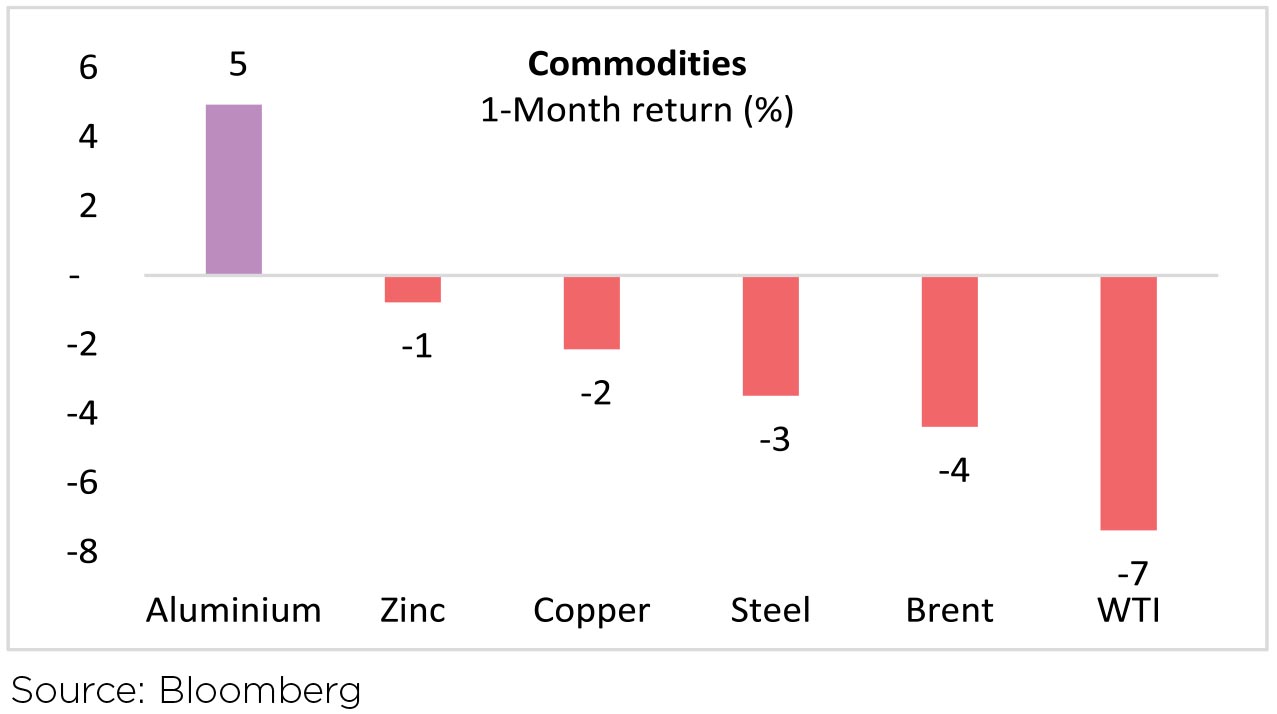
Brent and Commodities: Oil prices extended the wobble that began in early July, shedding 5.5% to near USD 71/bbl in August as the delta variant spreads through Asia and the peak travel season is winding down in the Northern Hemisphere. Agri-pricing (a global and significant part of the domestic basket) continues to be supportive and agri-exports momentum sustains after a strong FY21 (y-o-y up by 17%).
Currency:: INR ended at ~73.01 per USD, up 1.9% in August. DXY rose a modest 0.5% over the month.
Domestic Markets
MSCI India was up 8.8% over the month. Indian markets are enjoying a considerable bull run, with Nifty50 closing above 17,000 levels at month-end. YTD, Indian equities are up 20%+ led by global tide and liquidity.
Strong fiscal support, decent macro prints, the big IPO rush, and progressing vaccination drive have underpinned investor sentiments.
Mid-caps were up 2%, underperforming large caps in August.
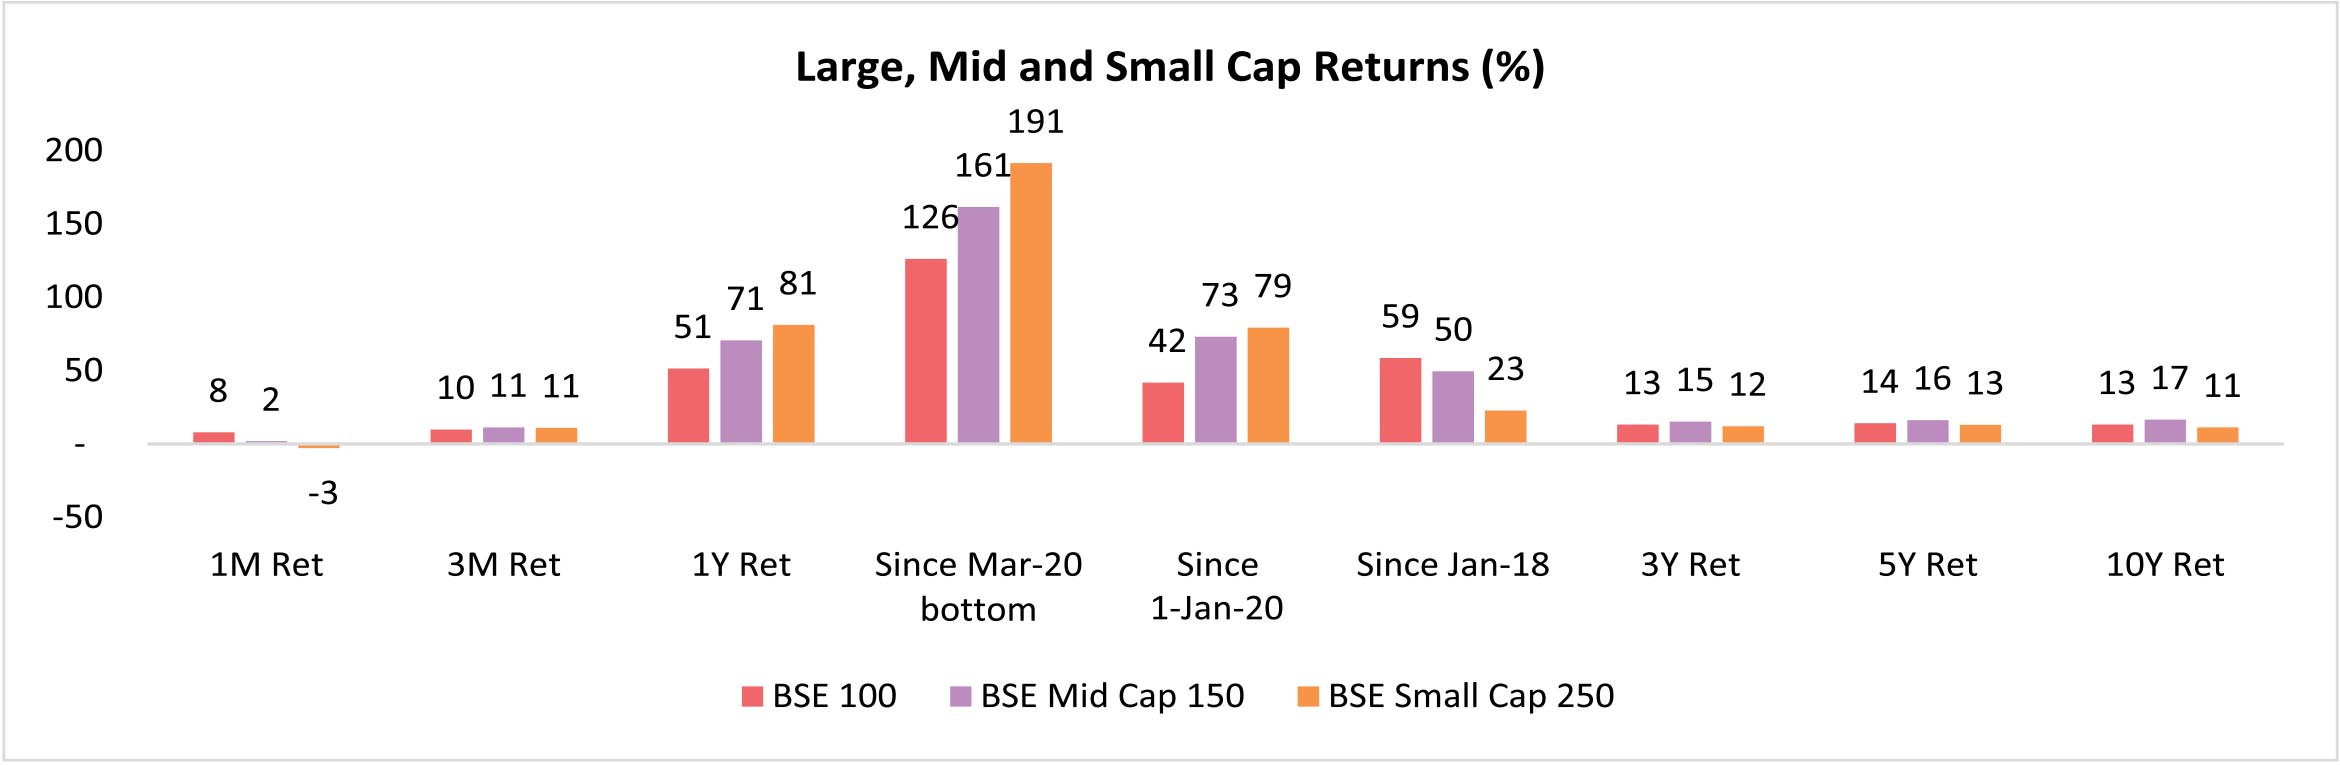
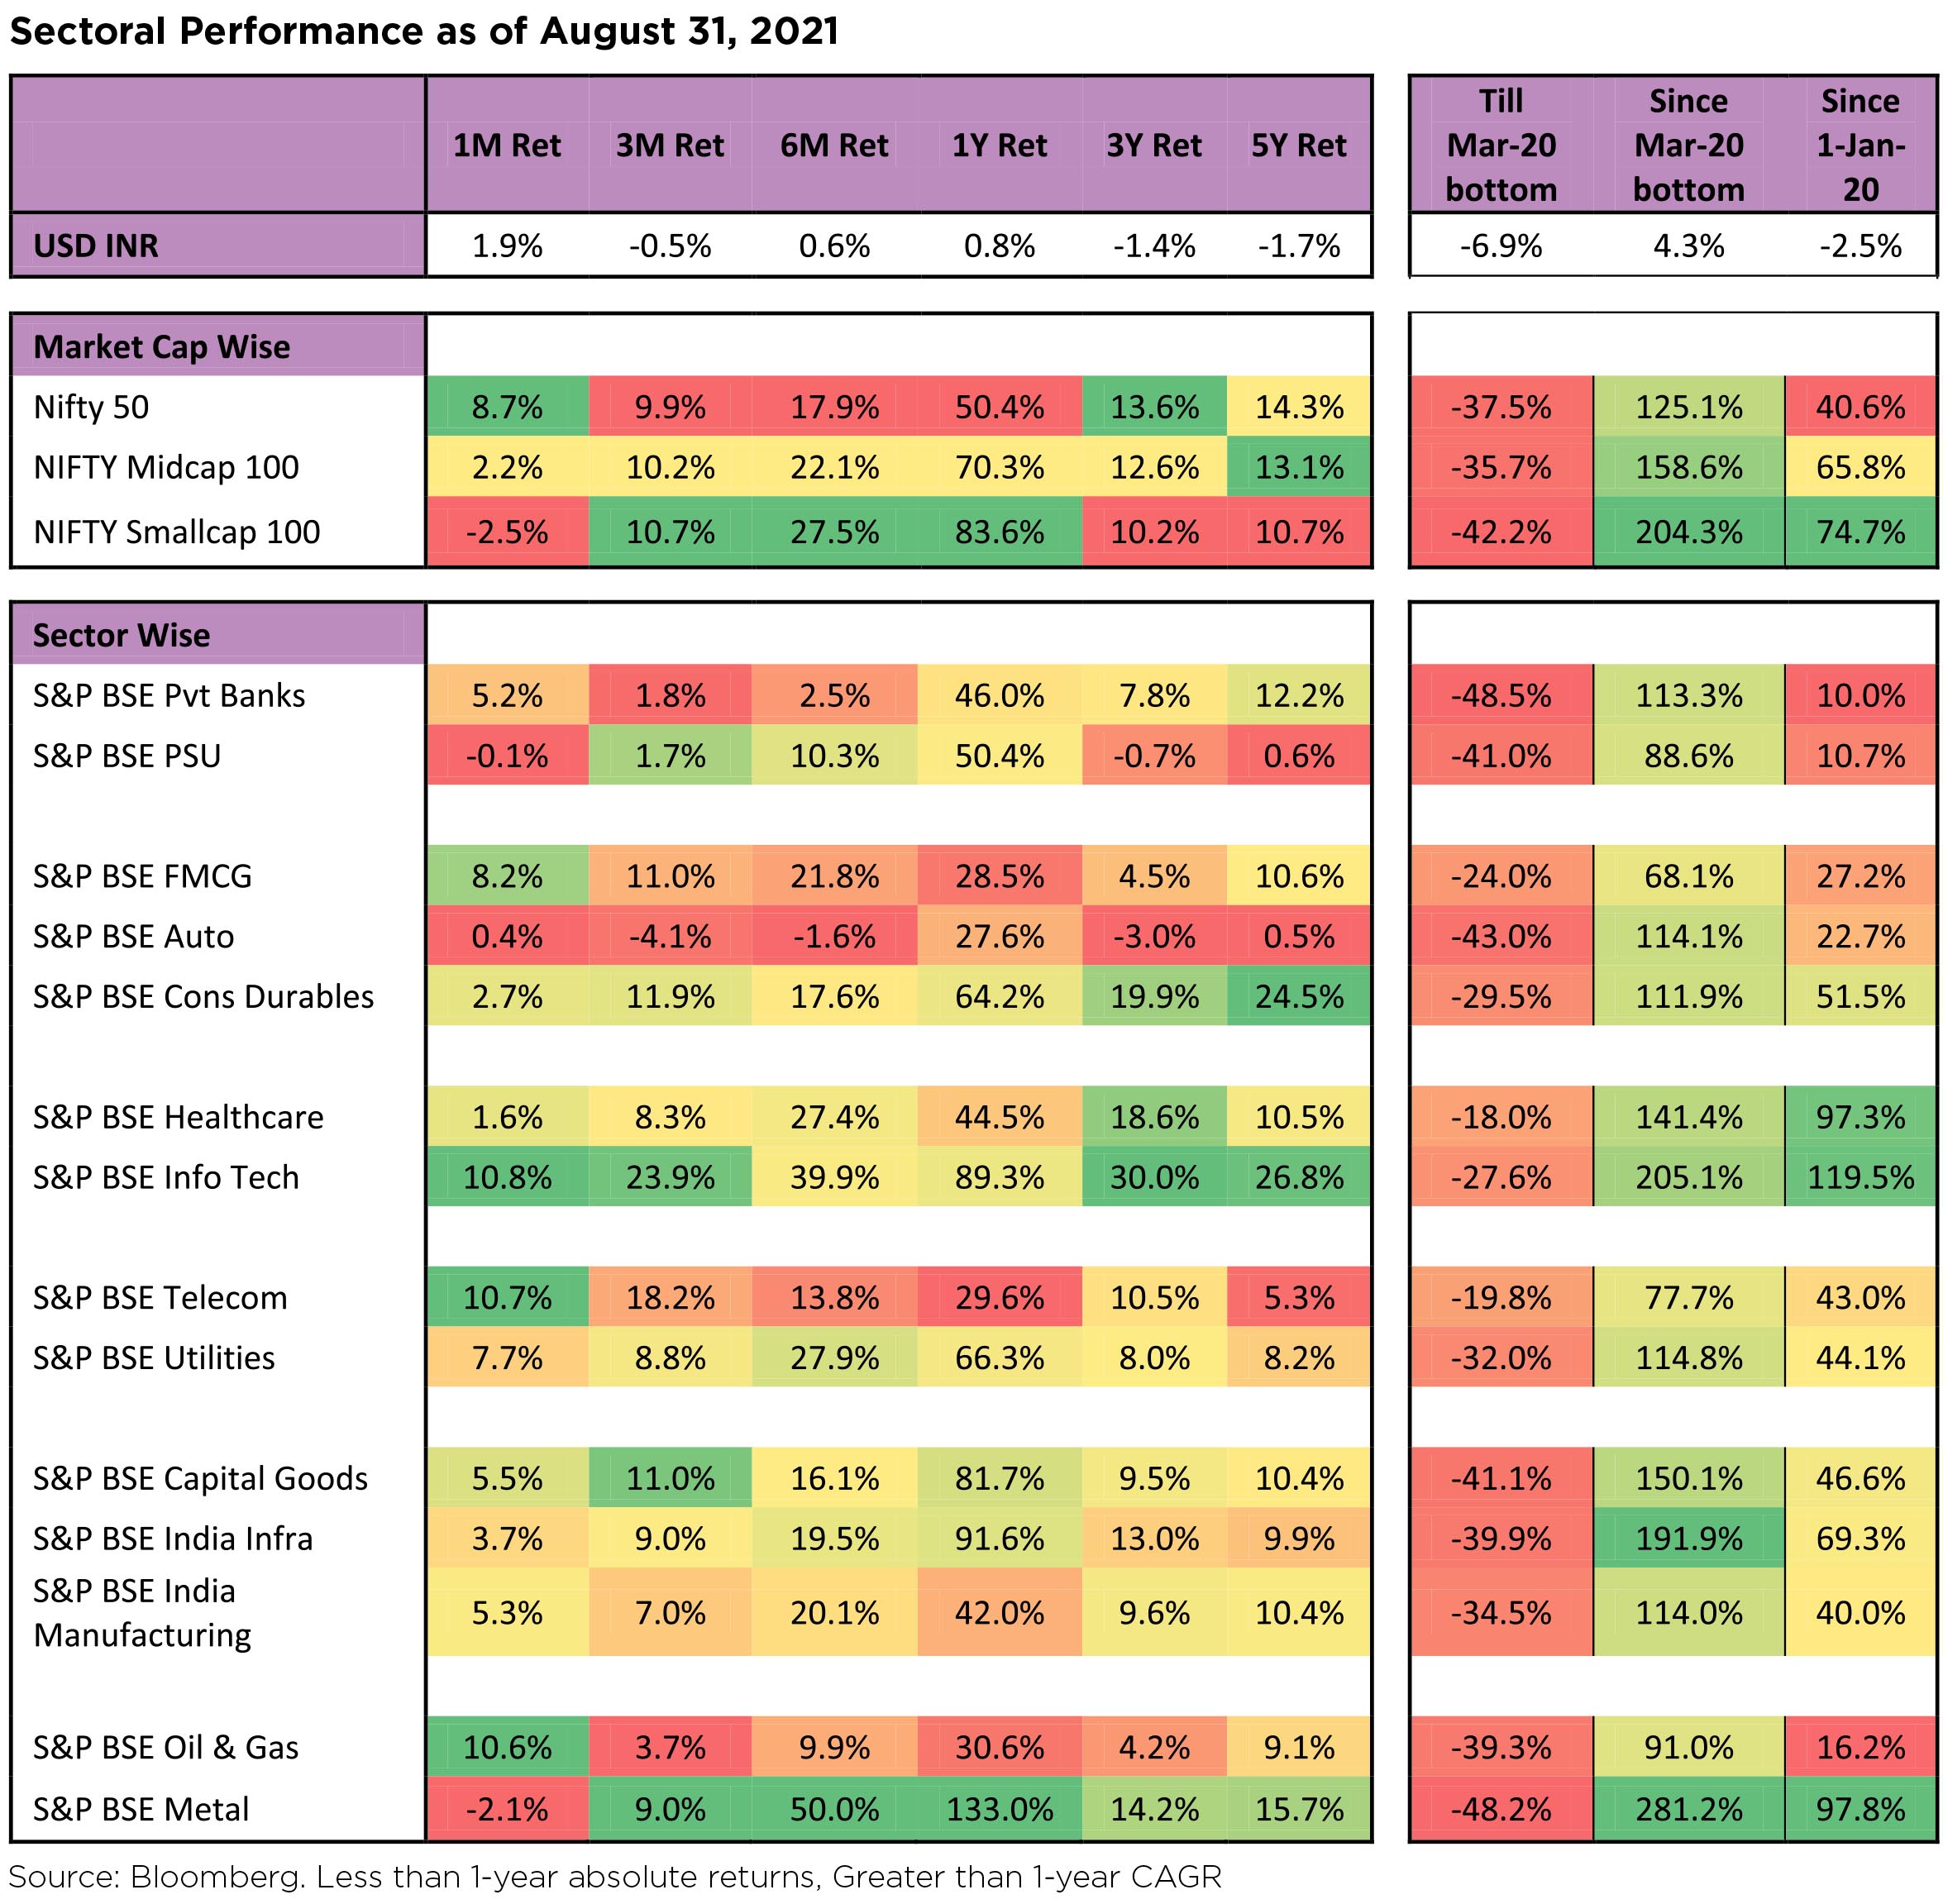
Source: Bloomberg. Less than 1-year absolute returns, Greater than 1-year CAGR. The above graph is for representation purposes only and should not be used for the development or implementation of an investment strategy. Past performance may or may not be sustained in the future.
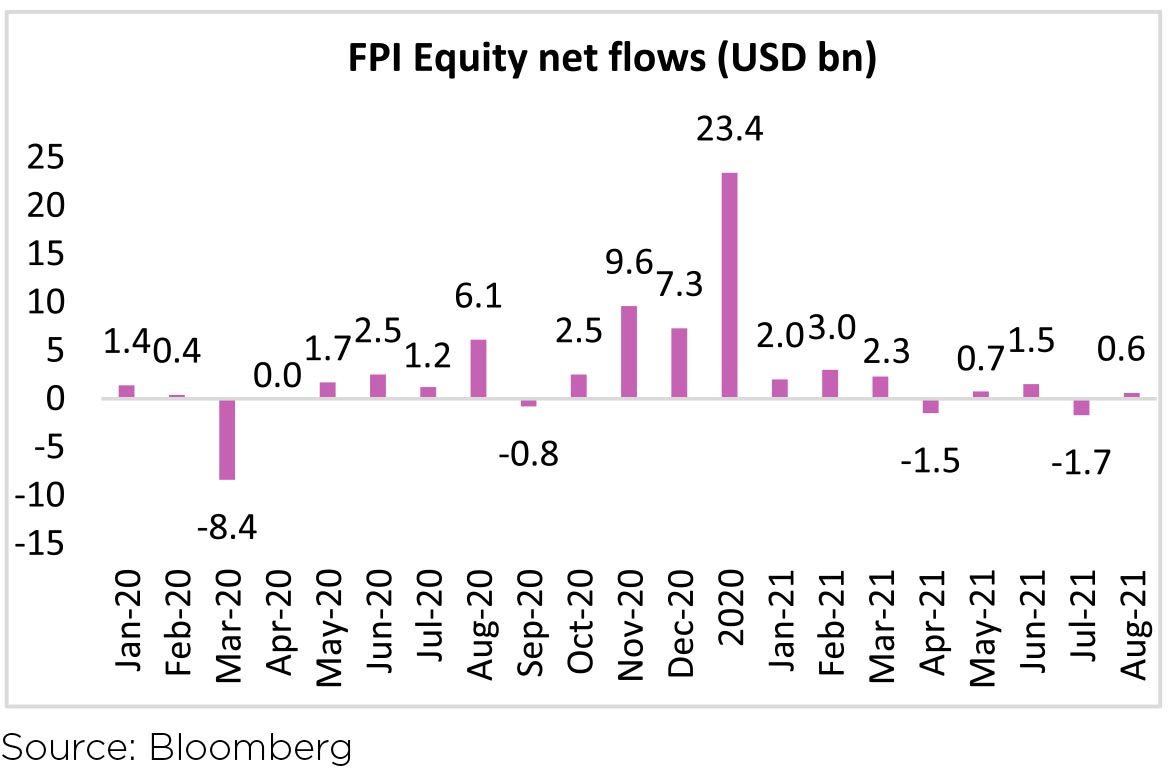
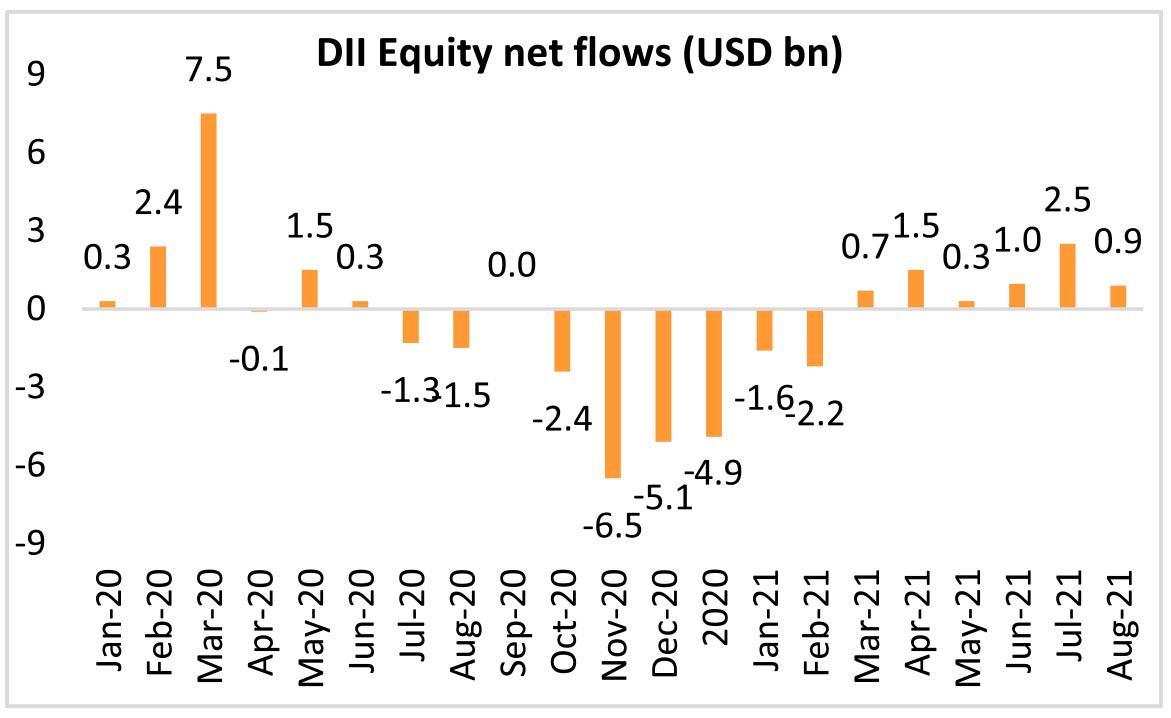
Institutional flows: FIIs turned to net buyers of Indian equities (+USD628mn, following -USD1.7bn in July). DIIs remained big net equity buyers for the sixth month running (+USD930mn, vs +USD2.5bn in July). Mutual funds were net equity buyers at USD1.4bn while insurance funds sold USD521mn of equities in August.
Q1FY22 Earnings
June-quarter results were strong (benefitting from the lower base last year), but reflected increasing
margin pressure and moderation in top-line momentum.The BSE All Cap index (864 stocks) delivered 166% y-o-y growth in adjusted profits in 1QFY22 - in part due to favorable base effects from 2020. Close to 45% of y-o-y growth was on account of materials companies. 1QFY22 earnings across Financials had higher slippages driven by the retail sector especially secured retail (mortgages, CV/CE) and to some extent in the SME space. For IT, revenue beats returned in the June quarter, but margins missed for the first time in five quarters from a spike in attrition that drove subcontracting, backfilling, hiring and retention costs.
Sectoral Impact
By sector, IT Services, Telecom, and Oil & Gas outperformed while Materials, Auto and Health Care were notable laggards in August.
The push-in IT services was so strong that even the unexpected INR strengthening during the last days of August/ early days of September didn't seem to have any impact on the underlying sentiments for the favoured sector. It was the sector of the month.
The Macro Picture
► Decent 1QFY21 GDP growth of 20.8% though on a lower base. The growth was mainly led by export demand. However, we are still not at pre-pandemic levels for most sectors.
► Both manufacturing and services PMIs bounced back in July; and
► CPI inflation gapped down to 5.6% in July.
► June IP (industrial production) disappoints but still tracking a smaller contraction.
► Total daily Covid-19 cases count stopped falling (at ~32k per day mark) and now averages 42k/day.
► India's Forex (FX) reserves are close to their all-time peak, standing at USD 617bn currently. FX reserves have increased by USD5.7bn in the last 4 weeks.
► GST collections grew 30% y-o-y in August (INR1.12tn, from INR 1.16tn in July). This was the 10th consecutive month with INR1tn+ collections (exception of June 2021).
► The fiscal deficit for 1QFY21 was INR3.21tn or 21.3% of the budgeted FY22 deficit (at INR15.1tn or 6.8% of GDP). The July trade deficit printed at USD11bn, widening in June on the back of gold imports.
Other Updates
• The government announced a multi-year asset monetization plan to monetize INR6tn of revenuegenerating brownfield infrastructure assets over 4 years to generate resources to plough into greenfield physical and social infrastructure.
• Monsoon: Though at end of Aug 2021, rainfall was 9% lower than normal, IMD has stated normal monsoon expectations in September at 110% of long-period-average (LPA). This shall reduce the deficit to just 4% of LPA. Kharif sowing has gone well and compared to the last 5-year average, it is up by 2%, while on a y-o-y high base, it is down by 1.8%.
• Aviation: Airlines will be able to sell seats up to 72.5% of their capacity, up from 65%. The ministry also increased the minimum and maximum limits on fares.
• US Fed chairman indicated that the Fed would start reducing the pace of asset purchases this year if the economic conditions evolve as expected.
Outlook
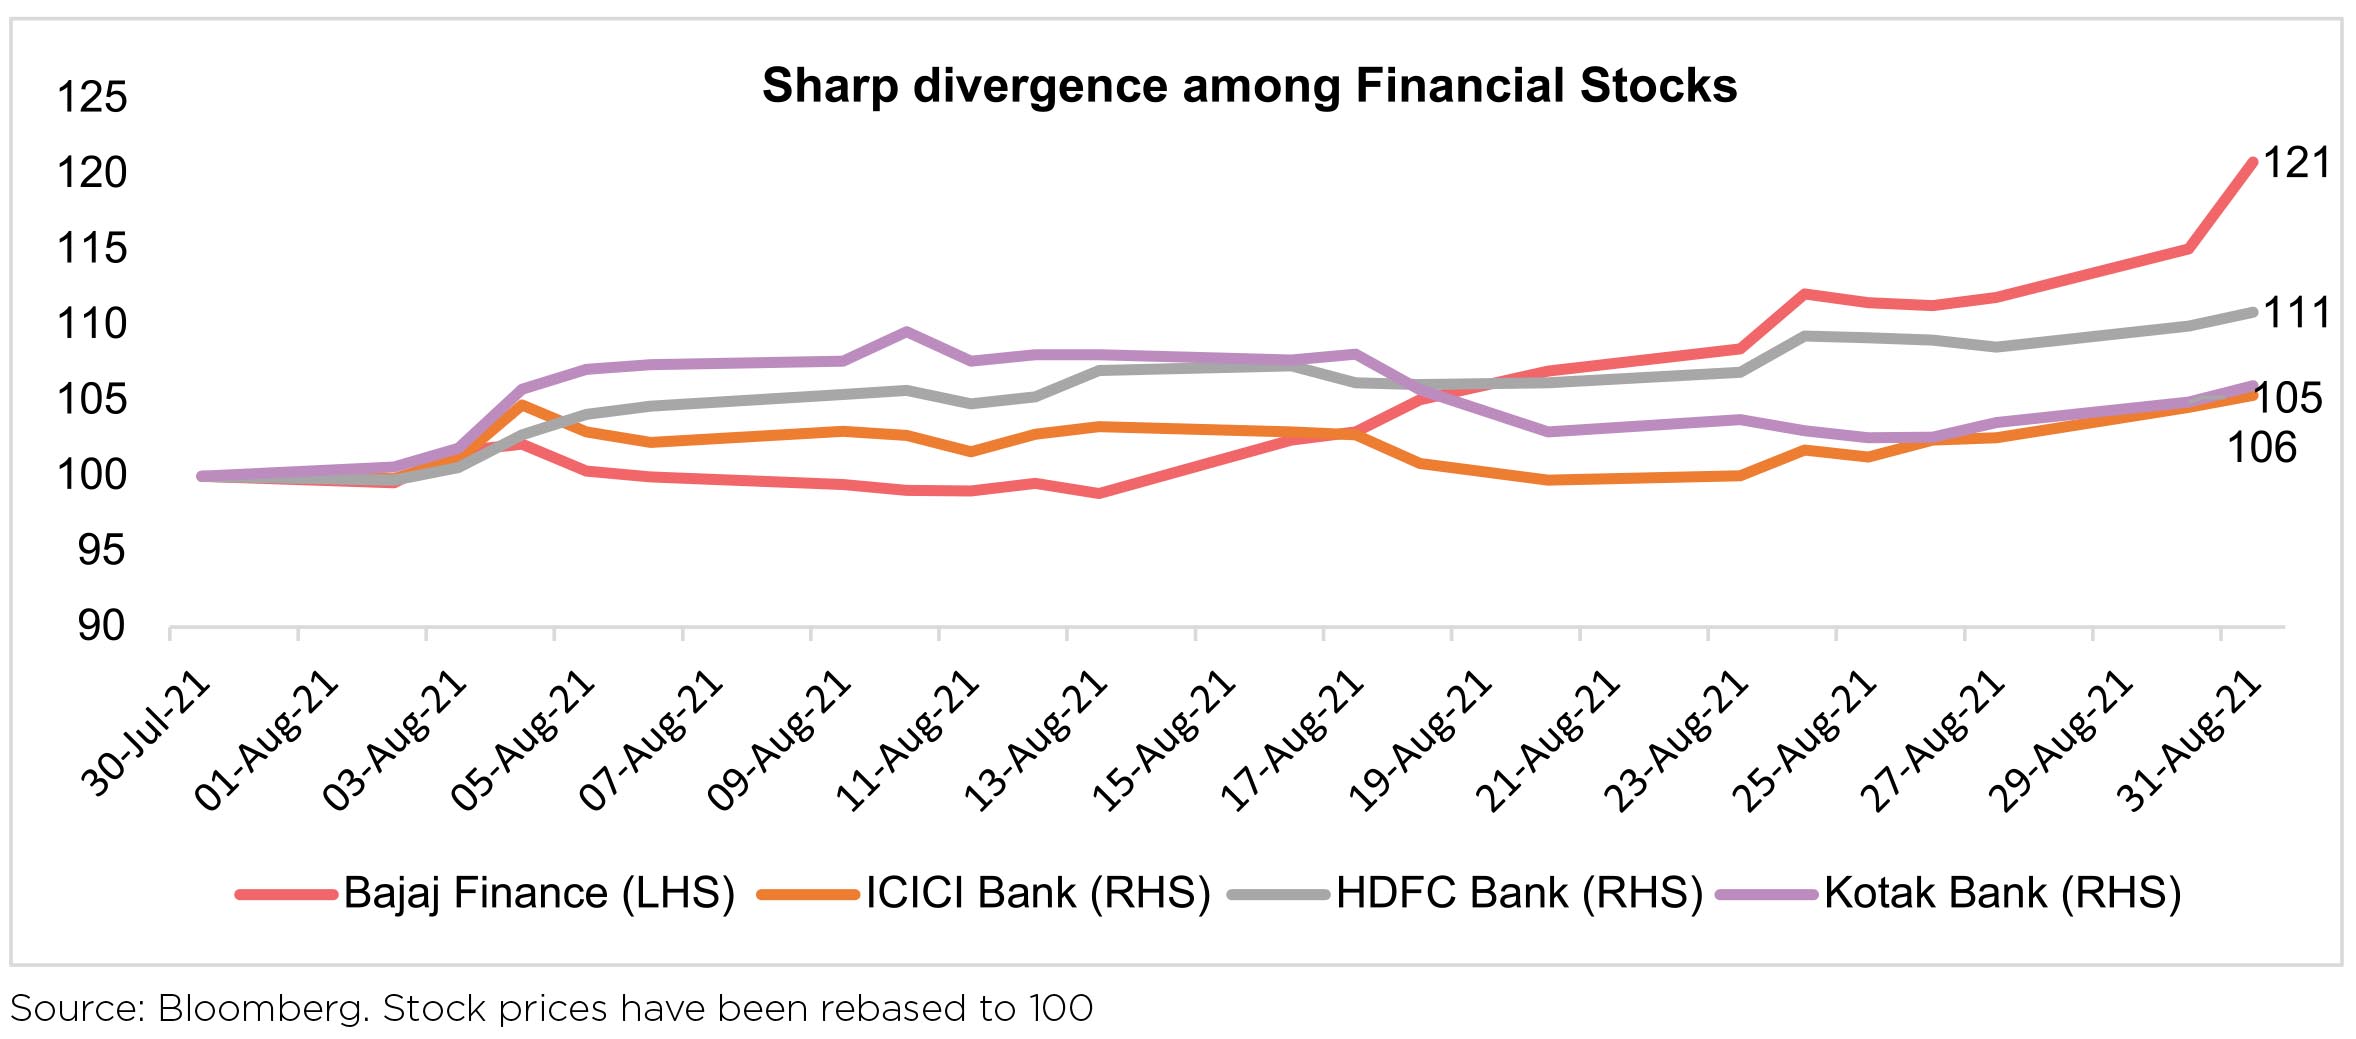
After almost 17 months of "serendipity", the broader market was trumped by Nifty during August. Narrowness in stock gainers was prominent, larger stocks within a sector did better than smaller ones. Quality regained premium, especially mid-month onwards, best highlighted by this chart - Bajaj Finance v/s ICICI Bank; HDFC Bank and Kotak from Aug 14th to Aug 31st.
On the macro front, a keenly awaited speech of US Federal Reserve Chairman Jerome Powell at the Jackson Hole conference was dovish enough, at least for the Indian markets! Global markets collectively, breathed a huge sigh of relief on the dovish commentary of Fed Chair Powell - even leading to INR gaining strength against USD. RBI Governor also reiterated similarly dovish comments on tightening in India in an interview with media immediately after the Jackson Hole event. Leading to the Jackson Hole speech, momentum had been built by experts' "screech" in the US and India, of the need to temper the loose monetary policies being followed by the US as well as India. No wonder, the equity markets were a bit shaky leading up to the event. Now there seems to be greater clarity… at least till the calendar yearend of tapering to be off the table.
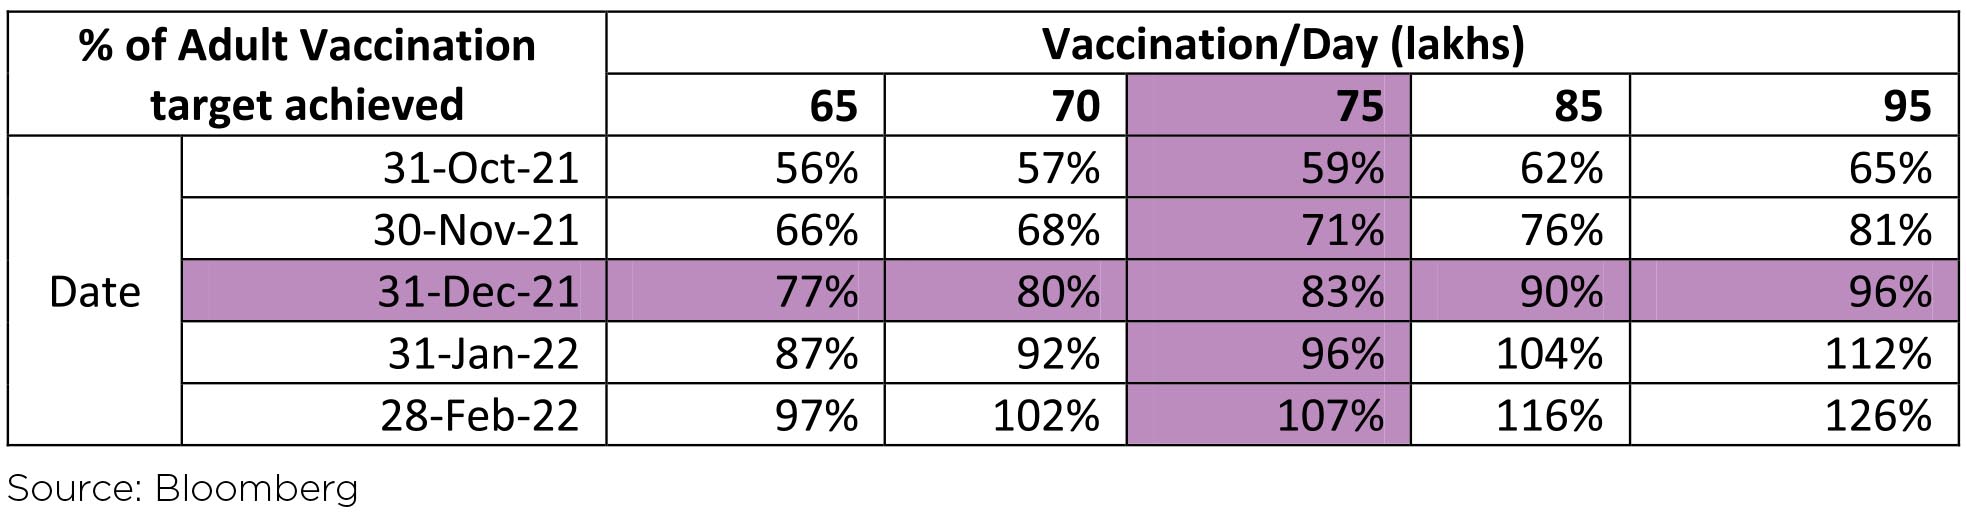
April-June 2021 GDP data was announced on Sept 2, a clear indicator, of the level of positivity it would bring! GDP growth after the tumultuous -23.8% decline in the previous year Apr-Jun 2020 - reported a growth of 20.8%, higher than the most pessimistic estimates at ~18%. The Second Wave's impact on the economy, which was at mend in April 2021, thankfully, has been much lower than what was earlier feared. The revival has been stronger and faster than many critics' forecast. If the pace of vaccination sustains, the table below highlights various levels of adults who will get vaccinated by the year-end. As such a 3rd wave could be less impactful than the 2nd wave as would be the impact on the economy.
| Adult population (cr) | 94 |
| Doses Required (cr) | 188 |
| Current doses (cr) | 65 |
| As of | 31-Aug |
Apr-June quarterly numbers were not as strong as Q4FY21 but were decidedly better than Q1 FY21 on a y-o-y basis. Across sectors, gross margins were impacted by higher Raw Material costs, strong focus on cost-cutting boosted EBIDTA growth. Inflation pressure on IMC was evident, though in most cases, the pace of increase has flattened with some signals of retracing. Sales growth will be the driver of future profit growth rather than additional cost-cutting which was evident in FY21.
For investors, will August be a trailer of what to expect - Nifty outperforming Mid and Small caps or was it just a momentary blip? A focus on macros, especially global will gain more traction going ahead. Currently, the Indian economy's macro is far superior to May-Sept 2013, while facing the "original" taper tantrums. Indian equity markets escaping unscathed during such an event does not appear to be a completely realistic thought. Indian markets will get caught in the turmoil of tapering whenever it commences. However, India joining an unsavoury "club" - remember Fragile Five, appears to have a low possibility. So, markets may be shaken but not roiled by the "taper".
WHAT WENT BY
The minutes of the Monetary Policy Committee's (MPC) August meeting detailed the nascent nature of
the recent economic recovery, the considerable slack that still exists, supply-side driven and likely-to-be
transitory nature of inflation and thus the need to continue to support the economy through congenial
financial conditions. However, Prof. Jayanth R. Varma, who had voted against the decision to continue with
the accommodative stance, expressed his disagreement with the current low level of the reverse repo and
thus the need to gradually normalise the width of the policy corridor given rising inflationary pressures
and the better suitability of targeted fiscal measures as the pandemic's time horizon is lengthening.
With RBI focusing more on orderly evolution of yield curve, we continued to see minimal intervention by RBI at the 10-year space. With increased liquidity and markets pushing back on rate hike expectation on account of dovish policy statements, the 5-year segment has seen a rally. The 10-year benchmark, 6.10% GSec 2031, saw yield remain rangebound and closed the month at 6.22%. The 5-year GSec yield fell 8bps to end at 5.65% while the 14-year GSec fell 3bps to end at 6.78%.
Consumer Price Index (CPI) inflation was 5.6% y/y in July, after 6.3% in both May and June. While the sequential momentum in food and beverages slowed in the last two months, that in core CPI (headline excluding food and beverages, fuel and light) increased in July. On a y/y basis, core inflation was at 6.7% in July and has averaged 6.6% since April vs. the headline average of 5.6%.
Real Gross Domestic Product (GDP) growth in the June 2021 quarter, which witnessed the second wave of Covid infections, was 20.1% y/y due to base effect from the June 2020 quarter which had contracted 24.4%. The sequential q/q (seasonally adjusted) fall was actually higher-than-usual at 12.7%. Real core- GVA (headline Gross Value-Added excluding agriculture and public administration, defence and other services), a proxy for private sector activity, was down 18.2% q/q and the level of nominal GDP was still below the pre-pandemic Dec19 and Mar20 quarter levels.
Central government finances for July revealed healthy tax collections with both gross and net tax revenues well above July 2019 levels. Since April 2021, direct taxes, excise duty and GST collections have been robust and thus net tax revenue is 34% of FY22BE vs. 22% of actuals in FY19 and 25% in FY20. However, expenditure has been restrained at 29% of FY22BE till July. Thus, fiscal deficit so far is 21% of FY22BE vs. 83% of actuals in FY19 and 59% in FY20.
Industrial production (IP) growth for June was 13.6%, due to base effect, while it was 7.6% on a q/q seasonally adjusted basis after -11.5% in May. Infrastructure Industries output (core IP) for July was up 9.4% y/y and 4.3% m/m seasonally adjusted (latter was 4% in June). This is now at 98.2% of the prepandemic (Feb20) level.
Headline bank credit outstanding as on 13th August was up 6.5% y/y, partly due to base effect. In July, bank credit flow picked up further after negative flows in April and May had turned positive in June. However, during April to July, overall bank credit was strongly negative to industries, mildly negative to services and mildly positive for personal loans.
High frequency indicators like Google & Apple mobility indicators, power consumption levels and railway freight revenue picked up in August, while number of GST e-way bills generated remained strong.
Globally, the speech by the Chair of the US Fed, Jerome Powell, at the annual Jackson Hole Economic Symposium last month noted the US economy has met the Fed's test for "substantial further progress" on the inflation front and is making progress towards maximum employment. The US headline Consumer Price Index (CPI) inflation and core (headline ex food and energy) inflation remained high at 5.4% and 4.3% y/y respectively in July, with the sequential cumulative m/m momentum since March 2021 at 3.4% vs. 1.2% for the same period in 2019. However, non-farm payroll additions for August was lower than expected at 235,000 (due to the recent rise in Covid infections) after being strong in June and July, although wage growth continued to be strong. The survey of consumer sentiment, by the University of Michigan, also fell in July and August.
The very noticeable improvement in government finances this year is a macro positive from a bond market point of view. That said, even adjusted for this improvement, gross bond supply will still likely be large enough to disallow any sustained fall in bond yields. Similarly, the increased emerging market (EM) dovish backdrop for now post the Jackson Hole meet has drawn some foreign interest in our local bonds. But this by itself, unless followed through soon with explicit global bond index inclusions, may not be enough to sustainably sway the demand-supply dynamic. All this means that the core hypothesis for navigating this environment remains largely the same: focus on intermediate maturity points for the most part where the potential to exploit steepness of the curve is maximum given the carry and roll down benefits available. Although a normalization schedule for monetary policy may begin in the months ahead, it is likely to be gradual and clearly flagged. Thus, while bond yields may rise, they may do so gradually thereby allowing the steepness in intermediate maturity points to still offer reasonable cushion over longer investment horizons. Some amount of barbelling may purchase further protection during this phase.
Disclaimer: MUTUAL FUND INVESTMENTS ARE SUBJECT TO MARKET RISKS, READ ALL SCHEME RELATED DOCUMENTS CAREFULLY.
The Disclosures of opinions/in house views/strategy incorporated herein is provided solely to enhance the transparency about the investment strategy / theme of the Scheme and should not be treated as endorsement of the views / opinions or as an investment advice. This document should not be construed as a research report or a recommendation to buy or sell any security. This document has been prepared on the basis of information, which is already available in publicly accessible media or developed through analysis of IDFC Mutual Fund. The information/ views / opinions provided is for informative purpose only and may have ceased to be current by the time it may reach the recipient, which should be taken into account before interpreting this document. The recipient should note and understand that the information provided above may not contain all the material aspects relevant for making an investment decision and the security may or may not continue to form part of the scheme's portfolio in future. Investors are advised to consult their own investment advisor before making any investment decision in light of their risk appetite, investment goals and horizon. The decision of the Investment Manager may not always be profitable; as such decisions are based on the prevailing market conditions and the understanding of the Investment Manager. Actual market movements may vary from the anticipated trends. This information is subject to change without any prior notice. The Company reserves the right to make modifications and alterations to this statement as may be required from time to time. Neither IDFC Mutual Fund / IDFC AMC Trustee Co. Ltd./ IDFC Asset Management Co. Ltd nor IDFC, its Directors or representatives shall be liable for any damages whether direct or indirect, incidental, punitive special or consequential including lost revenue or lost profits that may arise from or in connection with the use of the information.
With RBI focusing more on orderly evolution of yield curve, we continued to see minimal intervention by RBI at the 10-year space. With increased liquidity and markets pushing back on rate hike expectation on account of dovish policy statements, the 5-year segment has seen a rally. The 10-year benchmark, 6.10% GSec 2031, saw yield remain rangebound and closed the month at 6.22%. The 5-year GSec yield fell 8bps to end at 5.65% while the 14-year GSec fell 3bps to end at 6.78%.
Consumer Price Index (CPI) inflation was 5.6% y/y in July, after 6.3% in both May and June. While the sequential momentum in food and beverages slowed in the last two months, that in core CPI (headline excluding food and beverages, fuel and light) increased in July. On a y/y basis, core inflation was at 6.7% in July and has averaged 6.6% since April vs. the headline average of 5.6%.
Real Gross Domestic Product (GDP) growth in the June 2021 quarter, which witnessed the second wave of Covid infections, was 20.1% y/y due to base effect from the June 2020 quarter which had contracted 24.4%. The sequential q/q (seasonally adjusted) fall was actually higher-than-usual at 12.7%. Real core- GVA (headline Gross Value-Added excluding agriculture and public administration, defence and other services), a proxy for private sector activity, was down 18.2% q/q and the level of nominal GDP was still below the pre-pandemic Dec19 and Mar20 quarter levels.
Central government finances for July revealed healthy tax collections with both gross and net tax revenues well above July 2019 levels. Since April 2021, direct taxes, excise duty and GST collections have been robust and thus net tax revenue is 34% of FY22BE vs. 22% of actuals in FY19 and 25% in FY20. However, expenditure has been restrained at 29% of FY22BE till July. Thus, fiscal deficit so far is 21% of FY22BE vs. 83% of actuals in FY19 and 59% in FY20.
Industrial production (IP) growth for June was 13.6%, due to base effect, while it was 7.6% on a q/q seasonally adjusted basis after -11.5% in May. Infrastructure Industries output (core IP) for July was up 9.4% y/y and 4.3% m/m seasonally adjusted (latter was 4% in June). This is now at 98.2% of the prepandemic (Feb20) level.
Headline bank credit outstanding as on 13th August was up 6.5% y/y, partly due to base effect. In July, bank credit flow picked up further after negative flows in April and May had turned positive in June. However, during April to July, overall bank credit was strongly negative to industries, mildly negative to services and mildly positive for personal loans.
High frequency indicators like Google & Apple mobility indicators, power consumption levels and railway freight revenue picked up in August, while number of GST e-way bills generated remained strong.
Globally, the speech by the Chair of the US Fed, Jerome Powell, at the annual Jackson Hole Economic Symposium last month noted the US economy has met the Fed's test for "substantial further progress" on the inflation front and is making progress towards maximum employment. The US headline Consumer Price Index (CPI) inflation and core (headline ex food and energy) inflation remained high at 5.4% and 4.3% y/y respectively in July, with the sequential cumulative m/m momentum since March 2021 at 3.4% vs. 1.2% for the same period in 2019. However, non-farm payroll additions for August was lower than expected at 235,000 (due to the recent rise in Covid infections) after being strong in June and July, although wage growth continued to be strong. The survey of consumer sentiment, by the University of Michigan, also fell in July and August.
Outlook
The very noticeable improvement in government finances this year is a macro positive from a bond market point of view. That said, even adjusted for this improvement, gross bond supply will still likely be large enough to disallow any sustained fall in bond yields. Similarly, the increased emerging market (EM) dovish backdrop for now post the Jackson Hole meet has drawn some foreign interest in our local bonds. But this by itself, unless followed through soon with explicit global bond index inclusions, may not be enough to sustainably sway the demand-supply dynamic. All this means that the core hypothesis for navigating this environment remains largely the same: focus on intermediate maturity points for the most part where the potential to exploit steepness of the curve is maximum given the carry and roll down benefits available. Although a normalization schedule for monetary policy may begin in the months ahead, it is likely to be gradual and clearly flagged. Thus, while bond yields may rise, they may do so gradually thereby allowing the steepness in intermediate maturity points to still offer reasonable cushion over longer investment horizons. Some amount of barbelling may purchase further protection during this phase.
Disclaimer: MUTUAL FUND INVESTMENTS ARE SUBJECT TO MARKET RISKS, READ ALL SCHEME RELATED DOCUMENTS CAREFULLY.
The Disclosures of opinions/in house views/strategy incorporated herein is provided solely to enhance the transparency about the investment strategy / theme of the Scheme and should not be treated as endorsement of the views / opinions or as an investment advice. This document should not be construed as a research report or a recommendation to buy or sell any security. This document has been prepared on the basis of information, which is already available in publicly accessible media or developed through analysis of IDFC Mutual Fund. The information/ views / opinions provided is for informative purpose only and may have ceased to be current by the time it may reach the recipient, which should be taken into account before interpreting this document. The recipient should note and understand that the information provided above may not contain all the material aspects relevant for making an investment decision and the security may or may not continue to form part of the scheme's portfolio in future. Investors are advised to consult their own investment advisor before making any investment decision in light of their risk appetite, investment goals and horizon. The decision of the Investment Manager may not always be profitable; as such decisions are based on the prevailing market conditions and the understanding of the Investment Manager. Actual market movements may vary from the anticipated trends. This information is subject to change without any prior notice. The Company reserves the right to make modifications and alterations to this statement as may be required from time to time. Neither IDFC Mutual Fund / IDFC AMC Trustee Co. Ltd./ IDFC Asset Management Co. Ltd nor IDFC, its Directors or representatives shall be liable for any damages whether direct or indirect, incidental, punitive special or consequential including lost revenue or lost profits that may arise from or in connection with the use of the information.
