Commentary

Global Markets
Global equities strengthened across regions (+7.6% MoM/-16.4% YTD). Brazil was the only outlier while all
other regions improved (US surging 5%/China +30%/Euro area up 11%).
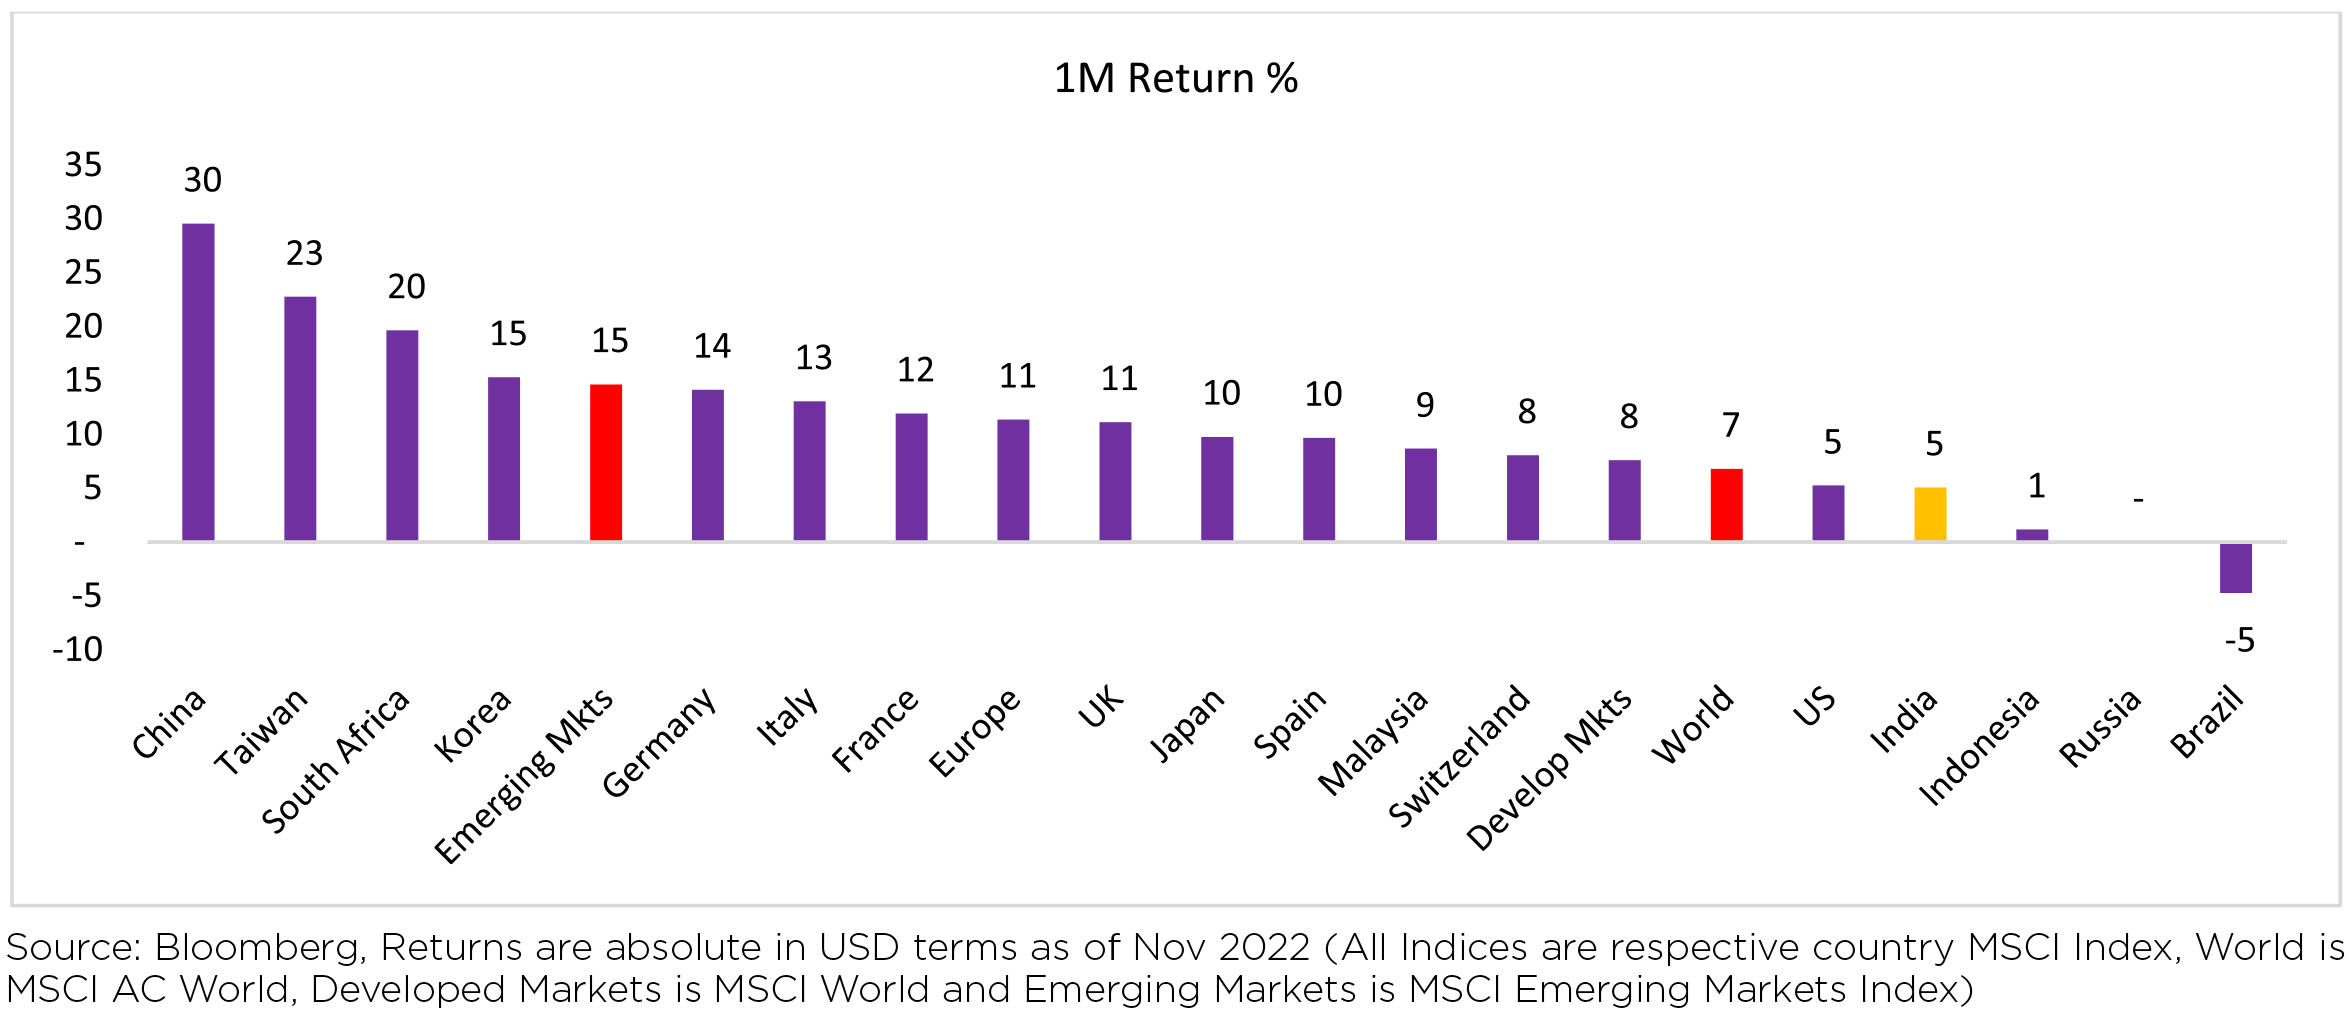
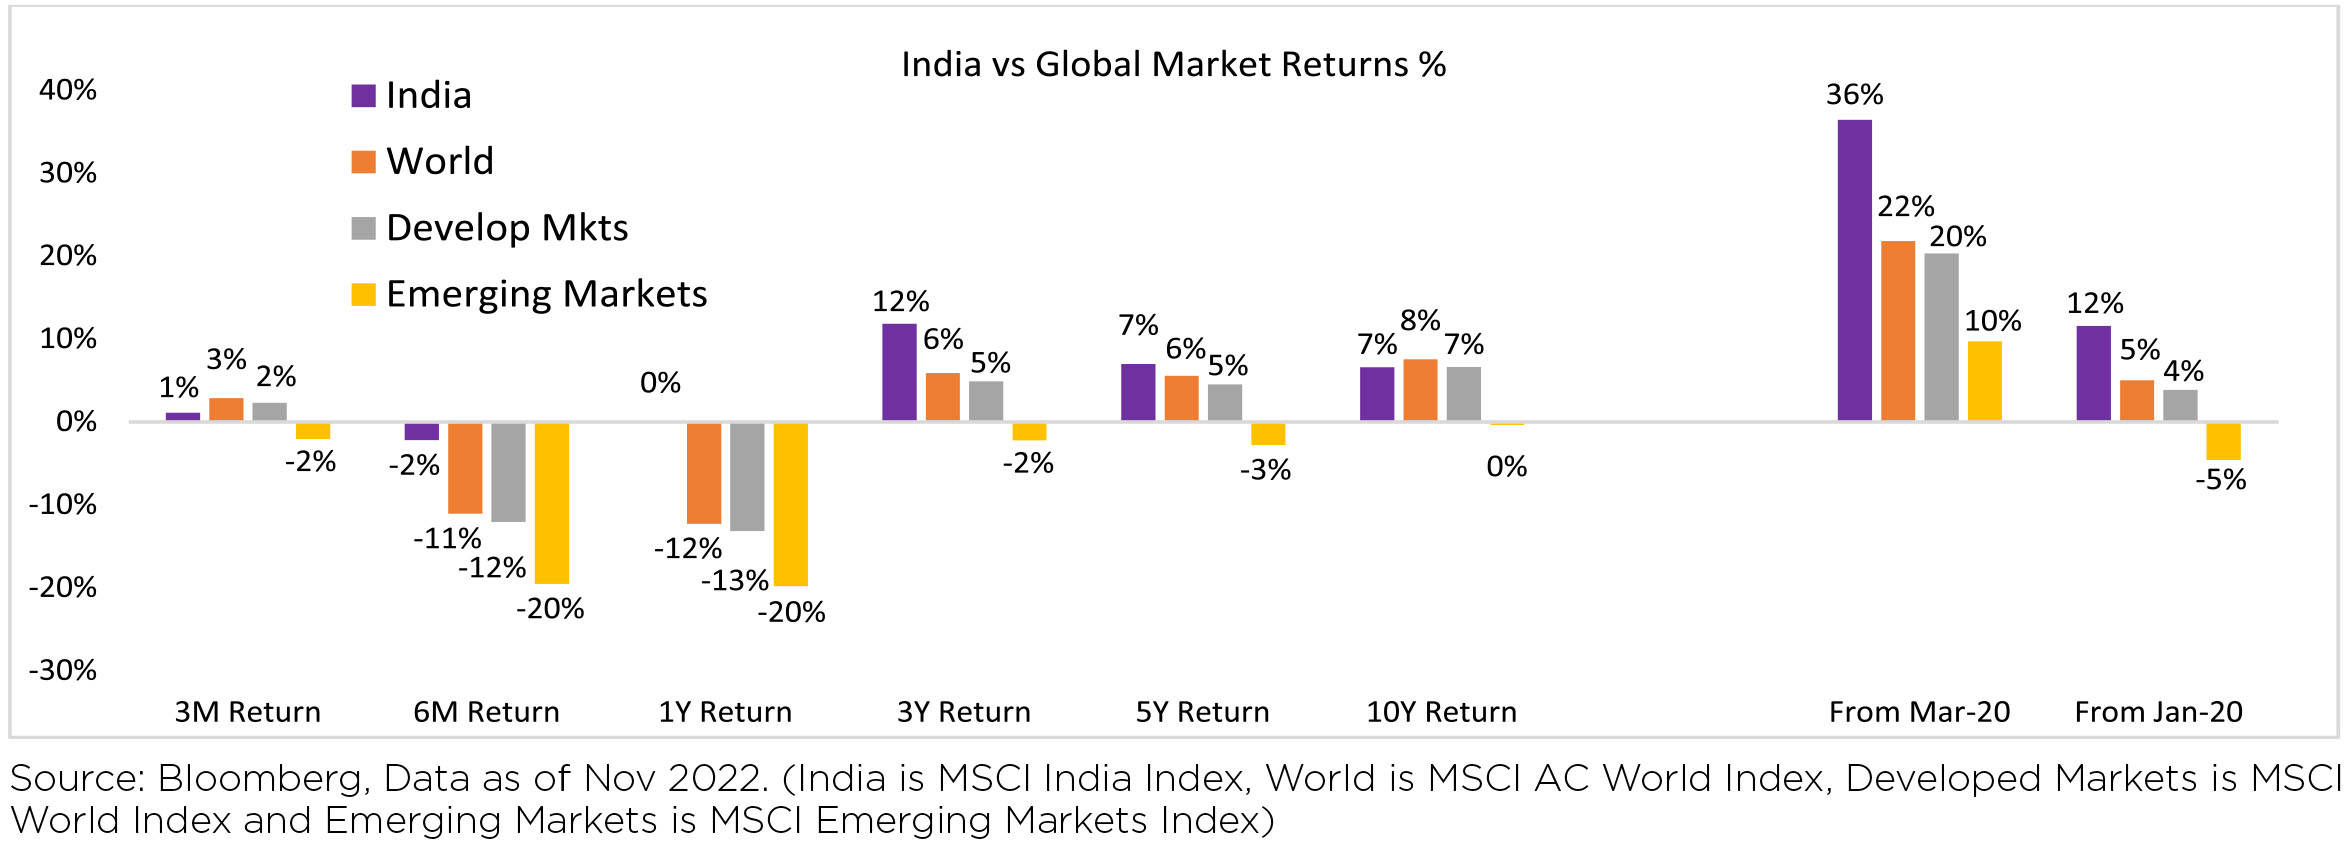
Indian equities (MSCI India) gained (USD terms, +5% MoM/-3% YTD), while underperforming the region
and its peers (MSCI APxJ/EM: -17%/+15% MoM).
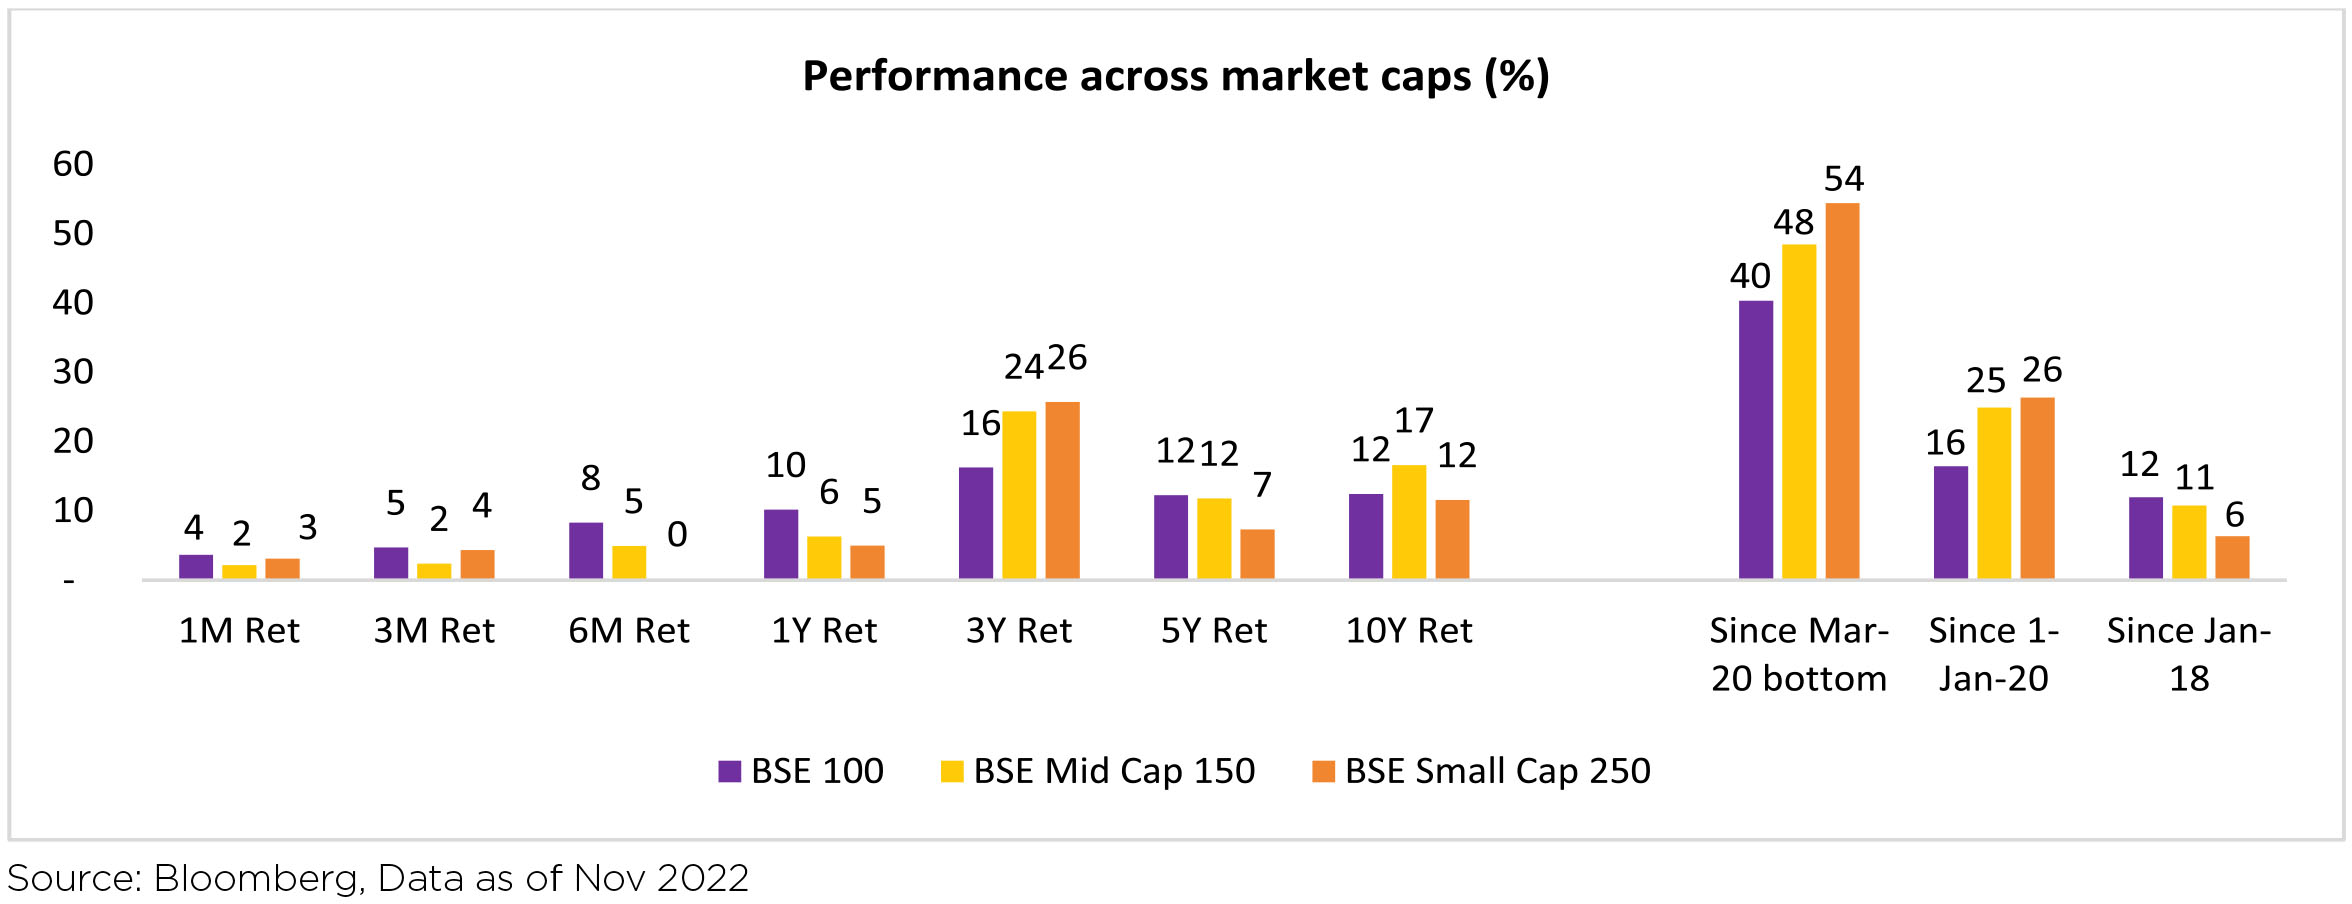
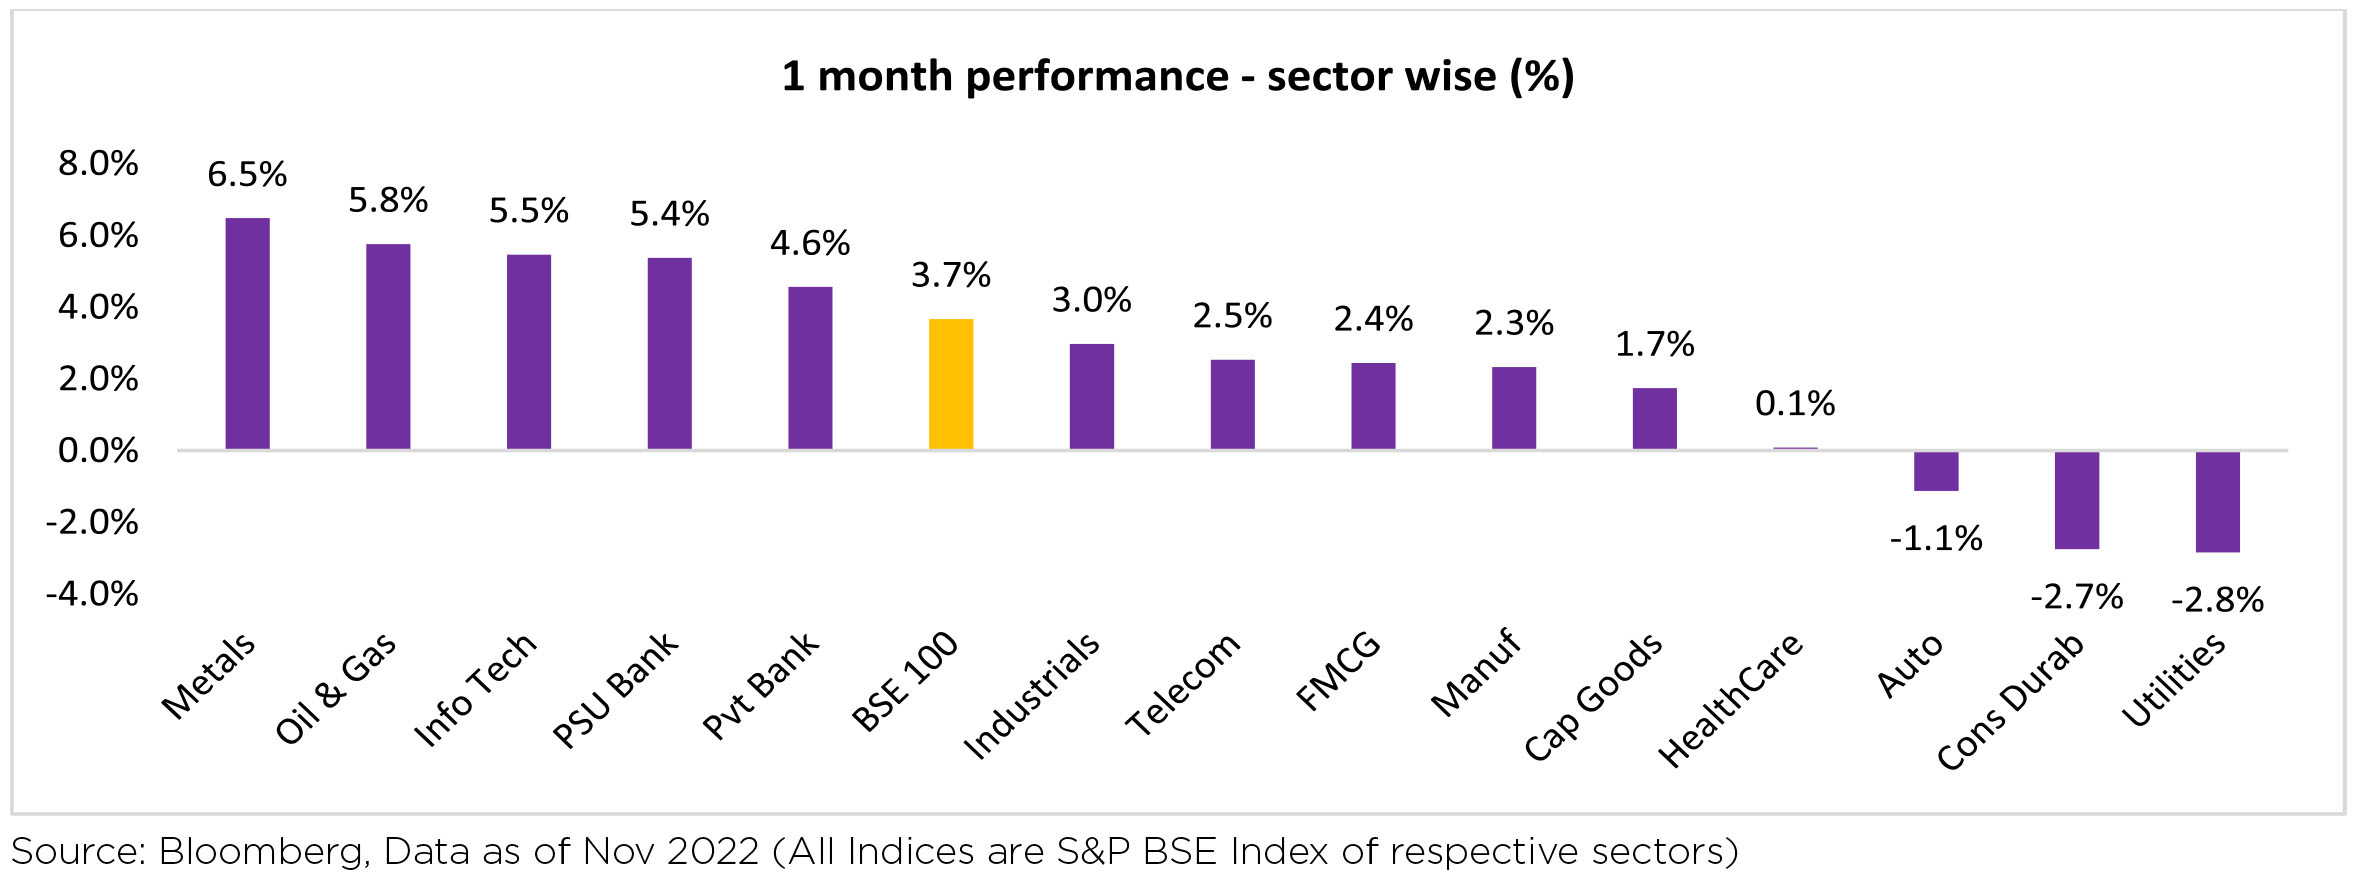
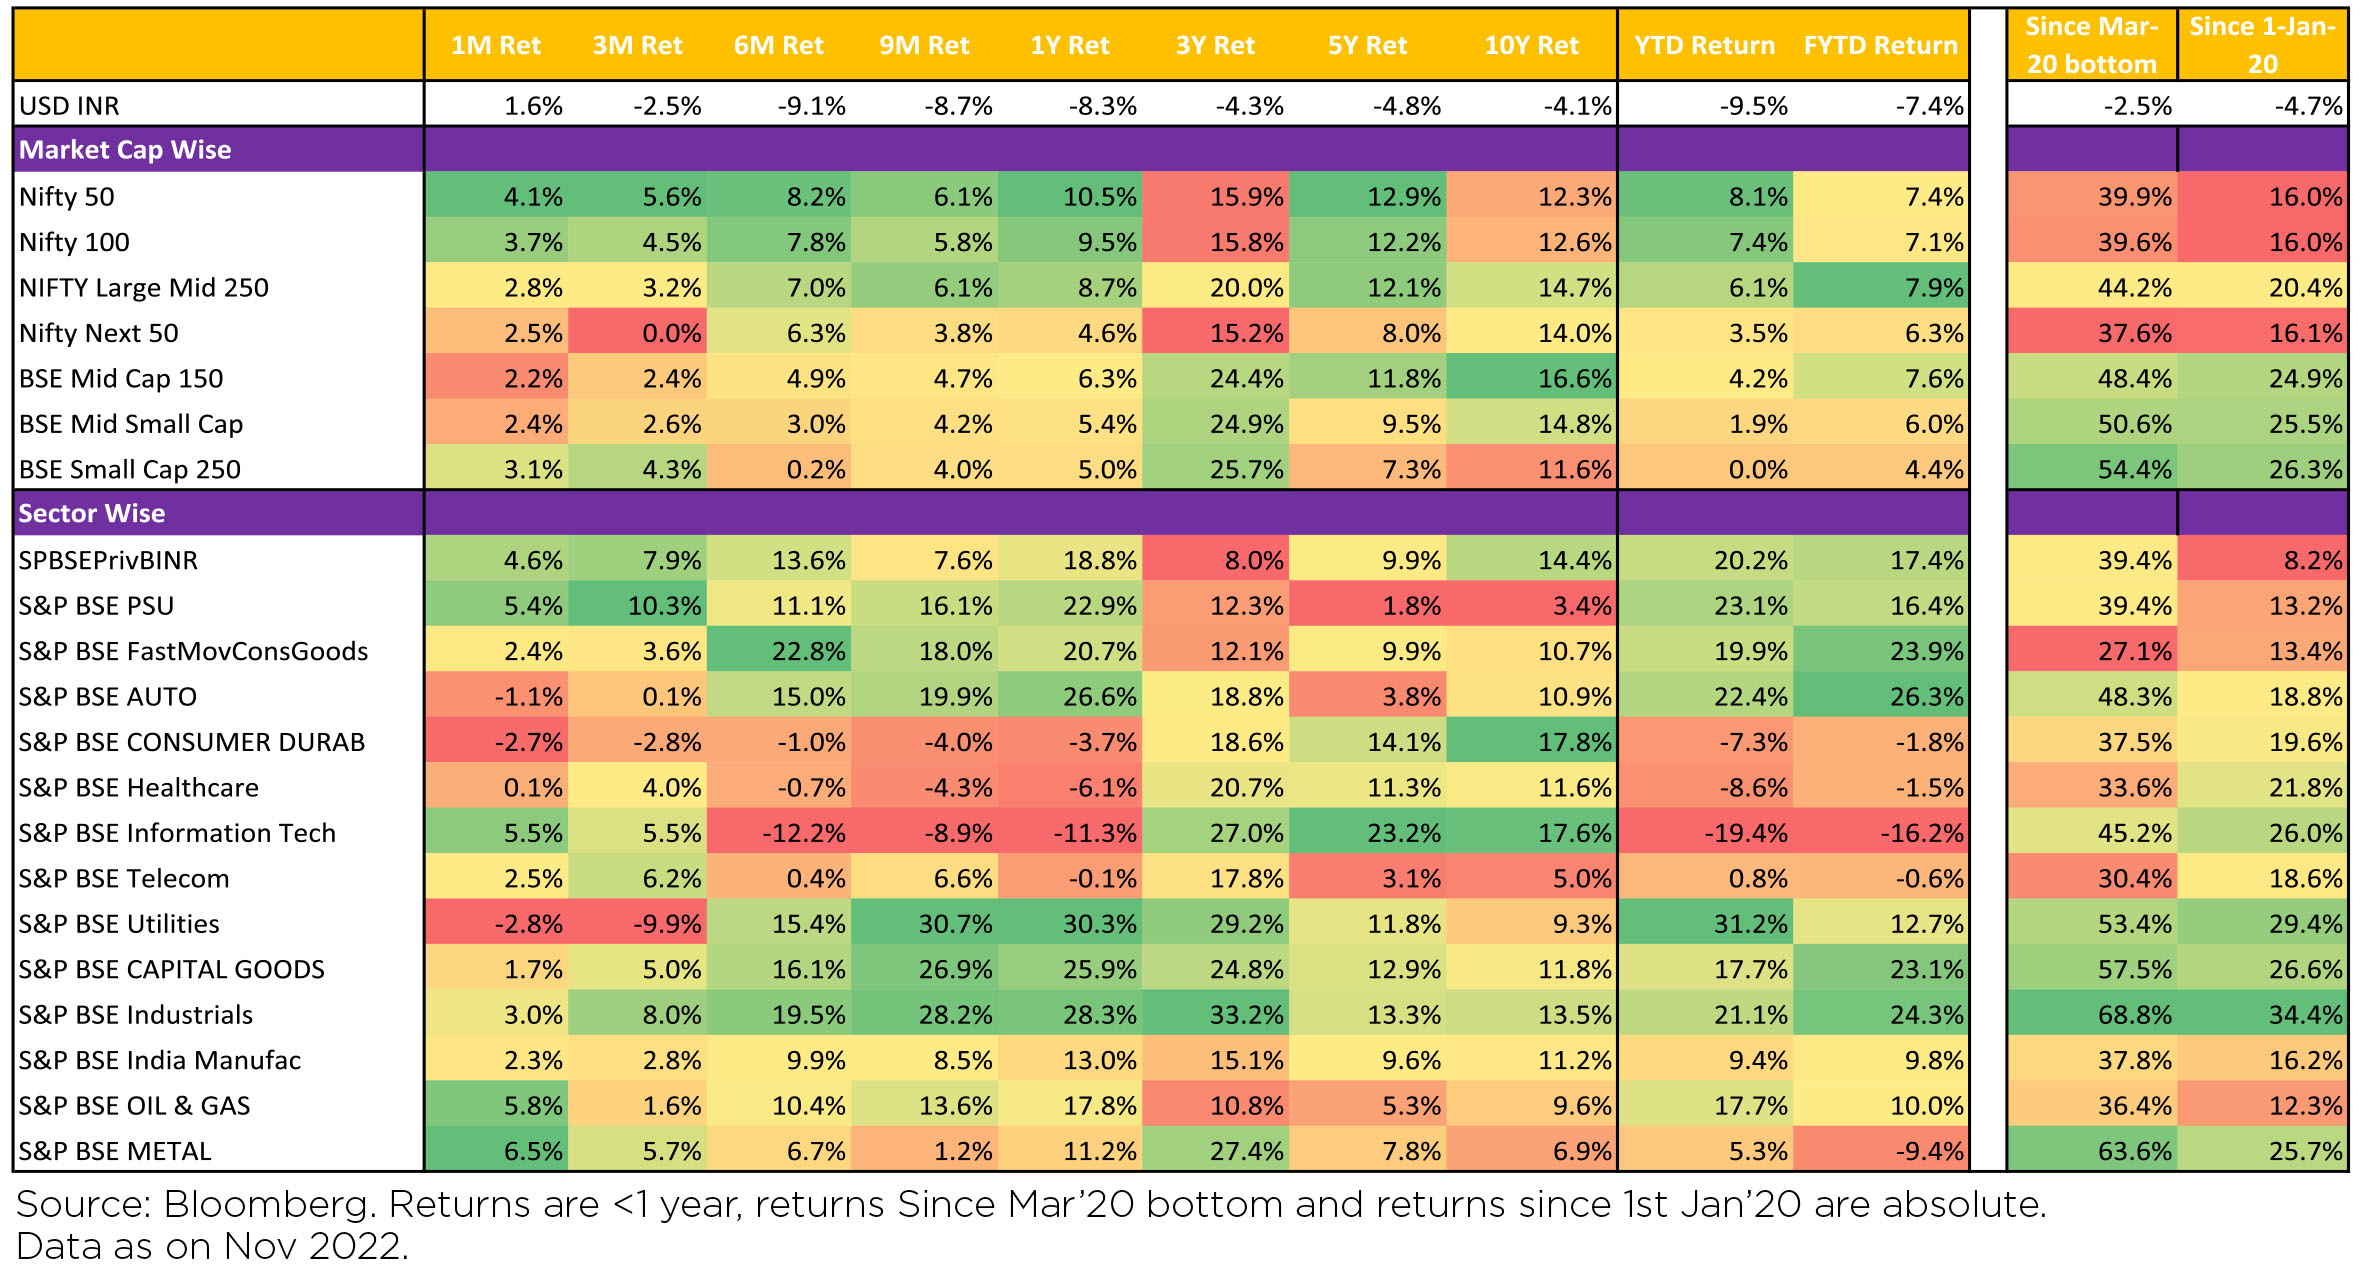
Performance of both mid-caps (up ~2% MoM) and small caps (up ~3% MoM) was positive, though weaker than large caps (up ~4% MoM). All sectors barring Consumer Discretionary, Auto and Utilities ended the month in the green as NIFTY improved (up ~4% MoM), clocking a new lifetime high of 18,758 at the close of the month . INR appreciated by 1.7% MoM, reaching ~81.43/USD in November. DXY (Dollar Index) weakened 5% over the month, closing the month at 105.95 (from 111.53 a year earlier).
Commodities, Interest rate and Inflation:
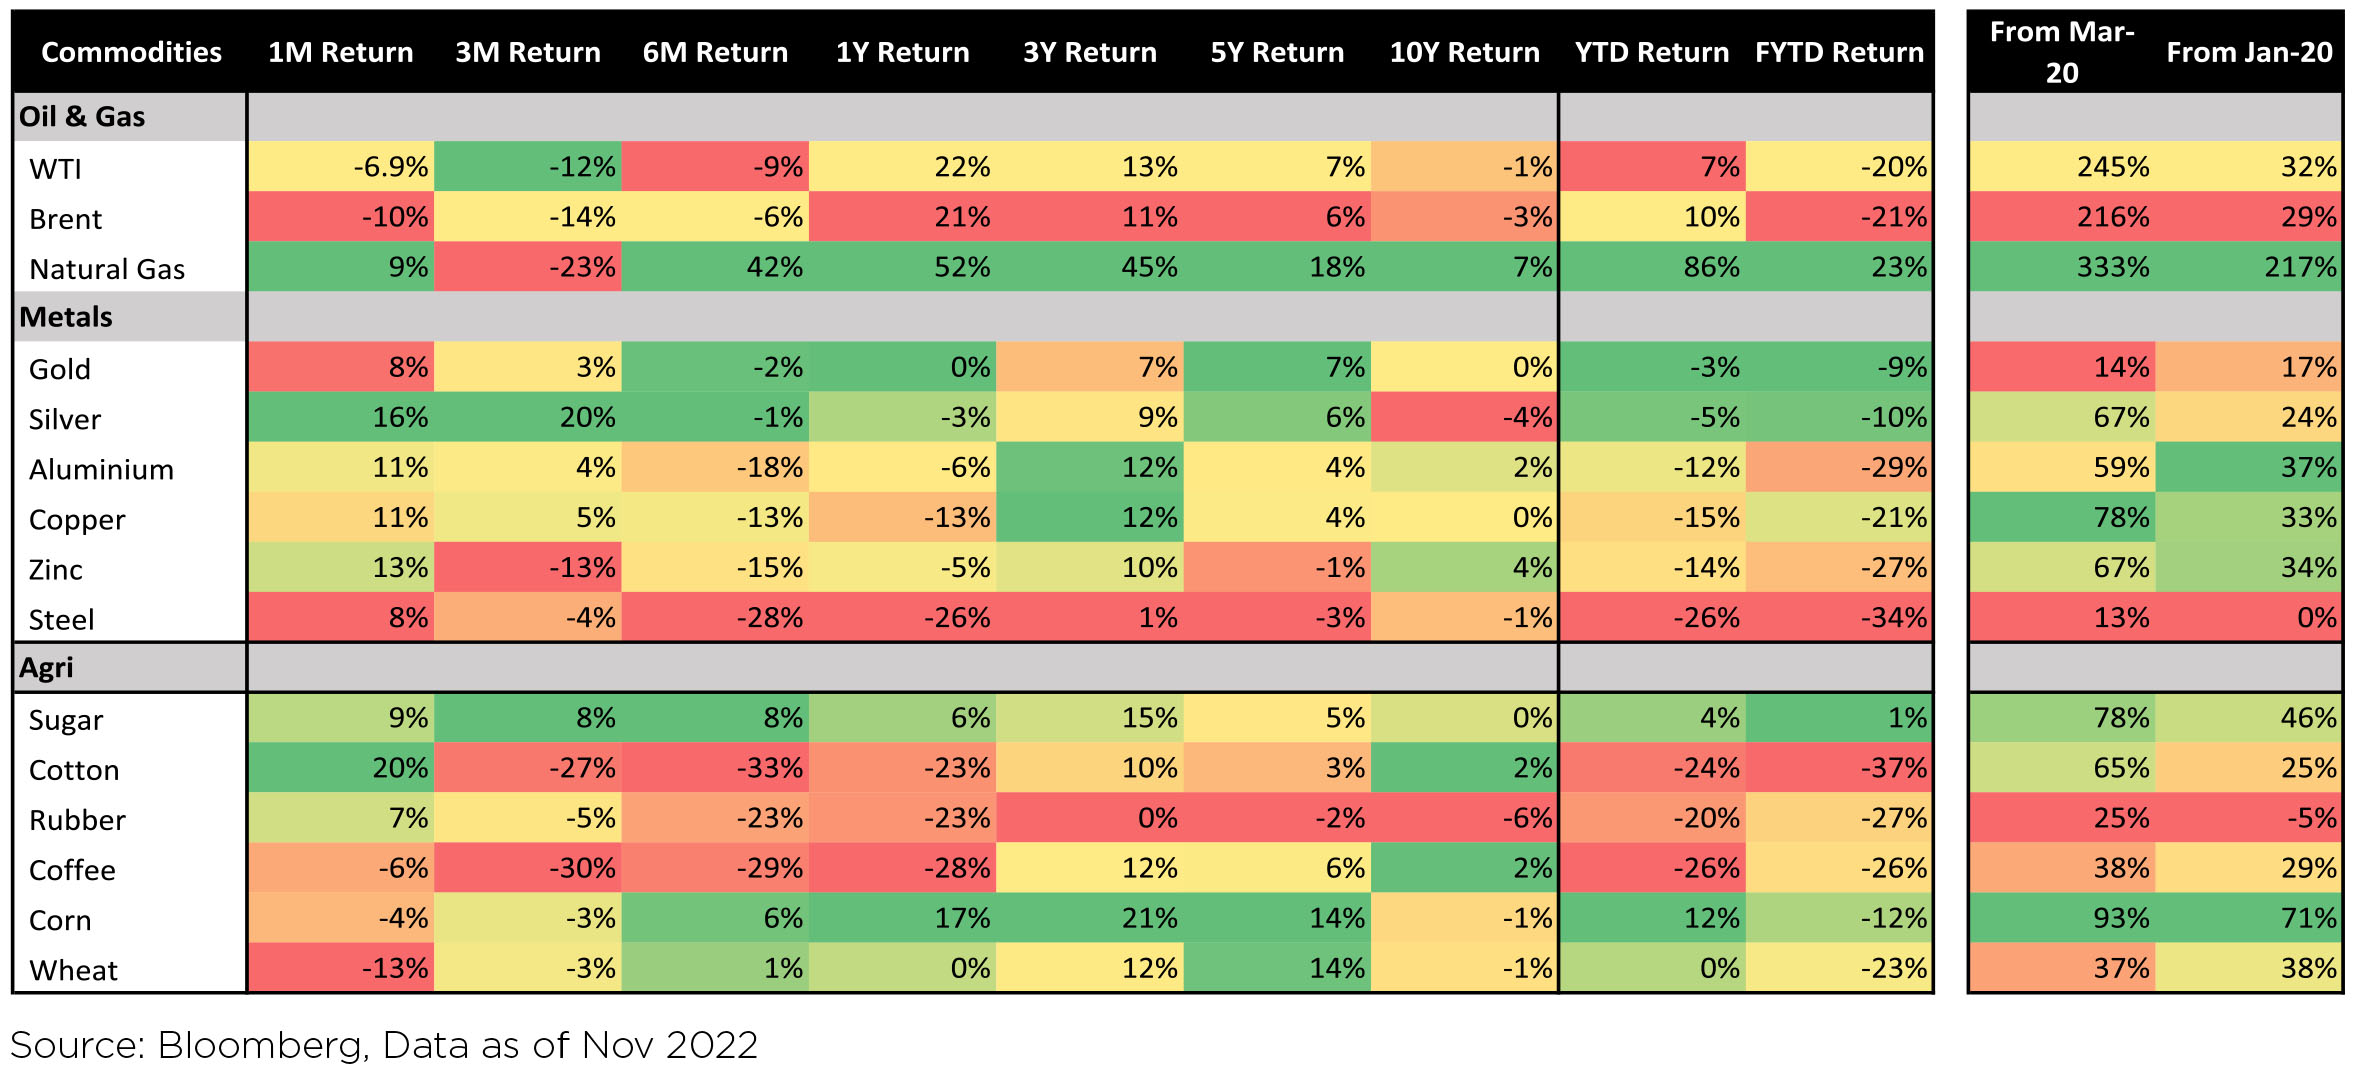
Brent Crude prices declined sharply (-10%) over the month of November, following the rise of ~11% in October. Metals prices have gone up during the month, and China's property rescue plan might lead to a further pick-up in Metals prices. Increasing recessionary fears and aggressive tightening of global liquidity are other monitorables.
Benchmark 10-year treasury yields closed at 7.25% in November (14bps lower vs. October closing). US 10Y yields are at 3.61% (down 44 bps MoM, up 215 bps YoY).
Macro prints deteriorated:
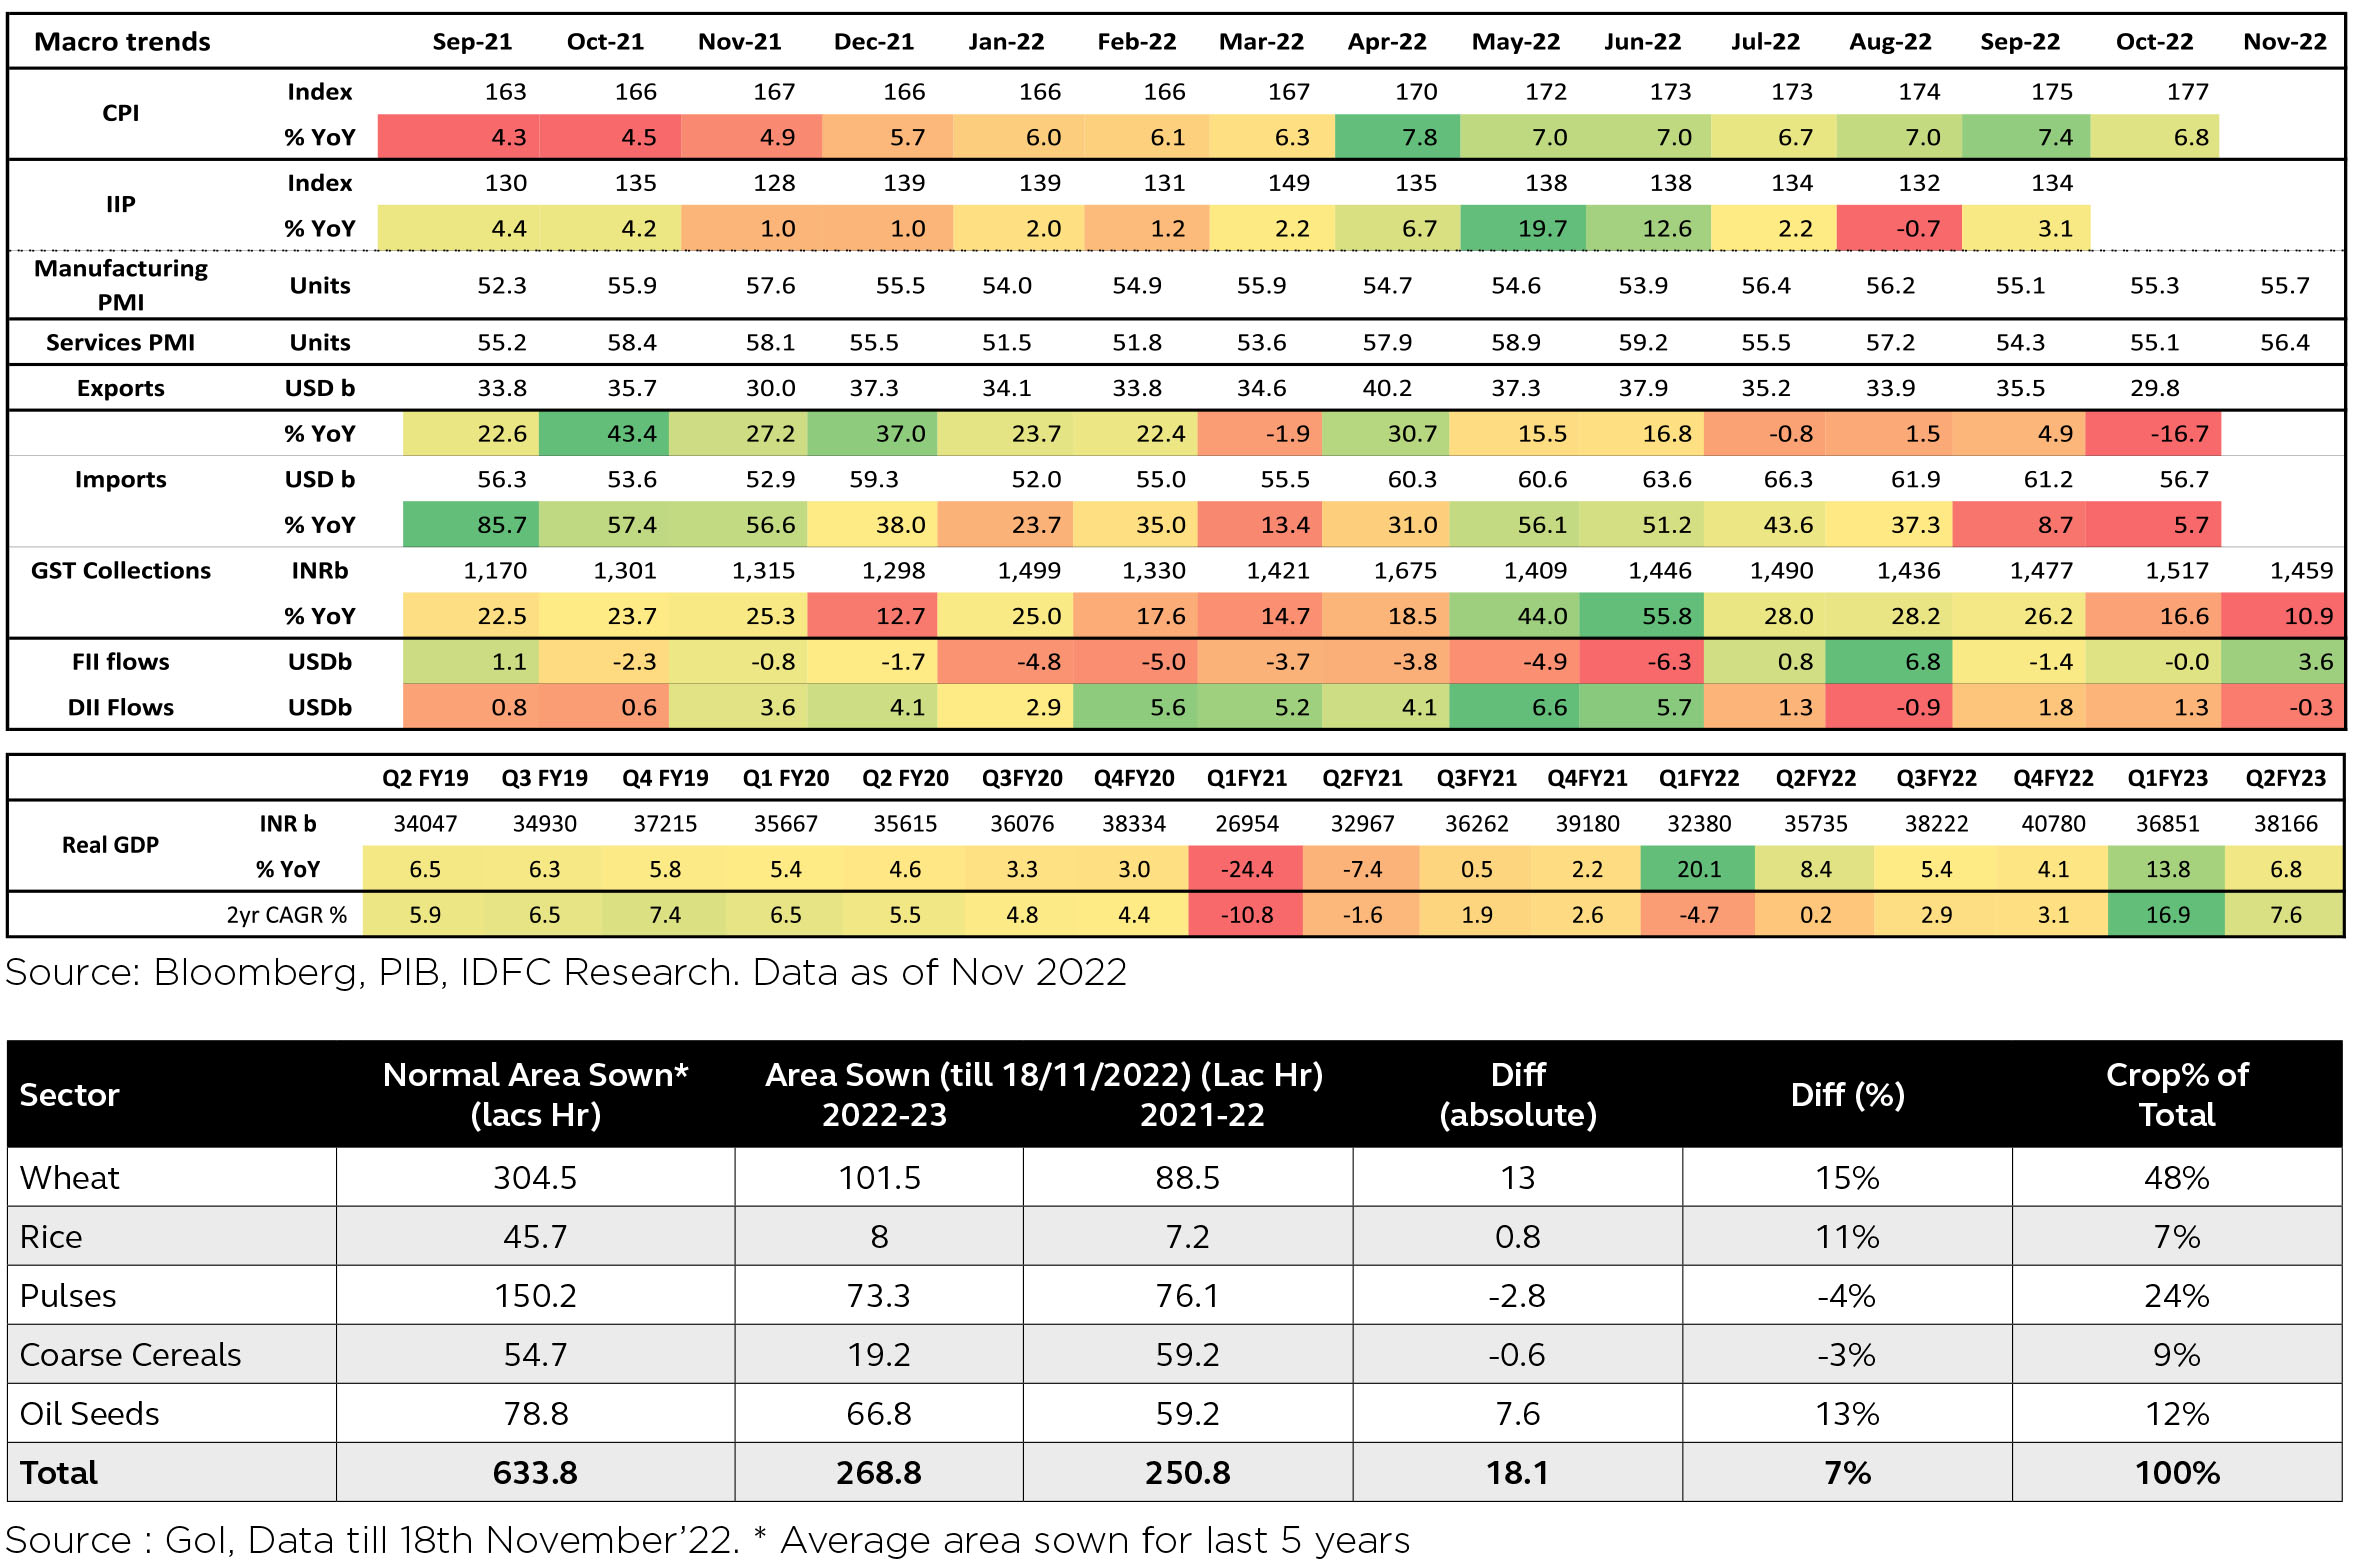
► Inflationary pressures moderated in Oct'22 as CPI and WPI both eased in Oct'22 to 6.8% YoY and 8.4% YoY respectively primarily led by vegetables.
► September quarter GDP slowed to +6.3% YoY (versus +8.4% YoY in 2Q FY22).
► IIP made some recovery in September coming in at +3.1% YoY after having fallen into the red (-0.7% YoY in August).
► Real GDP expands by 6.3% YoY in Q2 FY23 which is well below a 13.5% growth in Q1, as low base effects due to lockdown fades, high prices and rising interest rates weighed on demand and slowing global demand started to impact exports
► India's FX reserves came in at $550 bn. FX reserves have gone up by about US $19bn in the last 4 weeks.
► The Kirit Parikh committee has recommended a price band of $4-6.50/unit for APM gas, with a proposal to increase gas price ceiling by $0.5/mmbtu every year.
► GST collections in November remained above the Rs1.4tn mark for nine consecutive months coming at Rs1.46 tn.
► Fiscal deficit remained in check owing to robust receipts, even with the pickup in pace of expenditure. It appears to be on track to meet its FY2023BE target, with a run-rate of 45.6% in 7MFY23
FIIs were buyers of Indian equities in November (+$3.6bn, flattish in October). So far, India has seen CYTD FII outflows of $18.7bn. DIIs saw selling to the quantum of $0.3bn in November, reversing the buying trend of the previous two months.
As per the recently published data by Ministry of Agriculture & Farmer Welfare, Overall sowing stands at 268.8 Lacs Hr, up by 7.2% YoY. Wheat (48% of Rabi Crop) sowing up by 15%YoY to 101.5 Lacs hectares. Also live water storage is 108% above last year and 119% of last ten years avg. Higher sowing coupled with better commodity prices augurs well for the upcoming rabi season.
September'22 Earnings season ended with S&P BSE 200 companies reporting 21% YoY profit growth while remaining almost flat sequentially. Growth was led by Financials which was offset by the sharp declines in Materials and Energy. FY23 EPS were cut by 2.3 ppts (FY24 largely unchanged and now consensus expects 10% EPS growth for FY23E and 20% for FY 24E. The worst for margin seems behind as corporates' outlook on commodity costs improve. However, demand commentary has turned adverse.


Domestic Markets
Performance of both mid-caps (up ~2% MoM) and small caps (up ~3% MoM) was positive, though weaker than large caps (up ~4% MoM). All sectors barring Consumer Discretionary, Auto and Utilities ended the month in the green as NIFTY improved (up ~4% MoM), clocking a new lifetime high of 18,758 at the close of the month . INR appreciated by 1.7% MoM, reaching ~81.43/USD in November. DXY (Dollar Index) weakened 5% over the month, closing the month at 105.95 (from 111.53 a year earlier).


Commodities, Interest rate and Inflation:
Brent Crude prices declined sharply (-10%) over the month of November, following the rise of ~11% in October. Metals prices have gone up during the month, and China's property rescue plan might lead to a further pick-up in Metals prices. Increasing recessionary fears and aggressive tightening of global liquidity are other monitorables.
Benchmark 10-year treasury yields closed at 7.25% in November (14bps lower vs. October closing). US 10Y yields are at 3.61% (down 44 bps MoM, up 215 bps YoY).

Macro prints deteriorated:
► Inflationary pressures moderated in Oct'22 as CPI and WPI both eased in Oct'22 to 6.8% YoY and 8.4% YoY respectively primarily led by vegetables.
► September quarter GDP slowed to +6.3% YoY (versus +8.4% YoY in 2Q FY22).
► IIP made some recovery in September coming in at +3.1% YoY after having fallen into the red (-0.7% YoY in August).
► Real GDP expands by 6.3% YoY in Q2 FY23 which is well below a 13.5% growth in Q1, as low base effects due to lockdown fades, high prices and rising interest rates weighed on demand and slowing global demand started to impact exports
► India's FX reserves came in at $550 bn. FX reserves have gone up by about US $19bn in the last 4 weeks.
► The Kirit Parikh committee has recommended a price band of $4-6.50/unit for APM gas, with a proposal to increase gas price ceiling by $0.5/mmbtu every year.
► GST collections in November remained above the Rs1.4tn mark for nine consecutive months coming at Rs1.46 tn.
► Fiscal deficit remained in check owing to robust receipts, even with the pickup in pace of expenditure. It appears to be on track to meet its FY2023BE target, with a run-rate of 45.6% in 7MFY23
FIIs were buyers of Indian equities in November (+$3.6bn, flattish in October). So far, India has seen CYTD FII outflows of $18.7bn. DIIs saw selling to the quantum of $0.3bn in November, reversing the buying trend of the previous two months.
As per the recently published data by Ministry of Agriculture & Farmer Welfare, Overall sowing stands at 268.8 Lacs Hr, up by 7.2% YoY. Wheat (48% of Rabi Crop) sowing up by 15%YoY to 101.5 Lacs hectares. Also live water storage is 108% above last year and 119% of last ten years avg. Higher sowing coupled with better commodity prices augurs well for the upcoming rabi season.
September'22 Earnings season ended with S&P BSE 200 companies reporting 21% YoY profit growth while remaining almost flat sequentially. Growth was led by Financials which was offset by the sharp declines in Materials and Energy. FY23 EPS were cut by 2.3 ppts (FY24 largely unchanged and now consensus expects 10% EPS growth for FY23E and 20% for FY 24E. The worst for margin seems behind as corporates' outlook on commodity costs improve. However, demand commentary has turned adverse.

Market Performance
Outlook
After the exhilarating moves in Cy 20 and Cy 21, market movement during Cy 22 has been more sedate. Nifty till a few weeks back was flirting with negative return on a Calendar year basis. Clearly, equity returns have been underwhelming. Yet, the markets have climbed the proverbial "walls of worry" to cross the previous peak touched in Oct'21.
Even though equity, like any other asset class is complex and attributes which move the markets are always changing. Yet, we always like to attribute a few factors (if you are more sophisticated, the new terminology is "vectors"), which tend to have a "disproportionate" impact on moving the market. In the current scenario, US Fed's actions and comments, impending and much discussed US economic slowdown in Cy 23; negative impact of sharp rise in commodity prices on corporate earnings; along with a marked slowdown in China induced by its Covid-19 policy, would rank high on the list of investors to explain the meandering returns of the last 11 months. To this we will add the conundrum of valuations. While India valuation as compared to its past, do not appear threatening, on a relative basis - trading at a premium of 40% + to MSCI World and even higher to MSCI EM makes this a key vector.
Is the Indian market overvalued, as a result becomes a difficult question to answer? "Are we in bubble territory" would be a relatively easier question to answer - NO. A simple, yet effective test of the market valuation would be to compare Small Cap Index earnings to Nifty. In Cy 2017, Small cap index traded at a premium to Nifty and needed a trigger to unravel. Thankfully, in the market rally since Apr'2020, Small cap index has never traded at a premium to Nifty. Thus, while valuations may be elevated we are not in bubble territory.
This should be the most important take away for investors, moderate return expectations not equity allocation at the current juncture...this train can chug along for some more time.
Note: The above graph is for representation purposes only and should not be used for the development or implementation of an investment strategy. Past performance may or may not be sustained in the future.
What Went By
India's real GDP for the September quarter grew 6.3% y/y, after 13.5% in the June quarter, as base effect
waned. On a seasonally adjusted q/q basis, it grew 1.4% after 0.2% in June. However, sequential growth in
private consumption weakened and that in government consumption stayed negative. However, fixed
investment growth picked up. From the supply side, sequential growth in manufacturing contracted while
that in construction and trade-hotels-transport-communication-and-services-related-to-broadcasting turned
positive and that in agriculture improved.
Consumer Price Index (CPI) inflation in India was 6.8% y/y in October, after 7.4% in September, as momentum in food prices and core inflation (CPI excluding food and beverages, fuel and light) picked up further. Core inflation was at 6% in October, has averaged 6.1% in H1 FY23 and 6% in FY22. Real time prices of vegetables have sequentially eased and that of pulses and edible oils are growing at a softer pace although that of cereals have moved up in December. The trajectory of food prices would really be important for the next few CPI readings.
During April-October of FY23, central government net tax revenue growth was 11.2% y/y while total expenditure grew 17.4%. Fiscal deficit so far is thus 45.6% of FY23 budget estimate vs. 34.4% this time last year. Small savings inflow during April-October 2022 was a bit lower than that during the same period of last year and needs to be ~Rs. 65,000cr higher during the remaining fiscal year (vs. last year). GST collection remained buoyant at Rs. 1.46 lakh crore and 11% y/y during November.
Industrial production (IP) growth was 3.1% y/y in September after -0.7% in August. On a seasonally adjusted month-on-month basis, it was +0.8% in September after -2.6% in August. Output momentum turned positive in capital, infrastructure & construction and consumer non-durable goods, while it stayed negative for intermediate and consumer durable goods. However, infrastructure Industries output (40% weight in IP) turned negative again at -1.5% m/m seasonally adjusted in October after staying positive for two months.
Bank credit outstanding as on 18th November was up 17.2% y/y and has averaged 14.1% since April 2022 (up from 8% during January-March), likely also due to higher inflation and thus higher demand for working capital. Bank deposit growth was at 9.6%. Credit flow till date during the financial year has been much higher in FY22, vs. FY20 and FY21, with strong flows to personal loans (38% of total flow) and services (30% of total flow).
Merchandise trade deficit increased to USD 26.9bn in October from USD 25.7bn in September. In October, oil exports moderated sequentially for the second month while non-oil exports moderated for the fourth month. While oil imports have also moderated in the last few months, non-oil-non-gold imports also fell strongly in October. Trade deficit has averaged USD 22.3bn since September 2021 vs. USD 10.8bn during April-August 2021. During the same periods, non-oil-non-gold imports picked up to an average of USD 38.6bn vs. USD 29.3bn.
Among higher-frequency variables, number of two-wheelers registered picked up sharply from October (likely also festive season effect) but eased in November. Energy consumption level eased from September to October but picked up in November and is above previous year level. Monthly number of GST e-way bills generated continues to remain strong, at 8.1cr units in November. It had averaged 7.9cr in the September quarter after 7.4cr in the June quarter.
US headline CPI was at 7.7% y/y in October after 8.2% in September and was below expectation due to softer inflation in durable goods and even some parts of services. House rent, although it moderated mildly, continued to stay strong. Core CPI was at 6.3% in October after 6.6% in September. US non-farm payroll addition in November (263,000 persons) was below that in October (284,000 persons) but above expectation. Unemployment rate stayed flat at 3.7% and Labour Force Participation Rate inched further down. Sequential growth in average hourly earnings was stronger at 0.6% in November after 0.5% in October. Non-farm job openings as per the Job Openings and Labor Turnover Survey (JOLTS) fell sequentially by 0.4mn in October after moving up in September. The FOMC (Federal Open Market Committee) raised the target range for the federal funds rate, by 75 bps for the fourth time and a total of 375bps so far in 2022, to the 3.75-4.00% range on 02nd November. The FOMC meeting statement said it will take into account the cumulative tightening of monetary policy, the lags with which monetary policy affects economic activity and inflation, and economic and financial developments in determining the pace of future increases in the target range. However, the Fed Governor in his interaction after the FOMC meeting said incoming data since last FOMC meeting suggests ultimate level of interest rate will be higher than previously expected and that it is very premature to think about pausing. However, the minutes of the FOMC meeting released later showed there was some discussion on how US economic output could move below potential (and stay there till 2025) and signs of some moderation in wage growth.
The European Central Bank's Governing Council, in its monetary policy decision on 27th October, raised all the three key interest rates by 75bps (after 75bps in September and 50bps in July). It said future decisions will take into consideration the inflation outlook, measures taken so far and transmission lag of monetary policy. However, it also noted that it is not by simply normalising monetary policy that it will identify and reach the interest rates that are necessary in order to deliver the 2% inflation target over the medium term. In its September meeting, when forecasts were last provided, it forecasted Euro Area inflation at 8.1% y/y in 2022, 5.5% in 2023 and 2.3% in 2024. Although its baseline GDP forecast is +0.9% for 2023, the downside scenario (which includes a total shutdown of all Russian gas supply and no other alternative sources of supply including that of LNG) projected a recession in 2023 (GDP forecast of -0.9%). Recent commentary from various ECB Governing Council members continue to be about the need to tame inflation through further rate hikes, even at the cost of low growth.
In China, rising Covid cases and Zero Covid strategy had raised uncertainty about economic reopening while the issues with the property sector continued. However, two key announcements were made last month apart from the recent 25bps cut to the Reserve Requirement Ratio (RRR) for banks. One to fine tune its Zero Covid Policy and another to address financing of the property sector wand both were welcome. More recently, there has been statements from policymakers suggesting China could be reducing the stringency of its Zero Covid strategy. Otherwise, policy response to the economic issues so far has been measured, including cuts to Required Reserve Ratio & Loan Prime Rate, additional quota for policy banks (to channel targeted loans) & local government special bonds, and a focus on infrastructure investment. In October, it had announced an easing of the lower bound of mortgage rate for first time home buyers, tax rebates and rate cuts to Housing Provident Fund to support home purchases.
In its December'22 monetary policy, the RBI / MPC raised repo rate by 35 bps to 6.25%, as was widely expected. There was one dissent on this; from Professor Varma who preferred no hike. The stance was continued as 'withdrawal of accommodation' with two dissents; from Dr. Goyal and Professor Varma. The assessment was somewhat more hawkish than general market expectation. The Governor's commentary was focussed on the persistence of core inflation and the need to break this. The Governor in his statement explicitly noted that "the resurgence in domestic services sector activity could also lead to price increases, especially as firms pass on input costs". Thus the nature of inflation risks has in some sense moved from external factors (commodity prices) to internal ones (strength of domestic activity) for the most part. This to us is the most hawkish aspect of December'22 policy announcement.
That said, what is also true is that these are concurrent assessments. The fact remains that while India and the west are doing better than earlier expected, global PMIs in aggregate are now in contraction zone. While concurrent assessment may continue to be robust for India (even this isn't as uniformly robust as one may like), and while our innate strength from strong balance sheets is well recognised, the future may bring its own set of challenges. Also, in keeping with what seems the norm globally as we approach peak cycle policy rates, the MPC has referred to the need to watch for monetary policy measures already undertaken.
The other hawkish aspect of the policy, but one that seemed somewhat consistent with hints provided before, in our view is this: even as the assurance to inject liquidity as needed continues, the bar to do this has been kept quite high, and the Governor was explicit about this. His statement notes that RBI "will look for a durable sign of a turn in the liquidity cycle when banks draw down large part of their standing deposit facility (SDF) and variable rate reverse repo (VRRR) balances" when it decides to conduct LAF operations that inject liquidity. He also warns that "market participants must wean themselves away from the overhang of liquidity surpluses". This has some important implications: One, the intra-month volatility in overnight rates on the back of ebb and flow of government cash balances will continue without RBI responding with 'tweak' operations. Two, and related to this, the central bank seems to be implicitly moving away from weighted average call rate (WACR) targeting (at least on a hands on basis) back towards some sort of a quantum of liquidity in the system framework.
Outlook
We retain our earlier expressed view of terminal repo being 6.25 - 6.50%. This means that although we recognise that there aren't any explicit signals yet that this may be the end of the cycle, we aren't sure yet that another hike will be forthcoming in the February policy. Just as is the case in most places around the world, most of the tightening is done (or already expected as in the case of US and Europe) and further changes to expectation (or actual further hike in case of India) is now completely dependent on incoming data. To be specific, in our view, there are no longer any 'pre-programmed' biases for further rate hikes in the majority of MPC members. Apart from the ongoing world developments presented above to support this argument, we note two further points: One, 'further calibrated action' being warranted referred to the need prior to this 35 bps action and doesn't constitute guidance on further rate hikes in the future. Second, given ongoing liquidity withdrawal on the back of RBI balance sheet shrinkage, progressive tightening in the system may continue via the banking channel even without RBI raising rates further.
An important aspect of global monetary policy currently is the allowance most central banks are giving on time taken to return to inflation targets. This may be partly owing to lack of choice. Nevertheless, the focus is more on pace of disinflation rather than speedy re-attainment of inflation targets. Acting otherwise would actively court much higher output sacrifices and may even endanger financial stability. However, while this may drive 'how much to tighten' the decision on 'how long to persist' at peak levels before easing policy may very well depend upon clear visibility of targets being met. In our view, India's case is no different. Stabler inflation momentum and conclusive signs of softening (put another way, progression in line with forecasted trajectory) will cement cycle peak even as RBI may take longer to explicitly ease till it's surer that 4% is attainable towards 2024.
This brings us to the micro aspects of the bond market. With a 6.25 - 6.50% peak policy rate, we continue to find the most value in 3 - 5 year maturity government bonds. We aren't as convinced for longer duration (10 - 15 year maturities) for a variety of reasons. But first, we must acknowledge that we (alongside most of the market) have underestimated the resilience of longer duration this year on the back of much higher insurance sector demand and persistent notable undershoots in SDL issuances. However, in our view, most of this effect is now captured in the relatively flat spread between longer duration government bonds versus 3 - 5 year maturities. Apart from medium term central government fiscal dynamics and the very large annual bond maturities that we have referred to before, there are near term factors to consider as well, in our view. First, SDL undershoots have been very significant year to date (almost of the same order as the total undershoot last year) and it is possible that from here on there is better adherence to issuance calendar. Two, long tenor corporate bond supply has picked up including hybrid issuances from banks. Three, banks have been aggressive sellers of government bonds over the past month or so; presumably guided both by better valuation as well as the need to draw down their 'excess' investment books somewhat, in light of the sharp spike in incremental credit to deposit ratio (however, this doesn't solve the system level problem as). It must be noted that the extension given on the current higher held to maturity (HTM) limits for banks is not expected to have any material positive impact on incremental demand for duration but will rather help manage the unwind back to a lower 19.5% limit better. Finally, while we are at or close to peak policy rates, there is no visibility yet on when and how many rate cuts down the line. In the meanwhile, and in light of dynamics mentioned here, a 100 bps or lesser term spread on 10 year versus overnight rate doesn't seem particularly exciting.
A final point needs mention to 'defend' our overweight 3 - 5 year government bond stance. The argument goes why 3 - 5 year government bonds when 1 year bank CDs are at 7.60%. This was made even when the two rates were the same, and continues now when CD rates are almost 40 - 50 bps higher. We summarise here the same counter-argument we have been making: The relative valuation of government bonds is basis other points on the government bond curve. Here 3 - 5 year government bonds remain approximately 20 - 35 bps higher than 1 year treasury bills. This is quite comfortable given that we are towards the top of the rate cycle. CD rates will importantly respond to evolving incremental credit to deposit ratios as well, and not just to overnight rates. This ratio is currently under pressure which is telling on bank CD rates. Thus the driver here is different and not directly comparable to the dynamics of the sovereign curve. Also, one is buying 3 - 5 year government bonds with a longer investment horizon in mind which may also consider re-investment risks beyond the 1 year horizon that bank CDs cannot plug.
The above said, and as a standalone investment strategy meant for shorter horizons (6- 12 months), we find money market rates generally approaching levels that are quite reasonable. However, bulk of their performance drivers may have to wait for the lean credit season starting April. The incremental credit to deposit ratio issue should have smoothened by then, both on account of seasonality (busy season to lean season) as well as owing to continued economic slowdown. But investors may have to start thinking about this in their allocation decisions from now over the next few months.


