IDFC Balanced Advantage Fund$
(previously known as IDFC Dynamic Equity Fund) An open ended dynamic asset allocation fund
IDFC Balanced Advantage Fund$
(previously known as IDFC Dynamic Equity Fund)
An open ended dynamic asset allocation fund
|
|
|
|
|

|


- 'Dynamically' invests between Equity and Debt
- An Equity fund that buys less when markets are expensive and more when markets are cheap
- Based on the model that tracks market valuation
 : ₹ 2,980.81 Crores
AUM or assets under management refers to the recent / updated cumulative market value of investments managed by a mutual fund or any investment firm.
: ₹ 2,966.49 Crores
AUM or assets under management refers to the recent / updated cumulative market value of investments managed by a mutual fund or any investment firm.
:
An employee of the asset management company such as a mutual fund or life insurer, who manages investments of the scheme. He is usually part of a larger team of fund managers and research analysts.
Debt Portion: Mr. Arvind Subramanian (w.e.f. 09th November 2015)
Other Parameter:
| Standard Deviation (Annualized)
Standard deviation is a statistical measure of the range of an investment's performance. When a mutual fund has a high standard deviation, its means its range of performance is wide, implying greater volatility. | 13.51% |
| Beta
Beta is a measure of an investment's volatility vis-a-vis the market. Beta of less than 1 means that the security will be less volatile than the market. A beta of greater than 1 implies that the security's price will be more volatile than the market. | 1.13 |
| R Square | 0.85 |
| Sharpe*
The Sharpe Ratio, named after its founder, the Nobel Laureate William Sharpe, is a measure of risk-adjusted returns. It is calculated using standard deviation and excess return to determine reward per unit of risk. | 0.59 |
| Modified Duration₤
Modified duration is the price sensitivity and the percentage change in price for a unit change in yield | 1.57 years |
| Average Maturity₤ | 1.81 years |
| Macaulay Duration₤ | 1.61 years |
| Yield to Maturity ₤
The Yield to Maturity or the YTM is the rate of return anticipated on a bond if held until maturity. YTM is expressed as an annual rate. The YTM factors in the bond's current market price, par value, coupon interest rate and time to maturity. | 4.77% |
| ₤ For debt allocation only | |
| Portfolio Turnover | |
| Equity | 0.23 |
| Aggregate^ | 3.82 |
| Total Expense Ratio | |
| Regular | 2.03% |
| Direct | 0.55% |
SIP (Minimum Amount): ₹ 100/-(Minimum 6 instalments)
SIP Frequency: Monthly
SIP Dates (Monthly): Investor may choose any day of the month except 29th, 30th and 31st as the date of instalment.
Investment Objective: Click here
Minimum Investment Amount : ₹ 5,000/- and any amount thereafter
Option Available: Growth, IDCW@ (Payout, Reinvestment and Sweep (from Equity Schemes to Debt Schemes only))
:
Exit load is charged at the time an investor redeems the units of a mutual fund. The exit load is deducted from the prevailing NAV at the time of redemption. For instance, if the NAV is ₹ 100 and the exit load is 1%, the redemption price would be ₹ 99 per unit.
- For 10% of investment: Nil
- For remaining investment: 1% if redeemed/ switched out within 1 year from the date of allotment (w.e.f. July 5, 2017)
NAV (₹) as on February 28, 2022
| Regular Plan | Growth | 17.63 |
| Regular Plan | IDCW@ | 12.96 |
The equity exposure of the scheme's portfolio will be determined as follows:
| PE Bonds | Equity Allocation |
|---|---|
| <12 | 90 - 100 |
| 12 - 16 | 75 - 90 |
| 16 - 19 | 65 - 75 |
| 19 - 22 | 55 - 65 |
| 22 - 26 | 40 - 55 |
| >26 | 30 - 40 |
The balance will be invested in debt and money market securities.
Bloomberg Nifty P/E data as of 28th February 2022
indicates a value of 22.15 and Equity band for the
month of March will be 40-55%.
| Name | Rating | % of NAV |
| Equity and Equity related Instruments | 68.10% | |
| Net Equity Exposure | 55.58% | |
| Software | 10.42% | |
| oInfosys | 5.31% | |
| Infosys - Equity Futures | -0.95% | |
| Larsen & Toubro Infotech | 1.73% | |
| MphasiS | 1.53% | |
| Coforge | 1.19% | |
| Tata Consultancy Services | 1.00% | |
| Tata Consultancy Services - Equity Futures | -0.16% | |
| Wipro | 0.78% | |
| Tech Mahindra | 0.69% | |
| Tech Mahindra - Equity Futures | -0.69% | |
| Banks | 9.03% | |
| oICICI Bank | 5.43% | |
| ICICI Bank - Equity Futures | -1.09% | |
| oHDFC Bank | 3.02% | |
| State Bank of India | 1.48% | |
| Axis Bank | 0.48% | |
| Axis Bank - Equity Futures | -0.48% | |
| Suryoday Small Finance Bank | 0.19% | |
| Finance | 7.16% | |
| oBajaj Finance | 3.39% | |
| Cholamandalam Invt and Fin Co | 1.79% | |
| HDFC | 1.57% | |
| HDFC - Equity Futures | -0.86% | |
| Muthoot Finance | 1.15% | |
| Mas Financial Services | 0.11% | |
| Pharmaceuticals | 2.81% | |
| oDivi's Laboratories | 2.85% | |
| Divi's Laboratories - Equity Futures | -1.47% | |
| Gland Pharma | 0.88% | |
| IPCA Laboratories | 0.55% | |
| Retailing | 2.73% | |
| Avenue Supermarts | 1.54% | |
| Zomato | 0.57% | |
| FSN E-Commerce Ventures | 0.39% | |
| Vedant Fashions | 0.23% | |
| Auto Ancillaries | 2.65% | |
| Minda Industries | 1.05% | |
| Jamna Auto Industries | 0.62% | |
| Tube Investments of India | 0.61% | |
| Endurance Technologies | 0.37% | |
| Cement & Cement Products | 2.61% | |
| UltraTech Cement | 1.70% | |
| UltraTech Cement - Equity Futures | -0.29% | |
| JK Cement | 0.82% | |
| Ambuja Cements | 0.38% | |
| Consumer Non Durables | 2.34% | |
| oHindustan Unilever | 2.15% | |
| Hindustan Unilever - Equity Futures | -1.15% | |
| Godrej Consumer Products | 1.08% | |
| Godrej Consumer Products - Equity Futures | -0.19% | |
| Nestle India | 0.45% | |
| Index | 2.26% | |
| oNifty 50 Index - Equity Futures | 2.26% | |
| Consumer Durables | 2.19% | |
| Bata India | 0.89% | |
| Titan Company | 0.72% |
| Name | Rating | % of NAV |
| Voltas | 0.57% | |
| Petroleum Products | 2.06% | |
| oReliance Industries | 4.32% | |
| Reliance Industries - Equity Futures | -2.25% | |
| Industrial Products | 1.64% | |
| Carborundum Universal | 0.68% | |
| Shaily Engineering Plastics | 0.58% | |
| Bharat Forge | 0.47% | |
| Bharat Forge - Equity Futures | -0.43% | |
| Supreme Industries | 0.34% | |
| Chemicals | 1.18% | |
| SRF | 1.17% | |
| SRF - Equity Futures | -0.23% | |
| Clean Science and Technology | 0.25% | |
| Industrial Capital Goods | 1.17% | |
| ABB India | 0.70% | |
| Honeywell Automation India | 0.47% | |
| Healthcare Services | 1.07% | |
| oApollo Hospitals Enterprise | 2.54% | |
| Apollo Hospitals Enterprise - Equity Futures | -1.46% | |
| Telecom - Services | 1.02% | |
| oBharti Airtel | 3.02% | |
| Bharti Airtel - Equity Futures | -2.00% | |
| Auto | 0.92% | |
| Tata Motors | 0.92% | |
| Insurance | 0.92% | |
| Bajaj Finserv | 1.79% | |
| Bajaj Finserv - Equity Futures | -0.88% | |
| Paper | 0.50% | |
| Century Textiles & Industries | 0.50% | |
| Pesticides | 0.32% | |
| PI Industries | 0.52% | |
| PI Industries - Equity Futures | -0.20% | |
| Construction | 0.31% | |
| PNC Infratech | 0.31% | |
| Financial Technology (FINTECH) | 0.26% | |
| PB Fintech | 0.26% | |
| Government Bond | 14.65% | |
| 5.63% - 2026 G-Sec | SOV | 8.33% |
| 8.35% - 2022 G-Sec | SOV | 2.72% |
| 5.22% - 2025 G-Sec | SOV | 2.00% |
| 7.17% - 2028 G-Sec | SOV | 1.60% |
| Certificate of Deposit | 6.68% | |
| Axis Bank | A1+ | 5.00% |
| Bank of Baroda | A1+ | 1.68% |
| Corporate Bond | 3.78% | |
| Reliance Industries | AAA | 1.71% |
| Power Finance Corporation | AAA | 0.86% |
| NABARD | AAA | 0.69% |
| REC | AAA | 0.51% |
| NTPC | AAA | 0.01% |
| Treasury Bill | 3.70% | |
| 364 Days Tbill - 2022 | SOV | 3.70% |
| Commercial Paper | 1.67% | |
| HDFC | A1+ | 1.67% |
| Net Cash and Cash Equivalent | 1.43% | |
| Grand Total | 100.00% | |
| oTop 10 Equity Holdings |
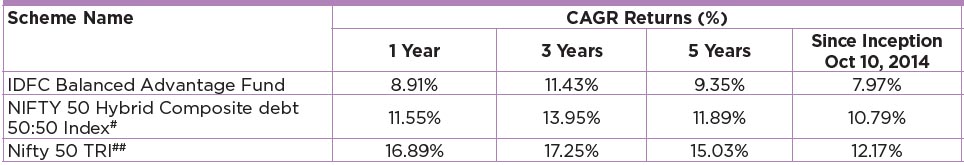
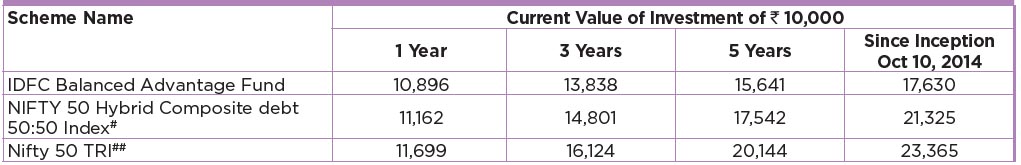
Performance based on NAV as on 28/02/2022. Past performance may or may not be sustained in future.
The performances given are of regular plan growth option.
Click here for other funds managed by the fund manager and refer to the respective fund pages
#Benchmark Returns. ##Alternate Benchmark Returns.
Scheme risk-o-meter
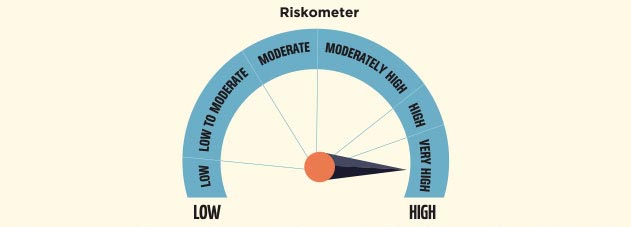
Investors understand that their principal will be at Very High risk
This product is suitable for investors who are seeking*
- To create wealth over long term.
- Dynamic allocation towards equity, derivatives, debt and money market instruments.
* Investors should consult their financial advisers if in doubt about whether the product is suitable for them.
Benchmark risk-o-meter
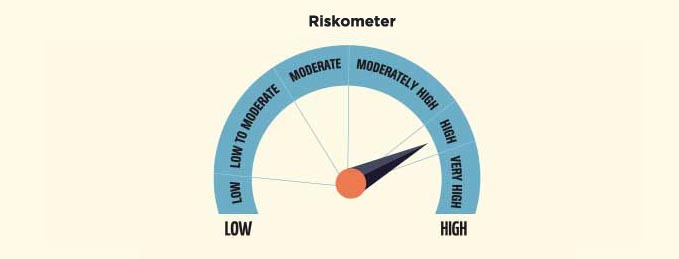
NIFTY 50 Hybrid Composite debt 50:50 Index
Regular and Direct Plans have different expense structure. Direct Plan shall have a lower expense ratio excluding distribution expenses, commission expenses etc.
*Risk-free rate assumed to be 3.43% (FBIL OVERNIGHT MIBOR as on 28th February 2022). Ratios calculated on the basis of 3 years history of monthly data.
^Portfolio Turnover ratio is calculated as Lower of purchase or sale during the period / Average AUMfor the last one year (includes Fixed Income securities and Equity derivatives).
The portfolio will be rebalanced within the first three working days of the next month.
The fund has been repositioned from a Nifty linked fund to an open banded fund w.e.f. June 19, 2017.
$"IDFC Dynamic Equity Fund" has been renamed as "IDFC Balanced Advantage Fund" with effect from May 03, 2021.Refer the addendum issued in this regard, in the Download center i.e. https://idfcmf.com/download-centre/notices
Equity portion: Arpit Kapoor managed this scheme up to 28th February 2022. W.e.f. from 1st March 2022 Sachin Relekar will be managing this scheme.
