Commentary

Commentary
|
|
|
|
|

|


Global Markets
Global equities declined by 2.7% in February. The stock market is not only in correction, it is already in
bear market territory without a recession in sight. On the valuation side, S&P 500 post-pandemic rerating
has almost been completely erased with PE now only 0.5x higher vs. pre-pandemic level when rates
were more restrictive and fundamentals were less supportive. Markets have been volatile recently and
sentiment dour as investors grapple with monetary policy normalization and geopolitical risks. Escalation
of geopolitical tensions over the past few days has materially increased the risk of further aggravating
the energy and commodity crisis developing over the past 2 years. Potential trade disruptions of oil, gas,
grains and metals is now a significant risk for investments and the real economy.
While India decoupling is in theory, markets still suffer when the Fed has a sore throat or China sneezes. The world is preparing for a Central Bank balance sheet contraction, while the China impact is already being felt in prices of steel, iron ore etc. Crude is swaying to the Russian ballet, as Putin blows hot and blows cold.
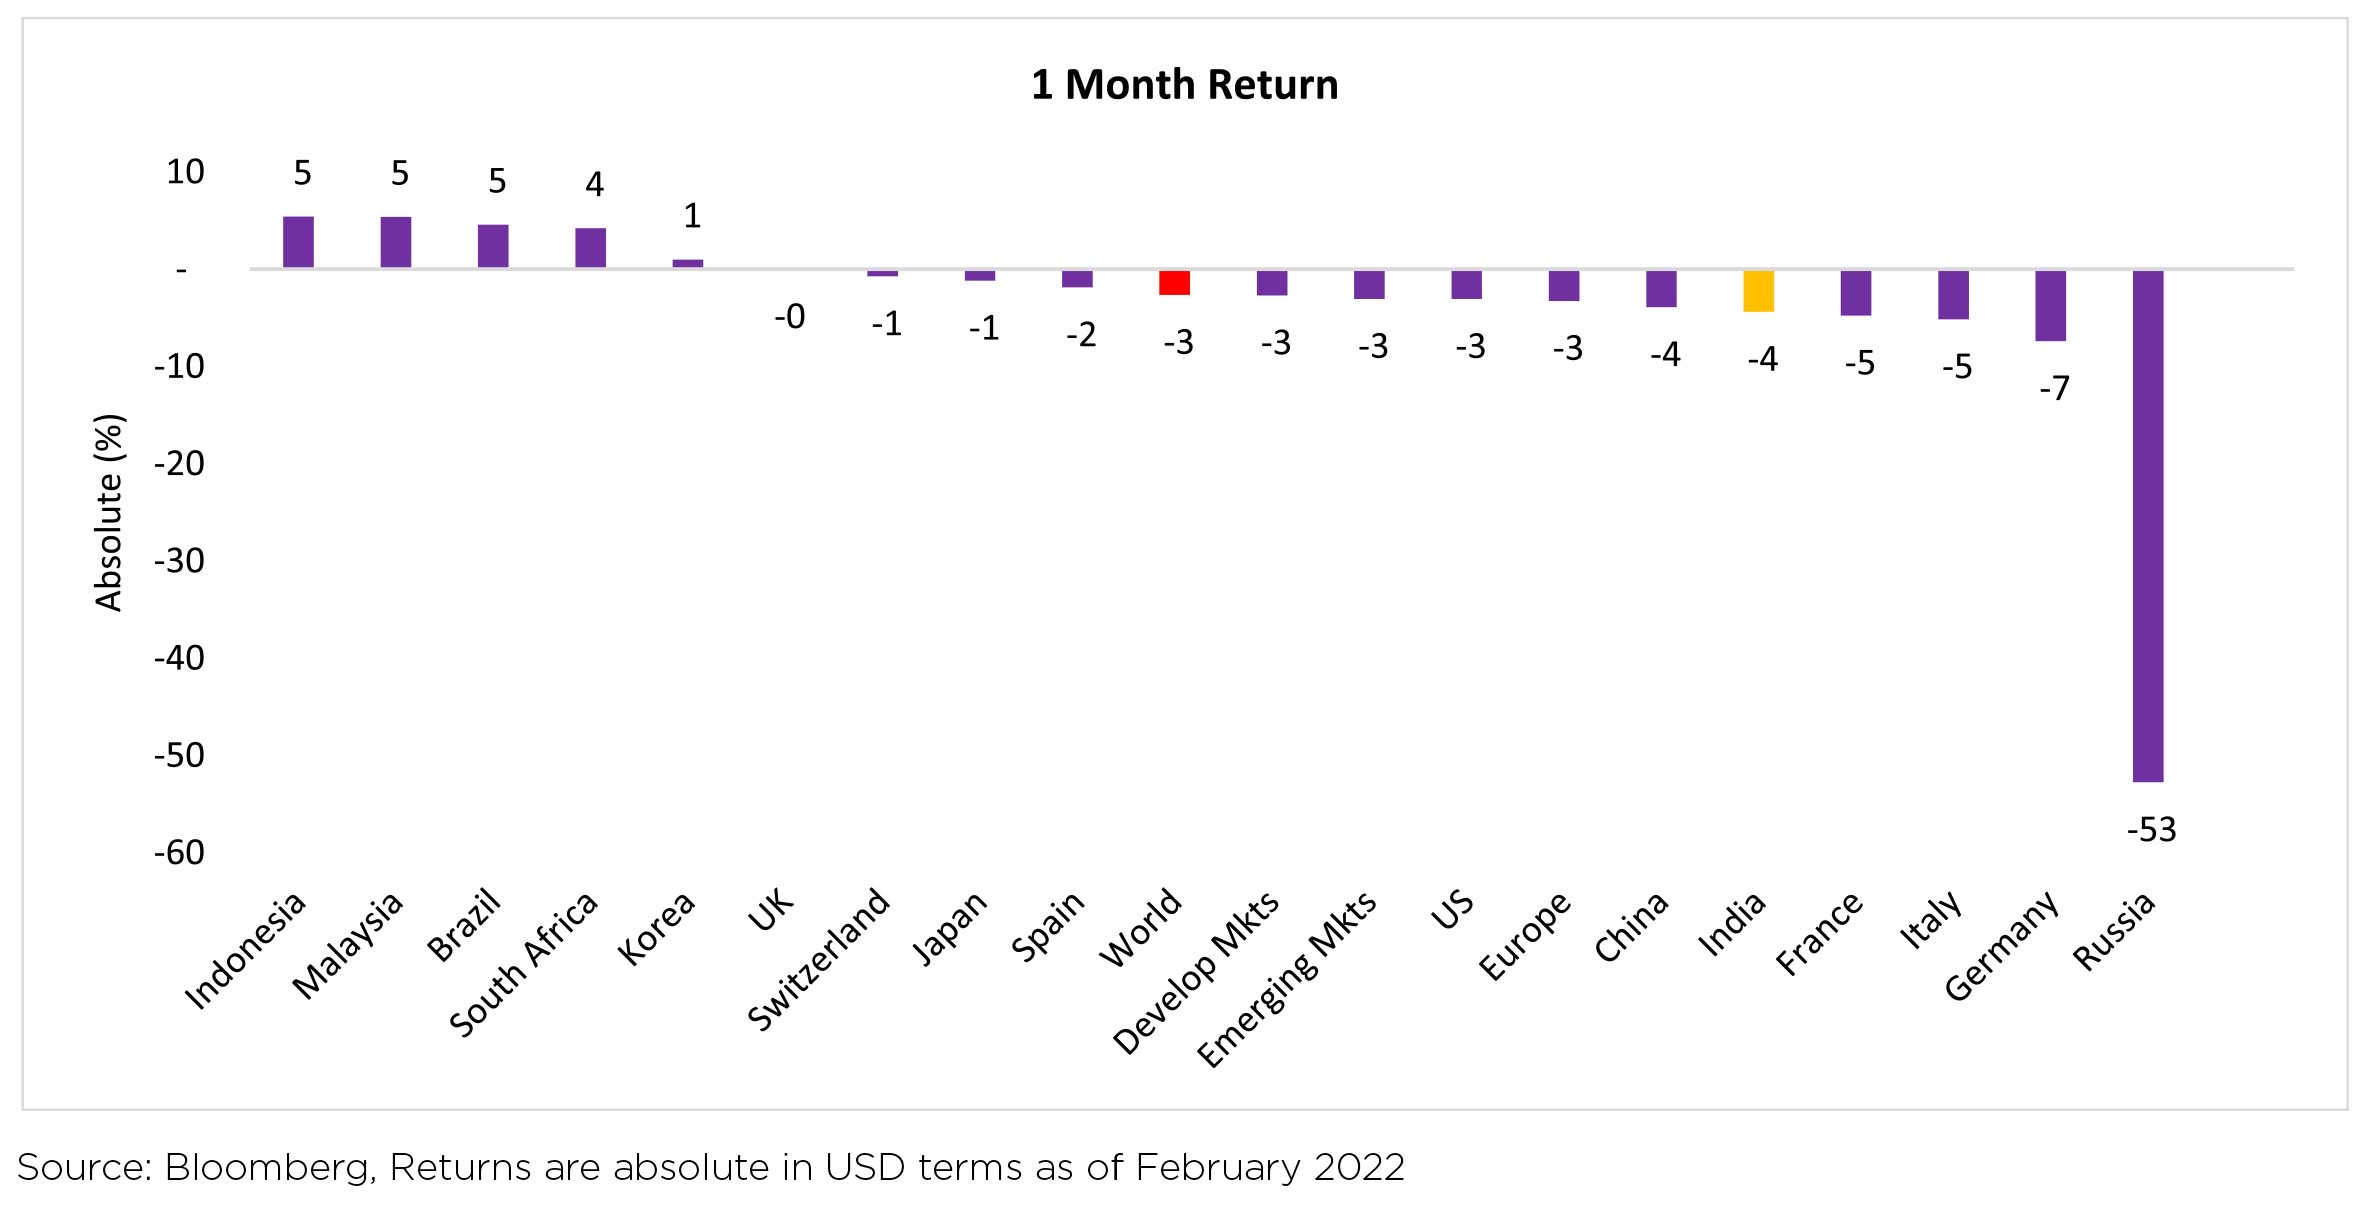
MSCI India (in local currency) was down by 3.2% over the month. Indian markets reacted to the geopolitical
crisis as the Nifty (-3.2% MoM) ended the month below the 16,800 level.
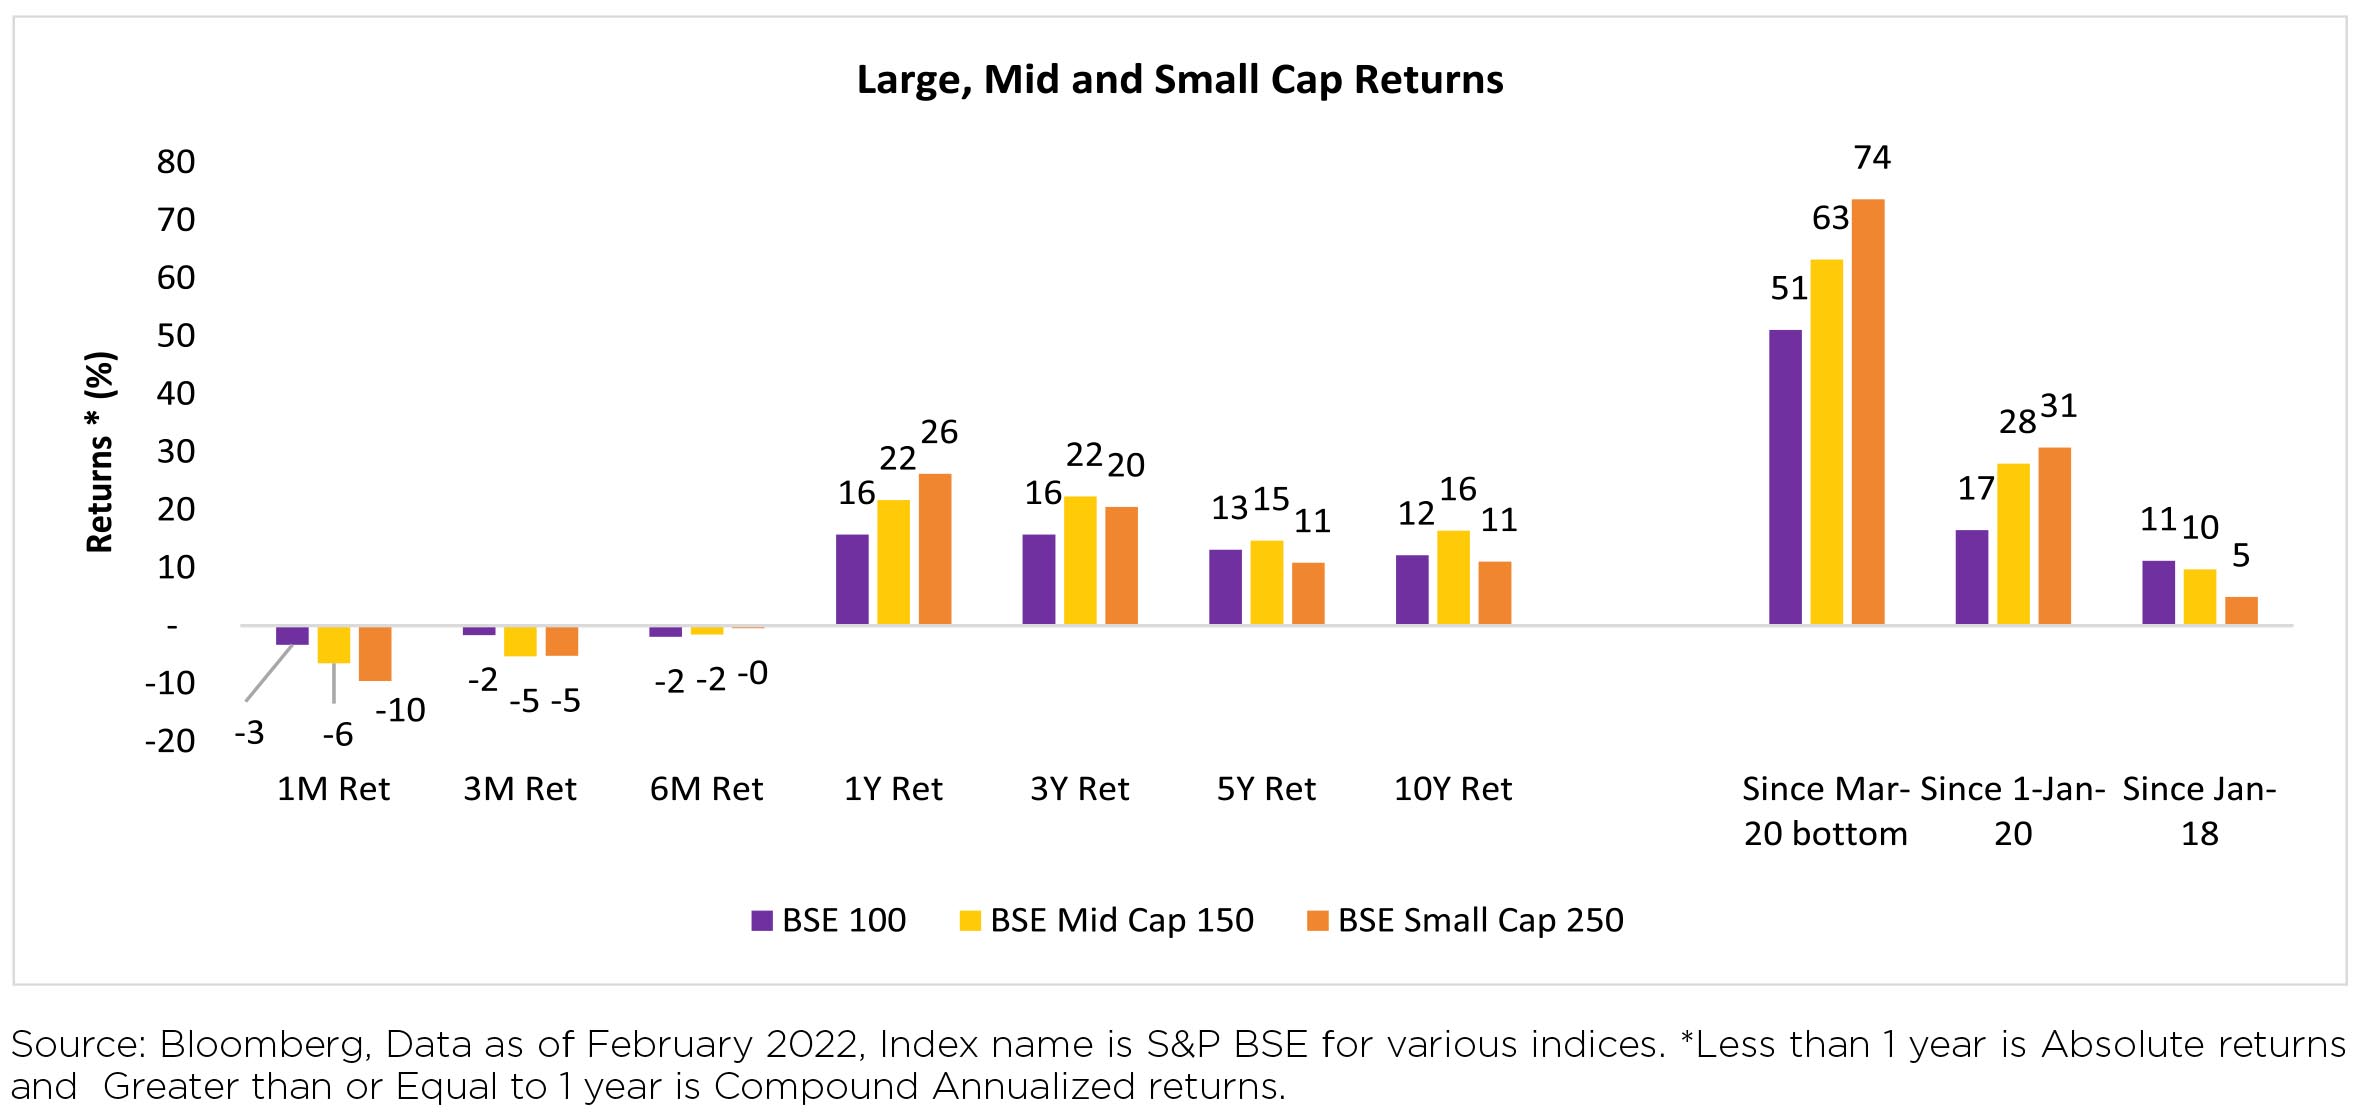
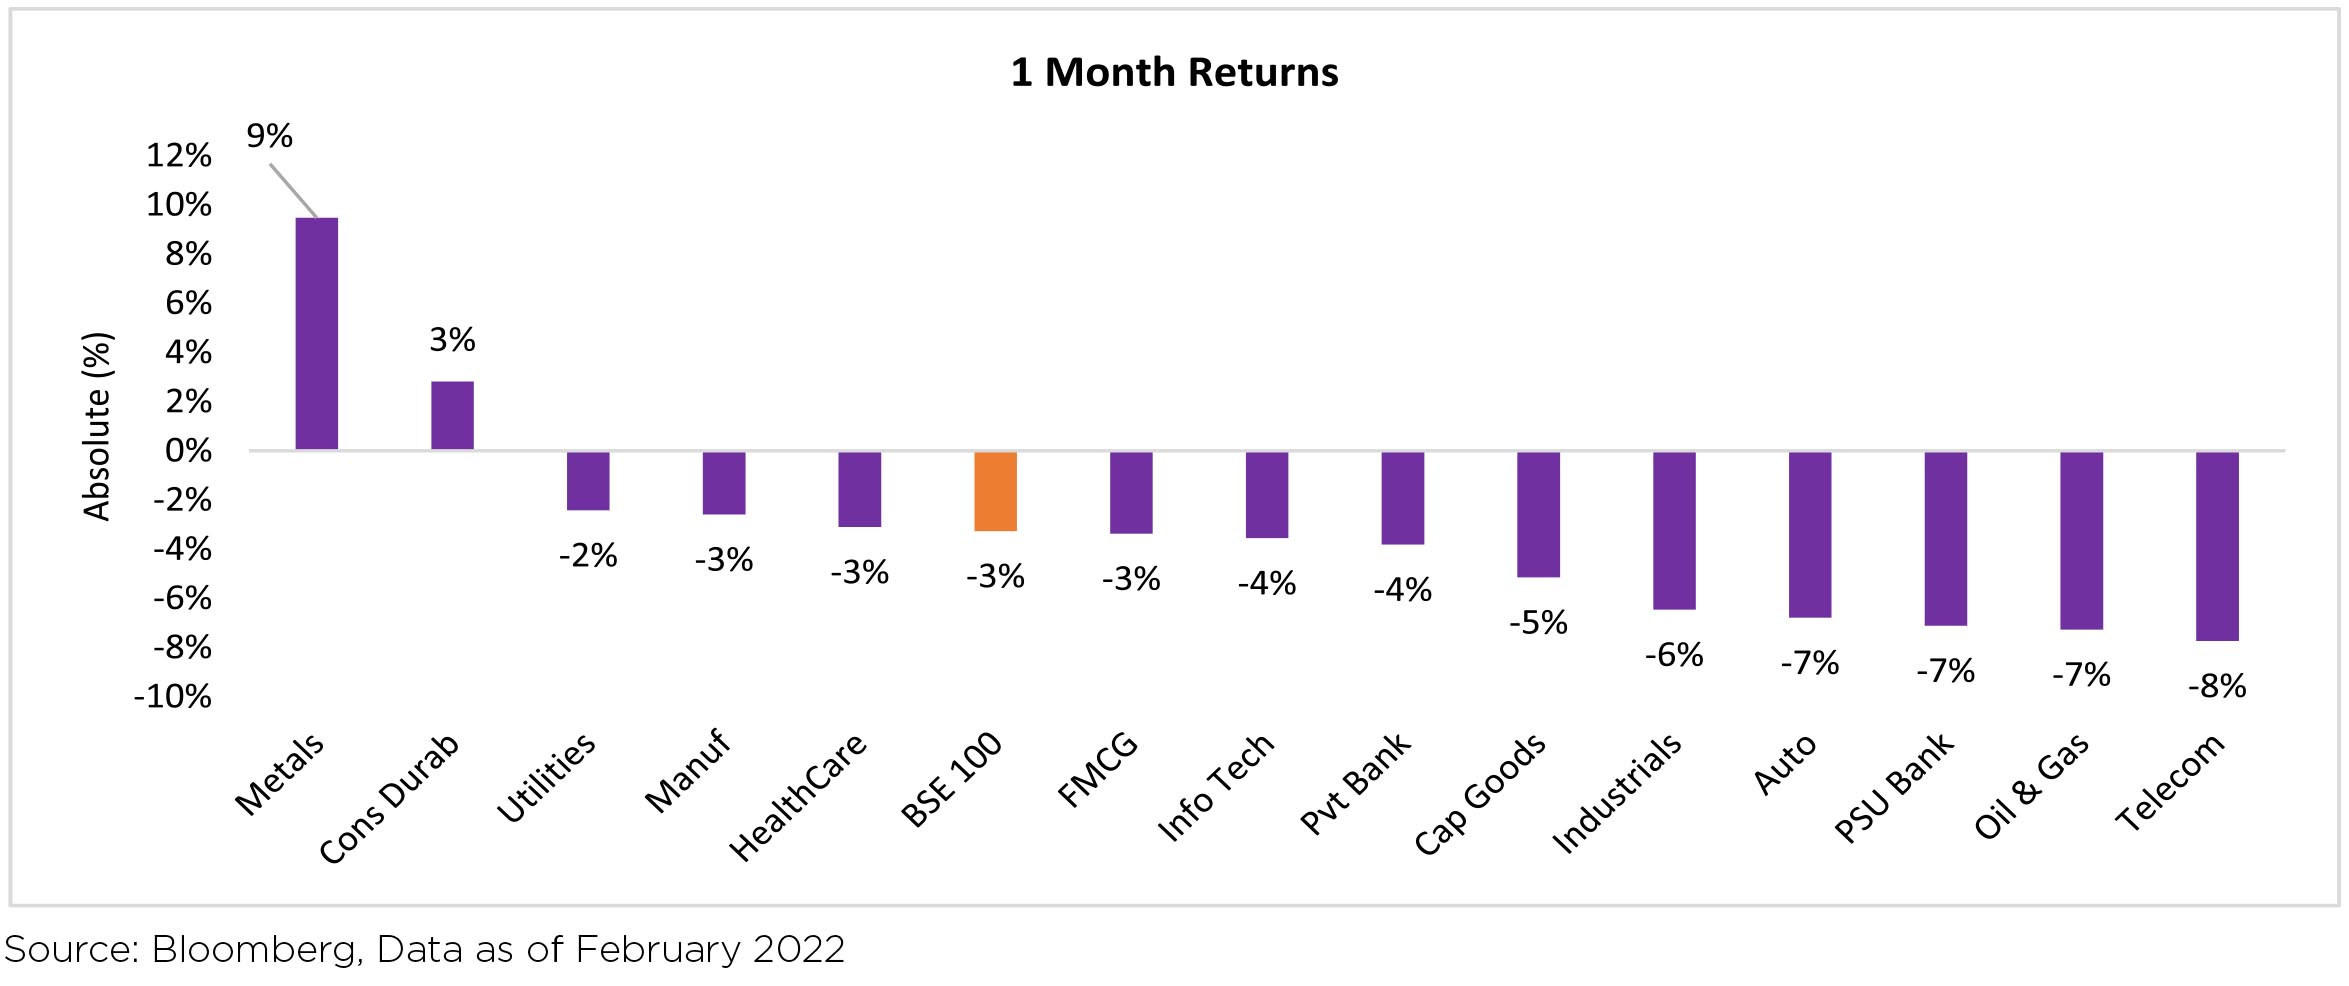
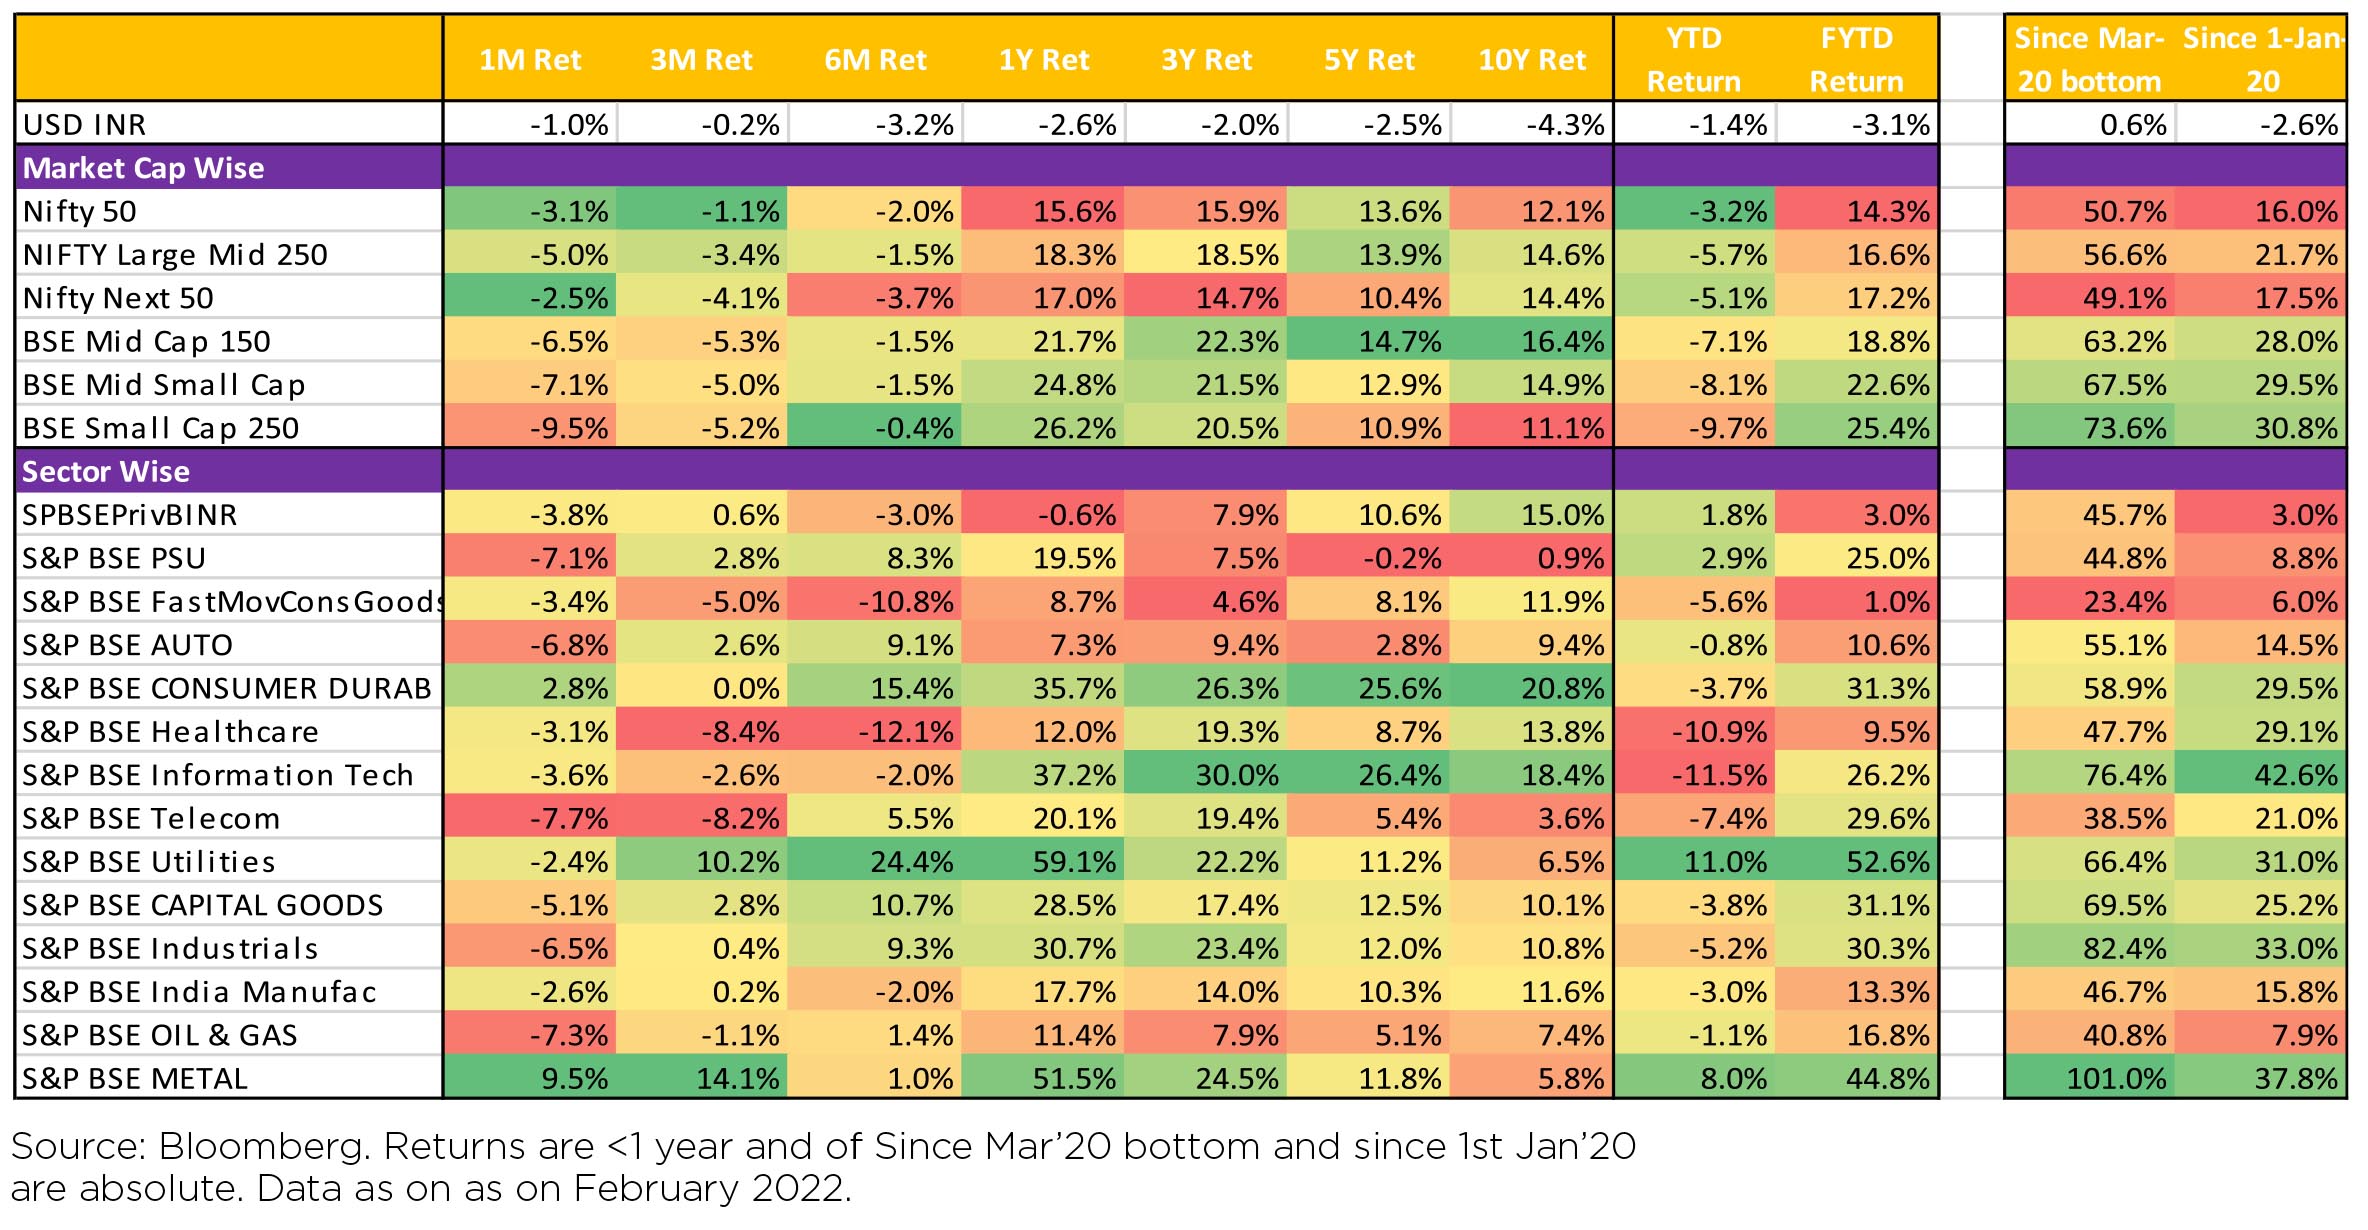
Indian equities declined 4.1% ($ terms) trading lower than broader markets in February (MSCI APxJ/ EM: -1.4%/-3.1%). Performance of both mid-caps (-4.9% MoM) and small caps (-8.7% MoM) was weaker than large caps (-4.3%). All sectors ended the month in the red (barring Materials) with Communication Services, Financials and Consumer Discretionary being the major laggards.
INR was down 1% MoM, reaching ~75.34/USD in February. DXY gained +0.2% over the month.
Performance of major commodities:
Oil prices continued their momentum from the previous month, gaining 10.9% in February. Oil prices are now steadily on the rise. Notably, every $10/bbl increase in crude oil price widens the fiscal deficit by Rs. 206bn (10.5bps) on account of oil subsidy on Kerosene & LPG. It also increases pump prices by Rs. 5 per litre and CPI by 60-70bps.
Parity Prices: Indian steel HRC prices now at Rs 4,050/5,580 per tonne discount to China and Korea as export prices continues to increase. Indian HRC export FoB prices remained flat at US$ 867/t.
Macro prints were mixed:
The RBI maintained its accommodative stance, keeping rates on hold. Macro prints were mixed:
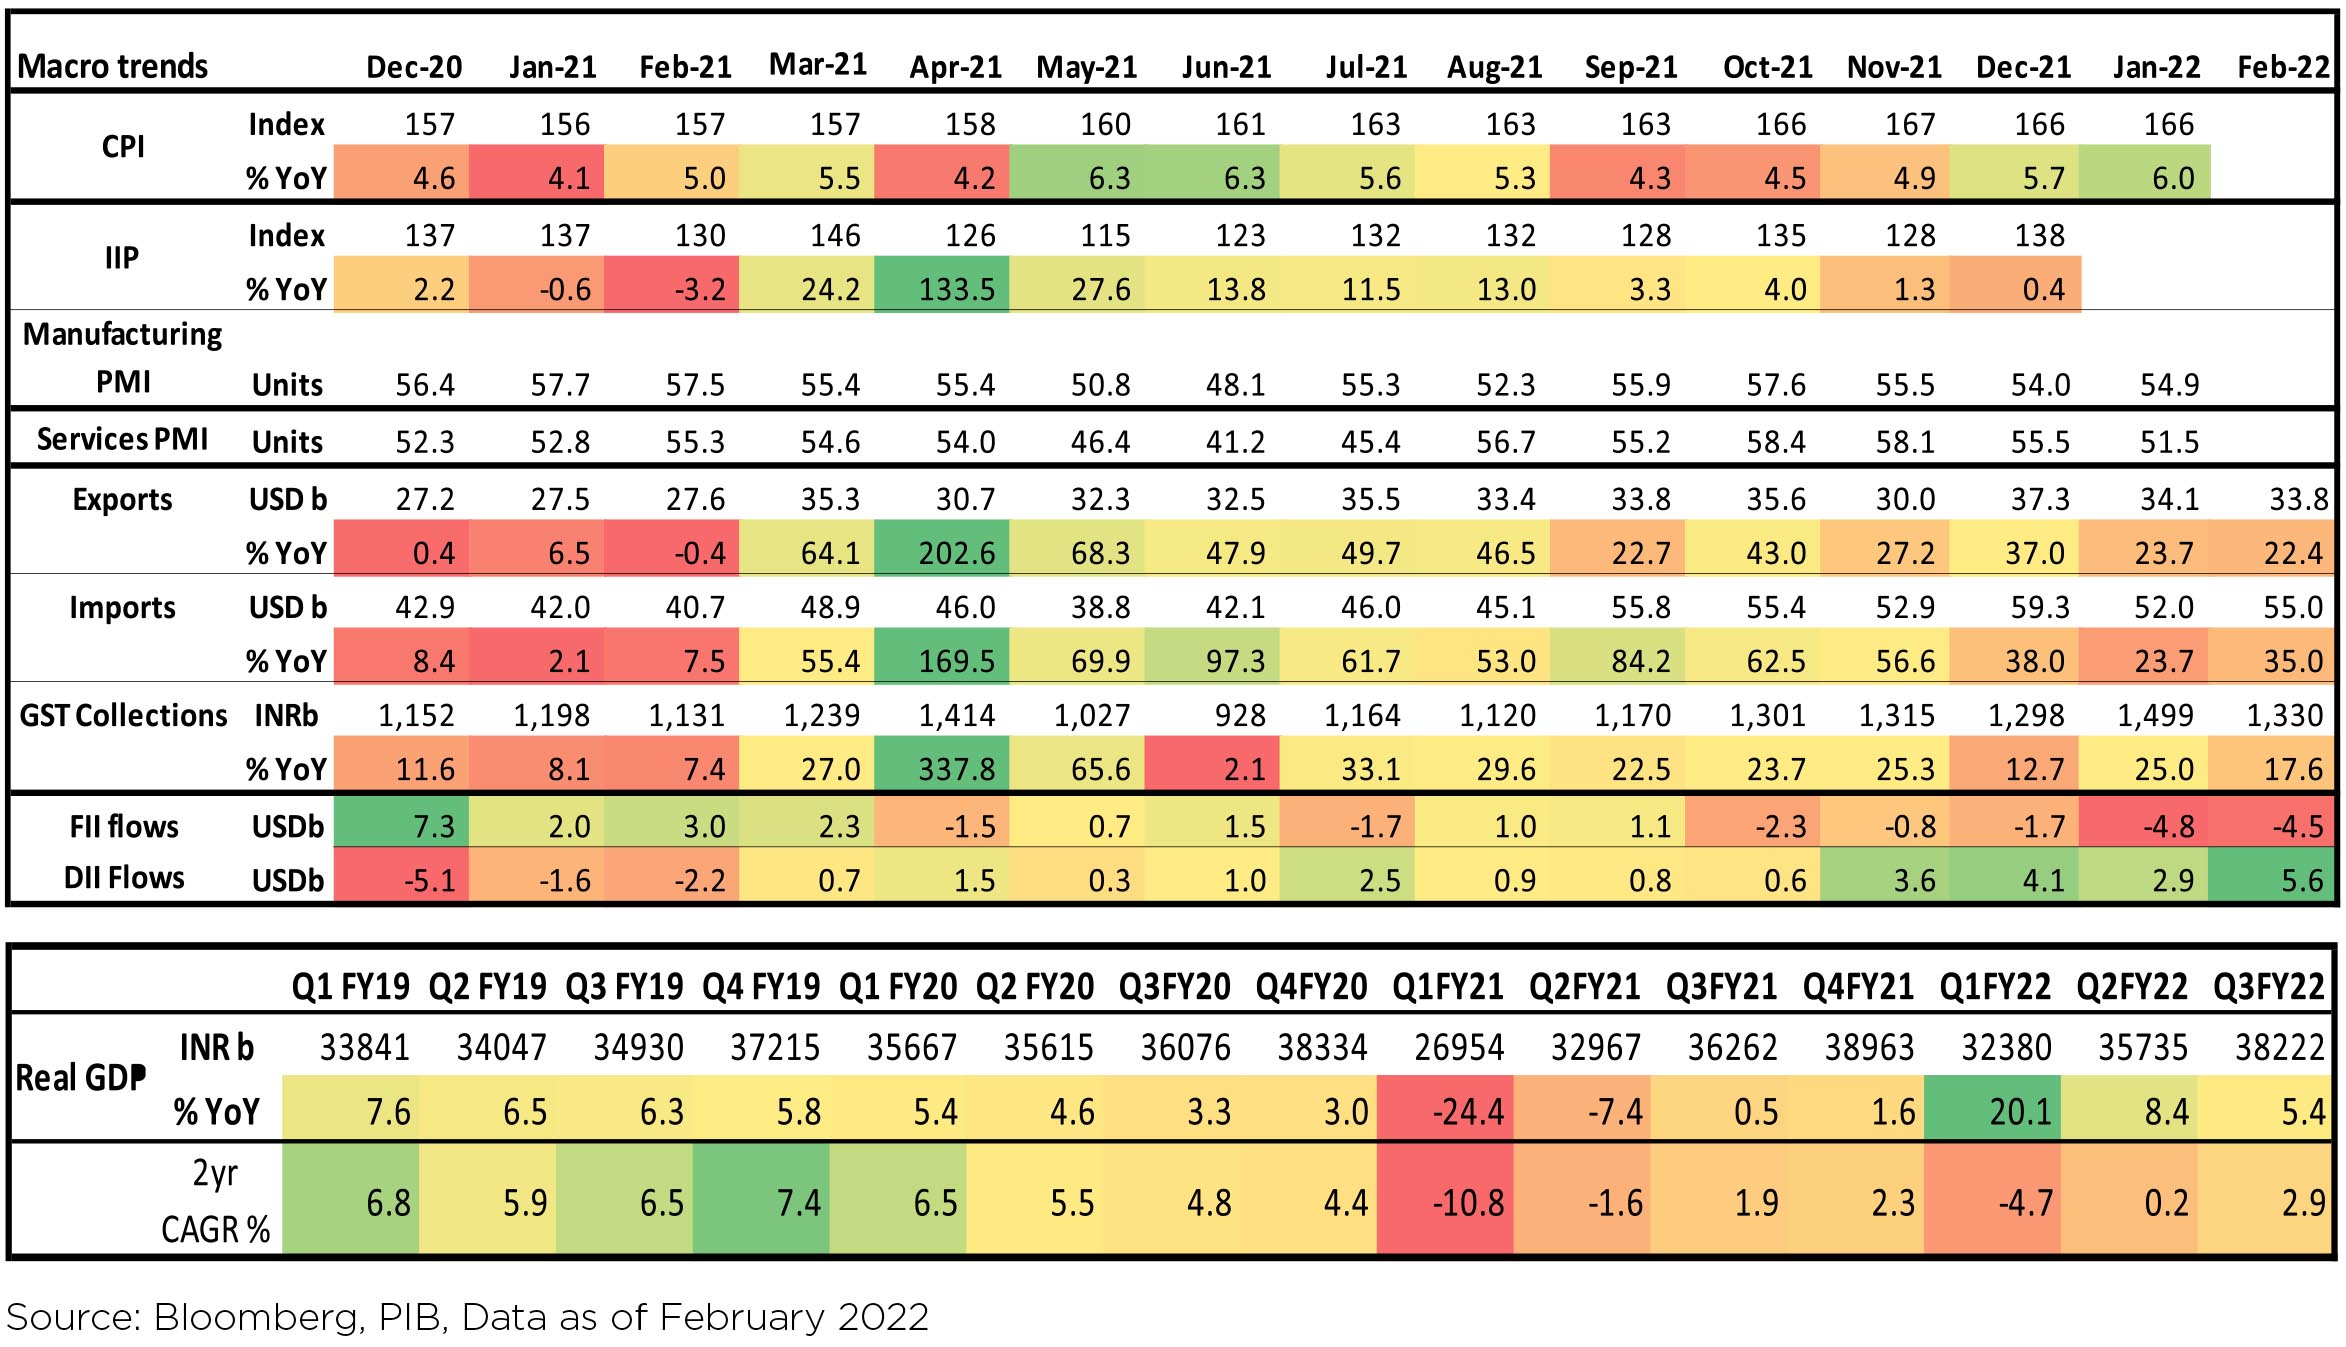
► January CPI came in at 6% - at a 7-month high, reflecting both firm sequential momentum and fading away of favorable base effects from previous months. Corporates continued to take price hikes, which kept the non-food inflation high at 6.4% in Jan'22.
► December's Industrial Production continued to disappoint (+0.4% YoY; +0.3% MoM), indicating muted demand pressures and more confirmation of a plateauing goods recovery in recent months.
► Q3FY22 GDP growth came in at 5.4% YoY led by slowdown in economic activity. Some moderation is to be expected after V-shaped bounce back from COVID 2.0 in September.
► Benchmark 10-year treasury yields averaged at 6.76% in February (15bps higher vs. the January average). On month-end values, the 10Y yield was up and ended the month at 6.77% (up 9bps MoM).
FIIs continued to remain net sellers of Indian equities in February (-$4.5bn, following -$4.8bn in January) - 5th consecutive month of net equity outflows for FIIs. DIIs recorded inflows of $5.6bn in February, maintaining the buying trend observed since March 2021. Mutual funds and Insurance funds were both net buyers.
While India decoupling is in theory, markets still suffer when the Fed has a sore throat or China sneezes. The world is preparing for a Central Bank balance sheet contraction, while the China impact is already being felt in prices of steel, iron ore etc. Crude is swaying to the Russian ballet, as Putin blows hot and blows cold.
Domestic Markets
Indian equities declined 4.1% ($ terms) trading lower than broader markets in February (MSCI APxJ/ EM: -1.4%/-3.1%). Performance of both mid-caps (-4.9% MoM) and small caps (-8.7% MoM) was weaker than large caps (-4.3%). All sectors ended the month in the red (barring Materials) with Communication Services, Financials and Consumer Discretionary being the major laggards.
INR was down 1% MoM, reaching ~75.34/USD in February. DXY gained +0.2% over the month.
Performance of major commodities:
Oil prices continued their momentum from the previous month, gaining 10.9% in February. Oil prices are now steadily on the rise. Notably, every $10/bbl increase in crude oil price widens the fiscal deficit by Rs. 206bn (10.5bps) on account of oil subsidy on Kerosene & LPG. It also increases pump prices by Rs. 5 per litre and CPI by 60-70bps.
Parity Prices: Indian steel HRC prices now at Rs 4,050/5,580 per tonne discount to China and Korea as export prices continues to increase. Indian HRC export FoB prices remained flat at US$ 867/t.
Macro prints were mixed:
The RBI maintained its accommodative stance, keeping rates on hold. Macro prints were mixed:
► January CPI came in at 6% - at a 7-month high, reflecting both firm sequential momentum and fading away of favorable base effects from previous months. Corporates continued to take price hikes, which kept the non-food inflation high at 6.4% in Jan'22.
► December's Industrial Production continued to disappoint (+0.4% YoY; +0.3% MoM), indicating muted demand pressures and more confirmation of a plateauing goods recovery in recent months.
► Q3FY22 GDP growth came in at 5.4% YoY led by slowdown in economic activity. Some moderation is to be expected after V-shaped bounce back from COVID 2.0 in September.
► Benchmark 10-year treasury yields averaged at 6.76% in February (15bps higher vs. the January average). On month-end values, the 10Y yield was up and ended the month at 6.77% (up 9bps MoM).
FIIs continued to remain net sellers of Indian equities in February (-$4.5bn, following -$4.8bn in January) - 5th consecutive month of net equity outflows for FIIs. DIIs recorded inflows of $5.6bn in February, maintaining the buying trend observed since March 2021. Mutual funds and Insurance funds were both net buyers.
Market Performance
Other highlights of the week included:
► Skymet's prediction of a normal monsoon in India in 2022 within the normal range of 96% to 104% of the long period average
► India's Green Hydrogen Policy announced with some incentives for potential manufacturers, generation companies (gencos) and distribution licensees (discoms) to boost large scale indigenous production of green hydrogen, so as to de-carbonize the energy sector and reduce India's heavy dependence on fossil fuels and crude oil imports.
Q3FY22 Results Takeaways:
Domestically, the focus was on December quarter earnings. S&P BSE All Cap stocks (~840 stocks) delivered 25% YoY PAT growth in Q3FY22 (94% of this was on account of Financials/Energy/Materials - with PSU Banks/NBFCs benefitting from a low base). PAT growth for the remaining sectors slowed to 4% YoY from strong double-digit growth previously.
Q3 saw companies bear the real brunt of the inflationary cost scenario. Most manufacturing led sectors like Auto, Cement, Engineering, Consumer Durables, Chemicals and Pharmaceuticals were impacted due to their inability to pass on input costs as they precariously balance tepid demand with price increases.
Global commodities made their presence felt across sectors, ranging from higher pet coke prices affecting cement companies to semiconductor shortages impacting auto companies. High crude prices did not help either. With consumption slowing in the economy, causing a chain reaction on the demand chain, it trickled into Steel and Cement EBIDTAs. Likewise, Pharma companies also saw the cost impact coupled with further price pressure in key markets like the US.
FMCG not only had to battle the rising commodity costs but also got outflanked by a slowing rural demand. However, there are green shoots, with the strong rabi sowing and the opening up of the economy following the Omicron variant, which should soften the concerns in the medium term.
The Services sector on the other hand performed relatively well, especially BFSI and IT services. It was yet another quarter of loan growth with NIM expansions. On the balance sheet side, asset quality improved with solid recoveries. Similarly, IT services had a good quarter along with good deal wins and pipeline, despite December being a furlough quarter.
Market Performance
Outlook
Q3 FY22 results have been largely encouraging, demand remained strong while EBIDTA margin has
compressed largely on account of the inflation across commodities. However, lower finance costs and
robust cash generation has boosted profitability. Indian corporates, including Banks, enter FY23 with the
strongest balance sheet probably since FY12.Near term worries post the Ukraine-Russia conflict have stoked fears of further dislocation in supply chain, especially gas, key industrial Metals and Agri Commodities. As a result, commodity prices have soared, with Brent crossing $110/barrel levels. This could affect inflation in the coming months. In this context, a swift resolution to peace could be critical, as levers to boost supply of these commodities from RoW remain limited. The ferocity of the move in inflation could dampen investor sentiments.
Another related development has been the suspension of Russia from key global indices and stoppage of trading of Russian stocks listed on global exchanges. Could such a move benefit other EMs like India? Frankly, we don't know. However, the numbers (which could be re-allocated to other EMs, arising from fresh flows) are appealing. Moreover, given the negative trend of FII flows since Apr'21, any let up in selling from FIIs would be viewed positively.
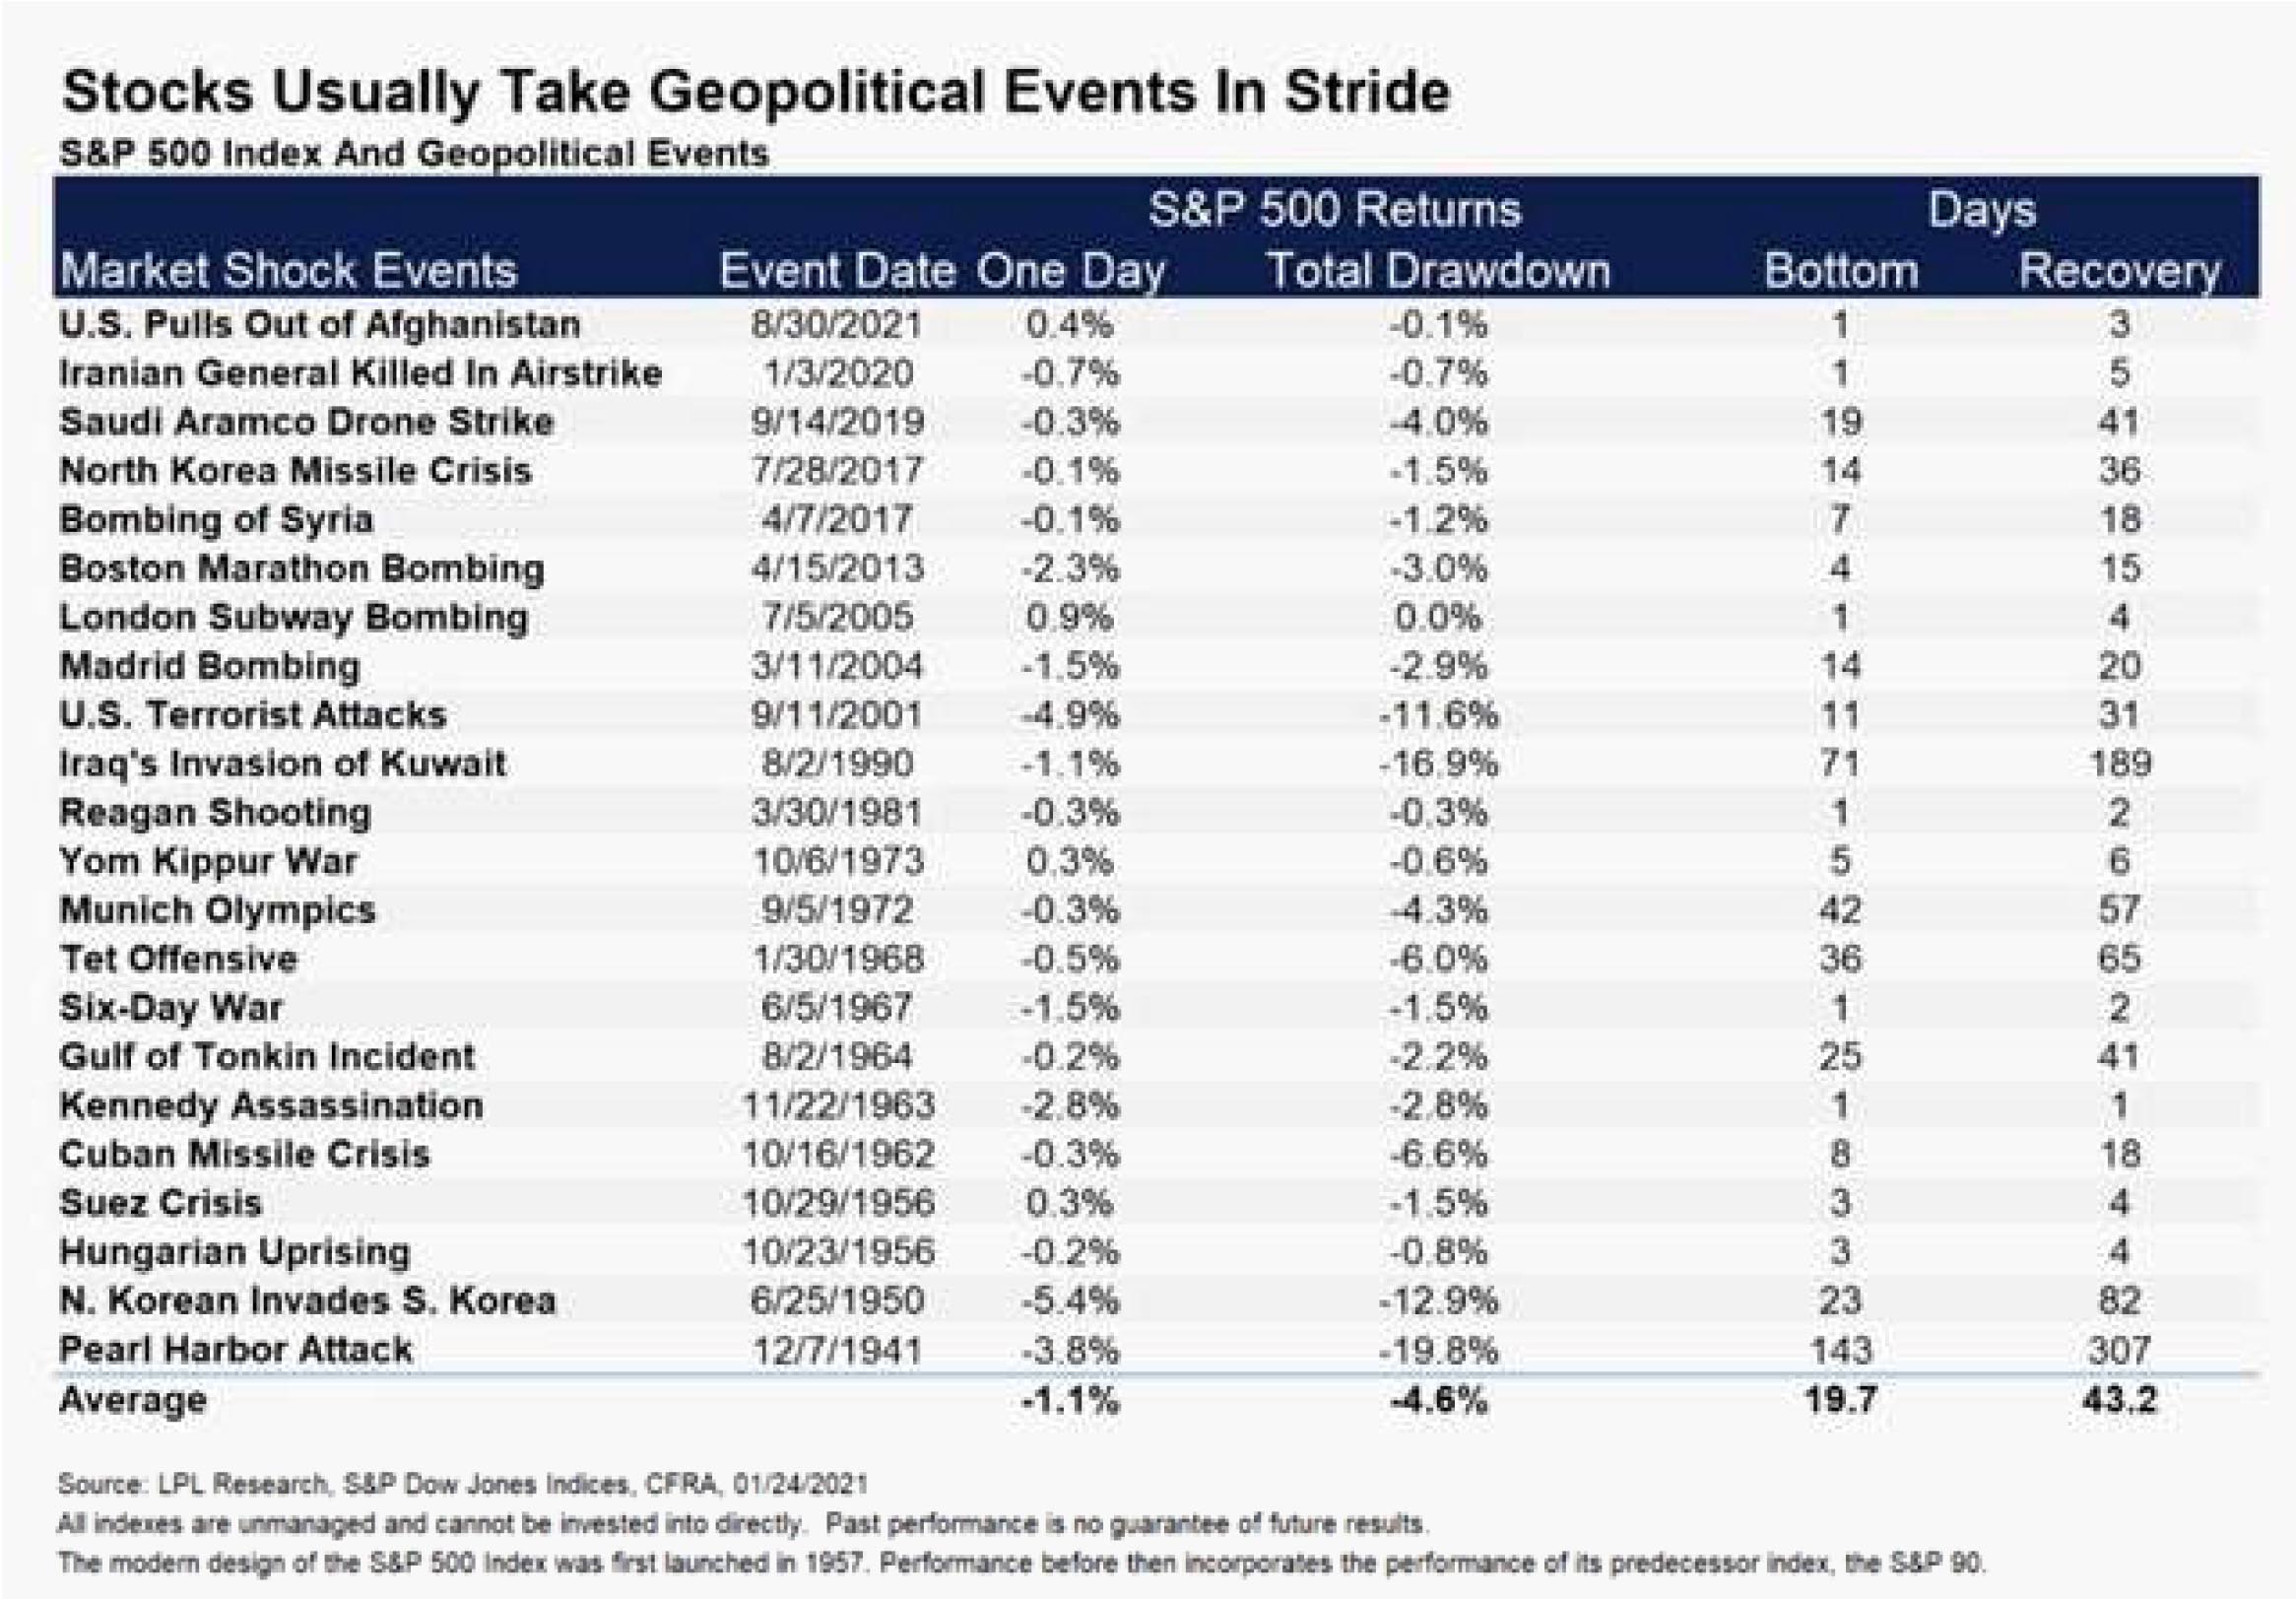
For equity investors, conflicts and wars have been phases of mixed emotion - during the crisis, regret of being fully invested (RoFI) and once past the crisis, regret of missed opportunities (FOMO). Looking back, continuing with one's equity investments through such crisis generally has been the ideal strategy - Mutual Fund Sahi hai! For investors, the key message should be… "time in the market rather than timing the market."
Note: The above graph is for representation purposes only and should not be used for the development or implementation of an investment strategy. Past performance may or may not be sustained in the future.
What Went By
The Russia-Ukraine war has caused an increase in prices of several commodities, particularly of crude oil. Price
of India's crude oil basket, which averaged USD 74 per barrel during April 2021-January 2022 and was close
to USD 90 per barrel at end-January, was USD 126 per barrel on 07th March. The impact on inflation, current
account deficit and fiscal balance wil be crucial, depending on how long prices stay elevated and the policy
response, but the impact on domestic and global growth will also have to be taken into consideration.
Central government gross tax revenue in January stayed strong, but there was an IGST disbursement and devolution to states was higher as in November 2021. Expenditure was buoyant but capex needs to be quite high in the remaining two months to meet the FY22 revised estimate from the union budget. During April 2021 to January 2022, net tax revenue was 88% of FY22RE (vs. 77% and 74% of actuals in FY19 and FY20 respectively) while total expenditure was 75% of FY22RE (vs. 87% and 84% of actuals in FY19 and FY20 respectively). FY22 fiscal deficit till January 2022 was only 59% of FY22RE (vs. 119% and 106% of actuals in FY19 and FY20 respectively). GST collection during February was strong, albeit a bit lower than in January, at Rs. 1.33 lakh crore and 17.6% y/y.
India's real GDP in FY22 is estimated to grow 8.9% y/y, down from 9.2% as per the first advance estimate released in January 2022. This comes after 3.7% in FY20 and -6.6% in FY21. FY22 private consumption expenditure in nominal terms is estimated to grow 14.6% over FY20 (pre-pandemic year) but, in real terms, it is estimated to grow only 1.2%.
Consumer Price Index (CPI) inflation was 6% y/y in January (up from 5.7% in December), despite the sequential moderation in food prices, due to unfavourable base effects. Momentum in core-CPI (CPI excluding food and beverages, fuel and light) picked up, although in year-on year terms it was flat at 6% in December and January. Core inflation has remained sticky at an average of 5.9% since April 2021.
Industrial production (IP) growth for December was 0.4% y/y and 0.7% m/m on a seasonally adjusted basis. Sequential momentum in IP was negative in three of the last five months. After a fall in output in November, output momentum in primary goods, infrastructure & construction goods and consumer durables turned positive in December, while that in capital goods, intermediate goods and consumer non-durables continued to stay negative. Infrastructure Industries output (40% weight in IP) in January was up 3.7% y/y and 0.9% m/m seasonally adjusted. Sequential output growth in crude oil, natural gas, petroleum products and fertilisers was negative.
Bank credit outstanding as on 11th February was up 7.9% y/y (average fortnightly credit growth since January 2022 has been 7.7%), while bank deposit growth was at 9.1%. Credit-flow to deposit-flow ratio from mid-April to each reported fortnight has been higher from January 2022, than in FY20 and FY21. Credit flow by sector stayed buoyant in January, although down from the higher year-end flows in December. During April 2021 to January 2022, overall bank credit flow was the highest for personal loans and lowest for industries.
Merchandise trade deficit picked up again to USD 21.2bn in February, after easing mildly to USD 17.4bn in January from USD 21.7bn in December. In February, imports picked up sequentially as oil and gold imports picked up while exports moderated. Non-oil-non-gold imports, which had been trending higher in recent months, eased a bit in January and February but remains elevated.
Among high-frequency variables, sequential change in motor vehicles registered has partly recovered since January after the sharp fall in December. Mobility indicators have improved from the Omicron-wave related fall in January. Number of weekly GST e-way bills generated have been healthy but flattish in the last few months. Energy consumption level has been sequentially improving since mid-January but has moved a bit sideways in the last few days and is currently close to levels during the same period in 2021.
In the US, headline and core CPI continued to move up and was at 7.5% y/y and 6% respectively in January (7.0% and 5.5% respectively in December). Price pressures were broad-based, with price momentum in food, housing and services in general being high. However, new and used vehicle prices moderated. US nonfarm payroll addition picked up to 678,000 persons in February and was very broad-based across sectors. Unemployment rate fell to 3.8% in February from 4% in January 2022. This is now close to the pre-pandemic rate of 3.5% in February 2020. Improvement in labour force participation rate has been more modest, with the latest reading at 62.3% vs. 63.4% in February 2020. Sequential growth in average hourly earnings eased after being strong for many months but growth in average weekly earnings picked up because average weekly hours worked increased.
Outlook
There have been two incremental developments of note in the Indian bond / money markets. First, banks have now become more accustomed to the new variable rate reverse repo (VRRR) regime. Consequently, both the volatility and the elevation in the overnight deployment rates have eased generally. Second, the market has loudly and clearly accepted RBI's unequivocal message with respect to its reaction function (no line of sight on actual meaningful lift to the effective overnight rates). A combination of these has led to reasonably strong demand in rates up to the 2 year point on the curve. While there has been some pressure lately on money market rates owing to a revised treasury bill calendar and stepping up of CD/CP issuances, these have been comfortably absorbed thus far. This market behavior has opened up the spread between 4 year and 2 year government bond yields to a comfortable 110 bps or so. In line with our often expressed view before, we believe that this spread is more 'playable' and can be looked at as providing some relative cushion to the 4 year yield. As against this the 75 bps spread between 10 year and 4 year is probably too thin and certainly cannot be played upon with any degree of certainty given the huge supply of duration lined up ahead.
We had gone significantly into cash / cash equivalents in our active managed bond and gilt funds around mid of February. We had mentioned valuations in relation to the aggressive Fed pivot, the heightened geopolitical risks, and local bond supply issues (https://idfcmf.com/article/7131). We had also reiterated that the underlying framework, including which tenor of bonds we prefer, remained largely the same. Since then yields in our preferred segment (4 - 5 years) have risen approximately 25 - 30 bps. This is despite the above two dovish developments mentioned, as geopolitical risks have fructified. We have also seen somewhat larger pressure in the 4 - 5 year segment thereby leading to some steepening versus 2 year and some flattening versus 10 year. This has further increased the appeal for the 4 - 5 year segment to us, relatively speaking.
In what may seem a somewhat counter-intuitive move in the midst of a very uncertain global narrative, we have redeployed most of the cash / cash equivalent in our actively managed bond and gilt funds. This is obviously not without risks, and embedded here is a hope that the very large commodity price swings witnessed over the past few days begin to calm down gradually. To be clear, we do believe that the 'floor prices' on various commodities is now higher than before and we still don't expect to make any mark-to-market gains given this and the large bond supply calendar ahead. However, as discussed many times before, the extra-ordinarily steep yield curve levies a very large penalty on running cash. The re-deployment of cash partly is in appreciation of this aspect, partly reflecting the sharp short period sell off in bonds in our preferred segment, and partly is the sum of the analysis presented above.
