Commentary

Global Markets
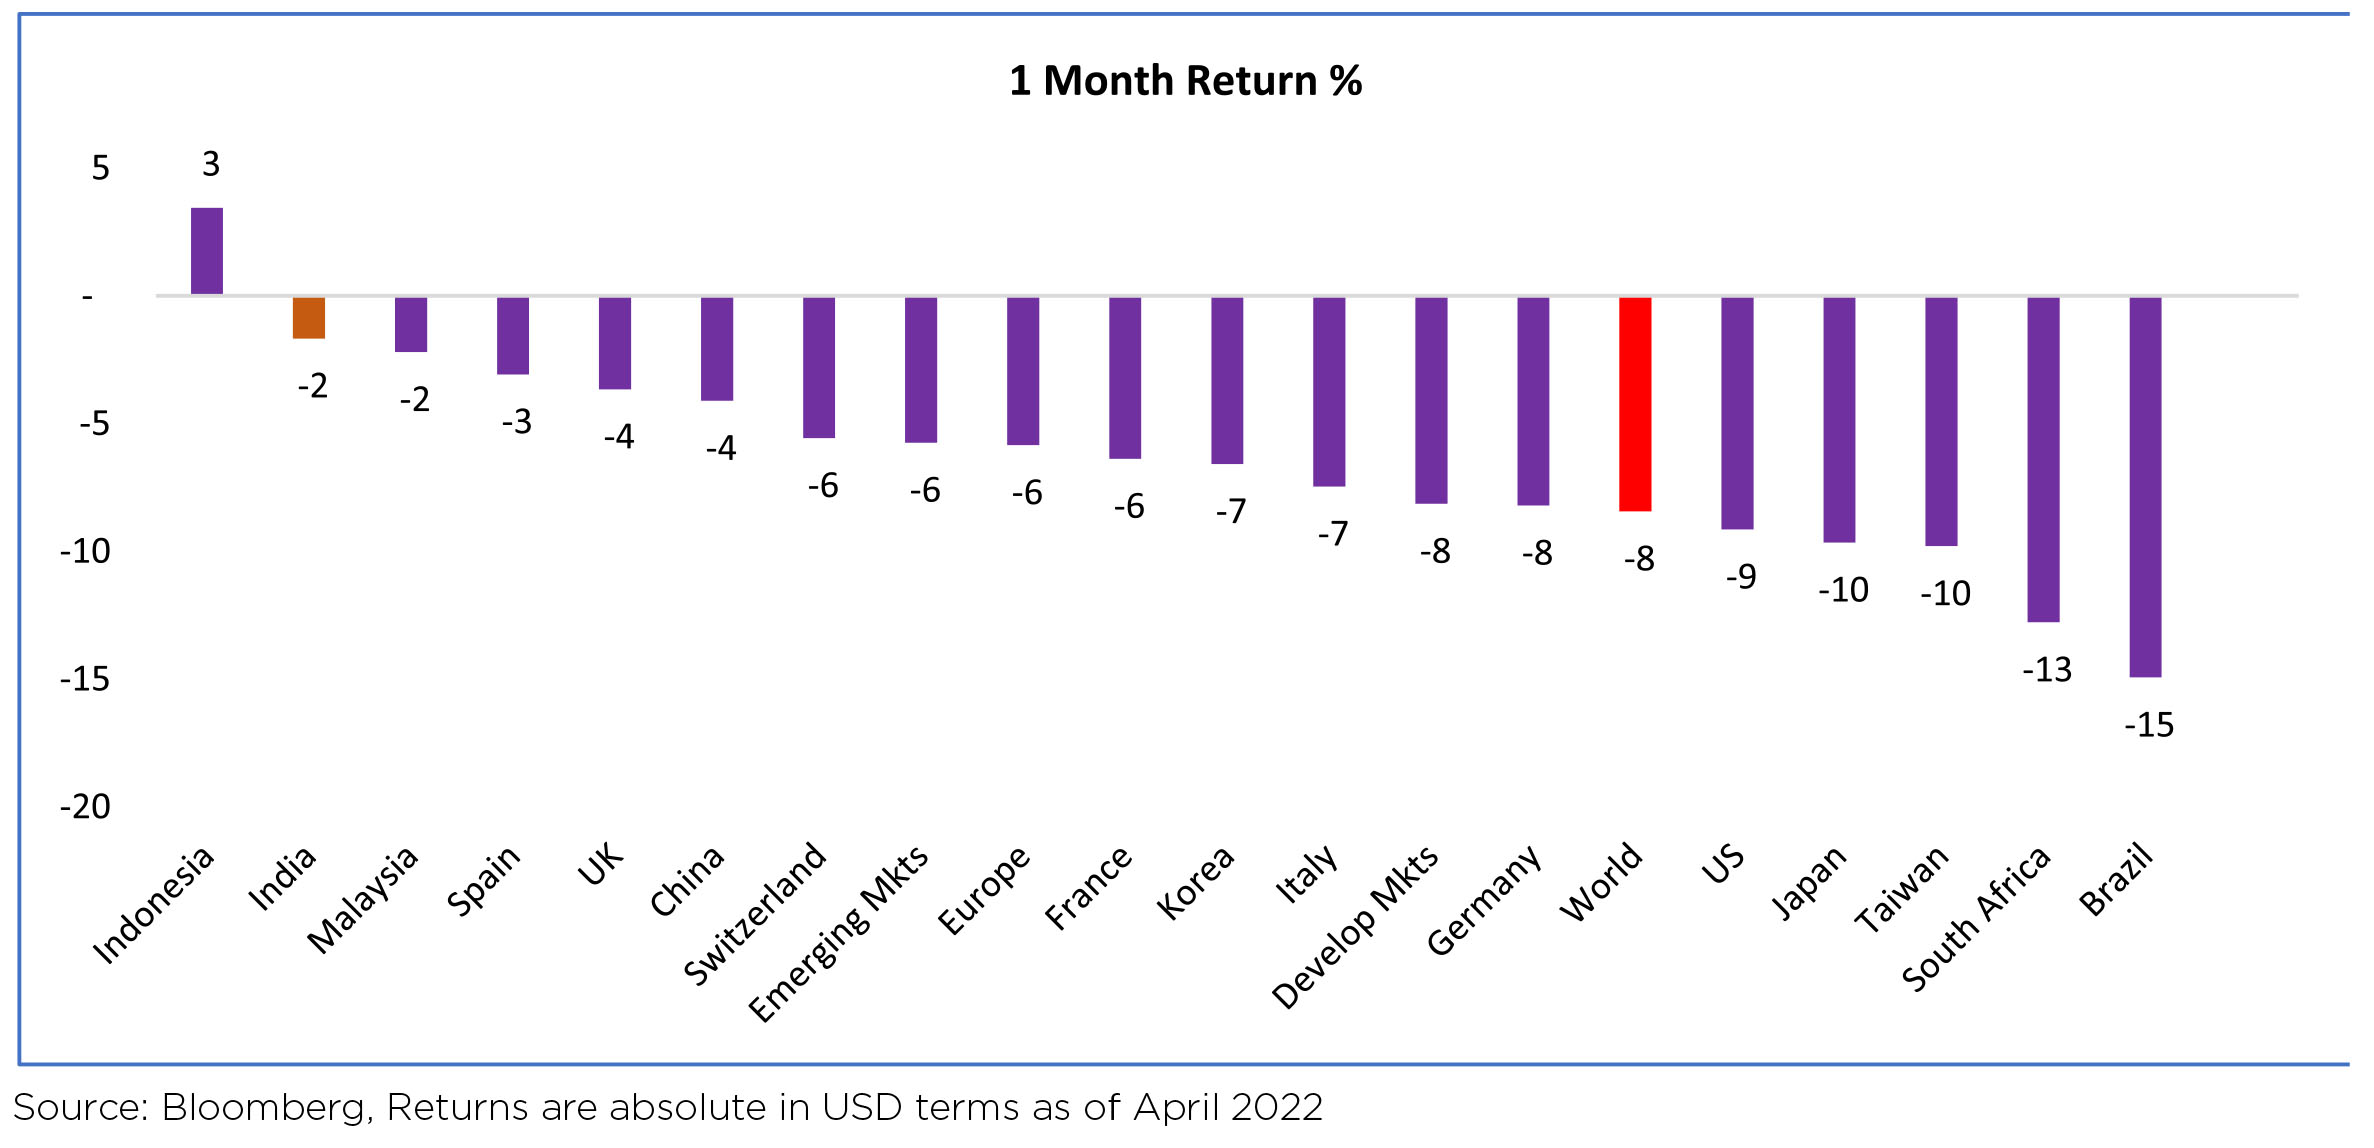
Global equities declined by 8.1% in April. Geopolitical crisis and policy tightening continue to remain an
overhang. Of the three key issues such as the commodity super-cycle, speculative bubbles in innovation/
renewables, and geopolitical risk for equities, we think strength in commodities will persist. whereas the
speculative bubbles have popped and geopolitical risk will likely moderate. Markets have been absorbing
significant macro and geopolitical shocks amid an aggressive central bank pivot.
MSCI India (in local currency) declined -0.8% over the month. Indian markets reversed some of the gains
made in March with NIFTY ending April lower (-2.07% MoM/ -1.45% YTD). Indian equities declined -0.8%
MoM ($ terms) trading higher than broader markets in April (MSCI APxJ/EM: -5.4%/-5.7%).
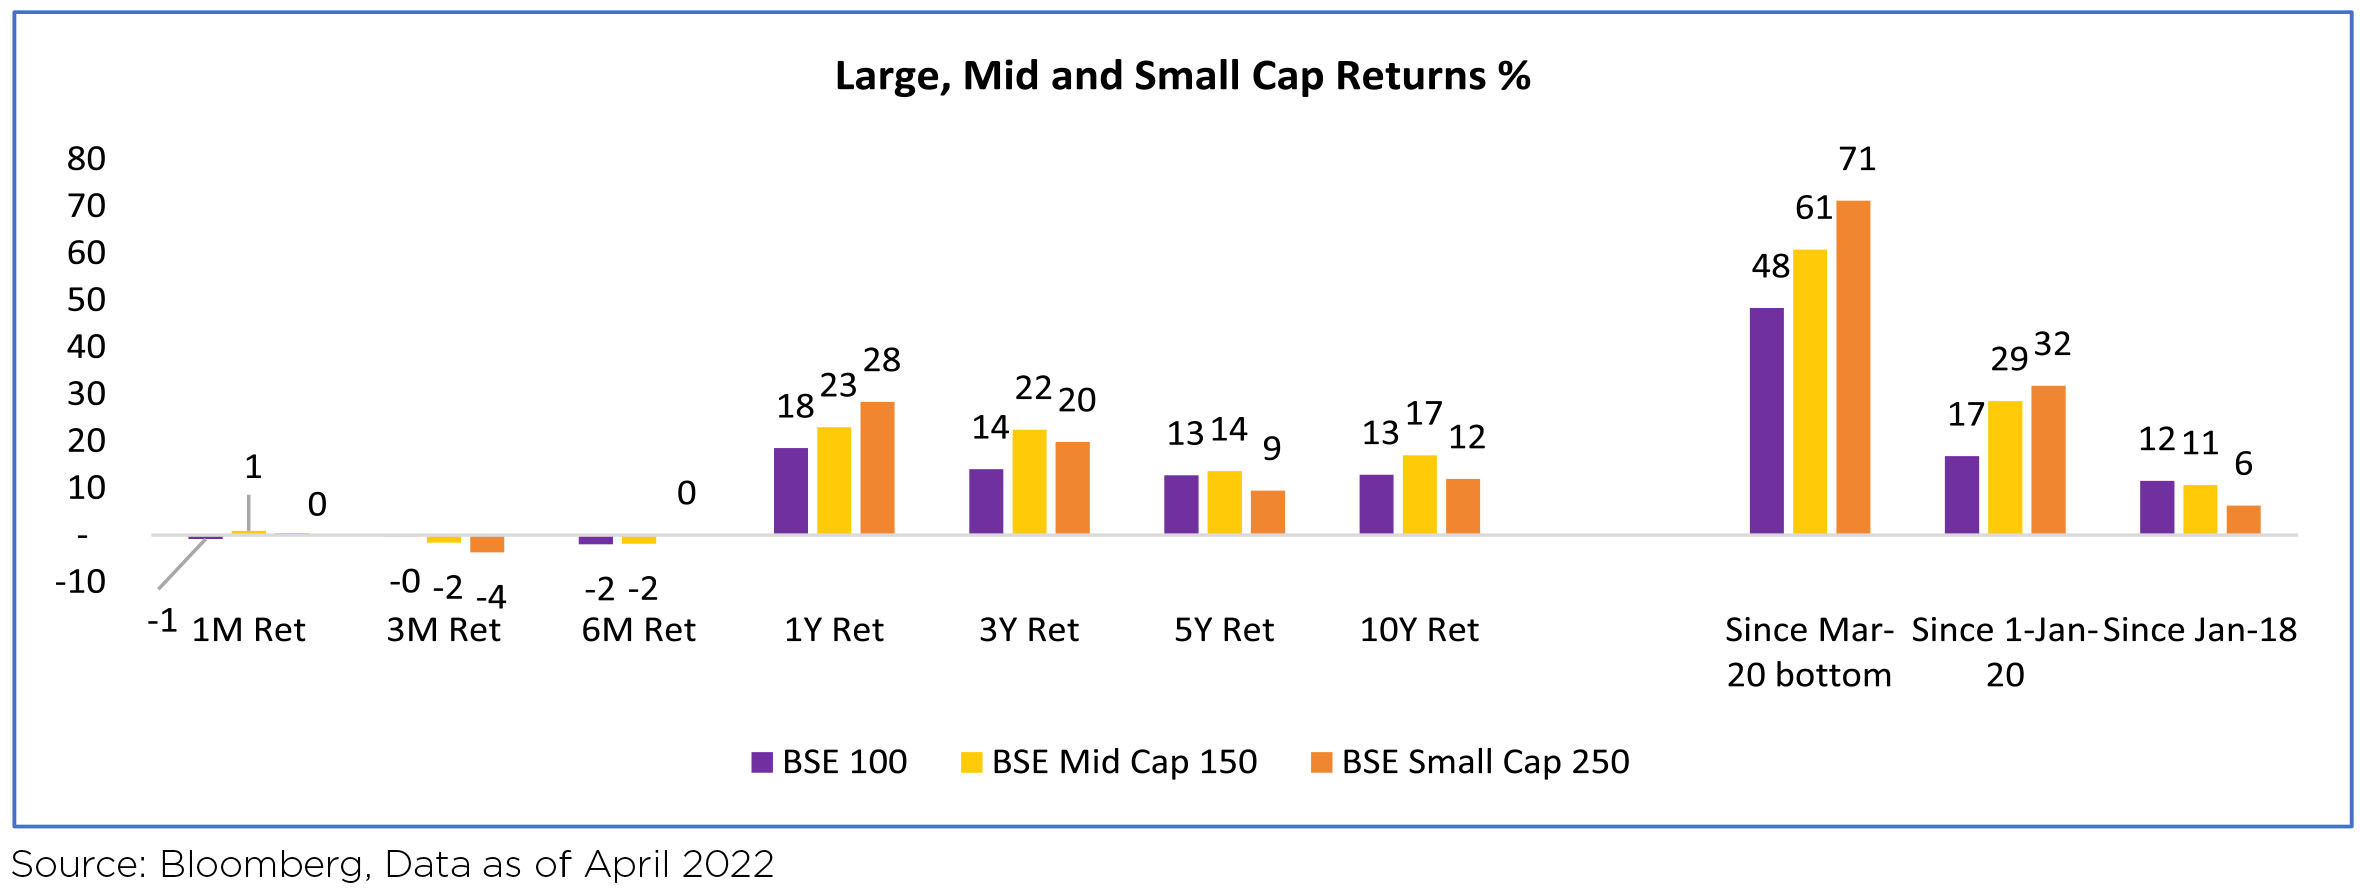
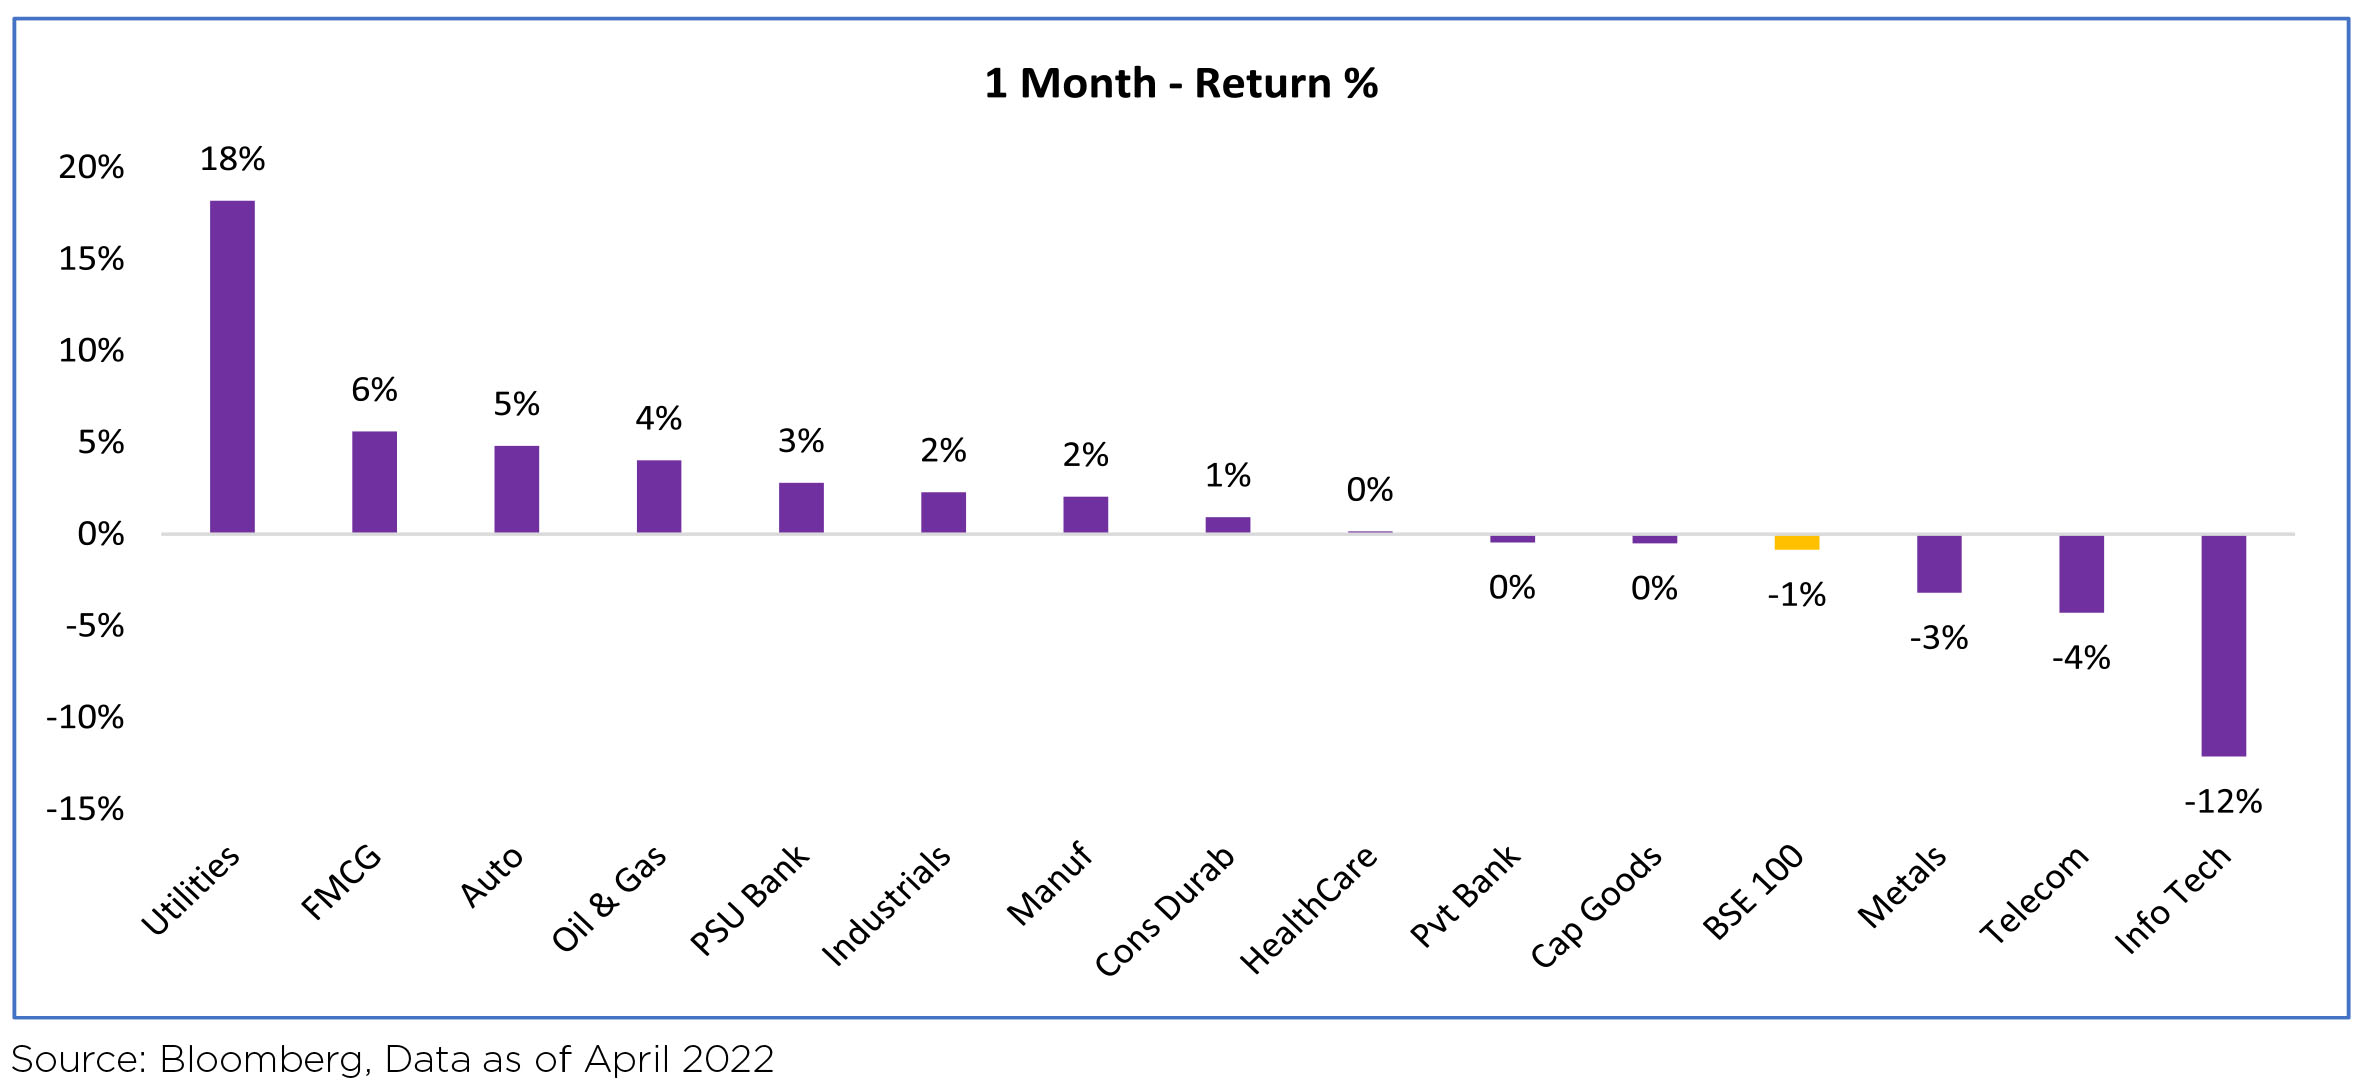
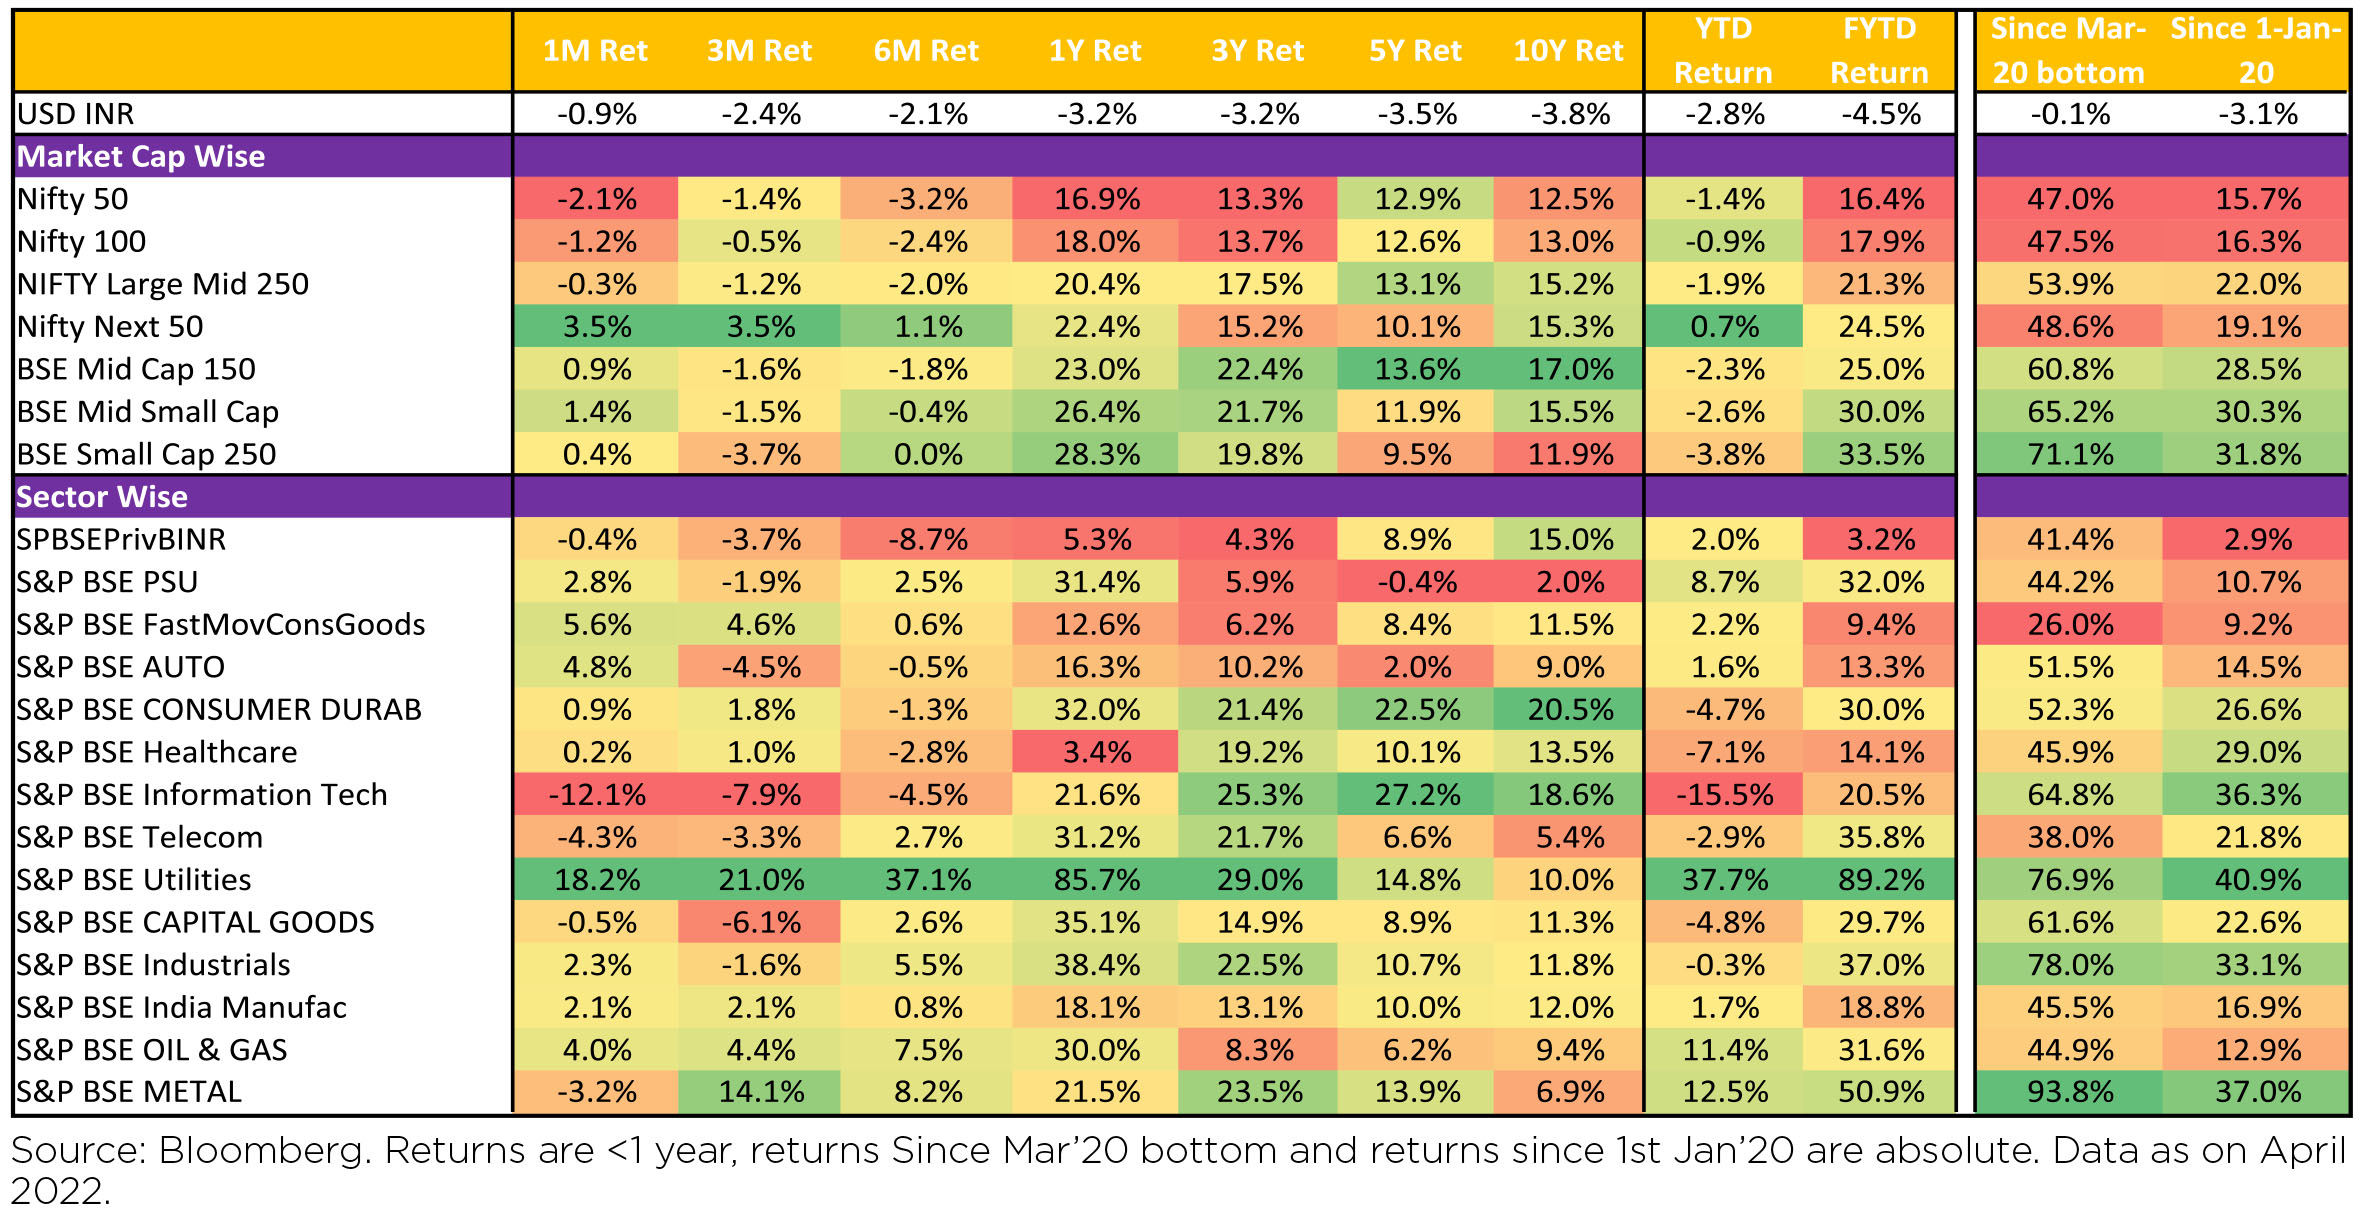
The performance of both midcaps (-0.6% MoM) and small caps (+0.5% MoM) was mixed but outperformed the large caps (-0.8% MoM). Performance of sectors was mixed with Energy, Utilities, Consumer Staples, Industrials, and Consumer Discretionary ending in the green. Materials, Healthcare, Communication Services, Financials and IT ended in the red.
INR depreciated over the month (down 0.8% MoM) and ended the month at 76.43/$ in April'22.
Performance of major Commodities:
Benchmark 10-year Treasury yields averaged 7.08% in April (26bps higher vs. March avg.). On month-end values, the 10Y yield was up and ended the month at 7.14% (up 30bps MoM). Oil prices remained flat over the month of April, after a rise of +5.7% in March.
China implements zero duties on all imported coal for one year: The current duties on coking coal was 3% and for others was 6% which now stands at nil. This move may reduce Chinese mill costs and increase competitiveness in the export market.
HRC prices retreated to Rs 73,500-74,000/t as discounts increased. Parity Prices: Indian trade steel HRC prices are now at par with China's imports. Indian HRC export offers in SE Asia fell 2% wow to US$ 920/t.
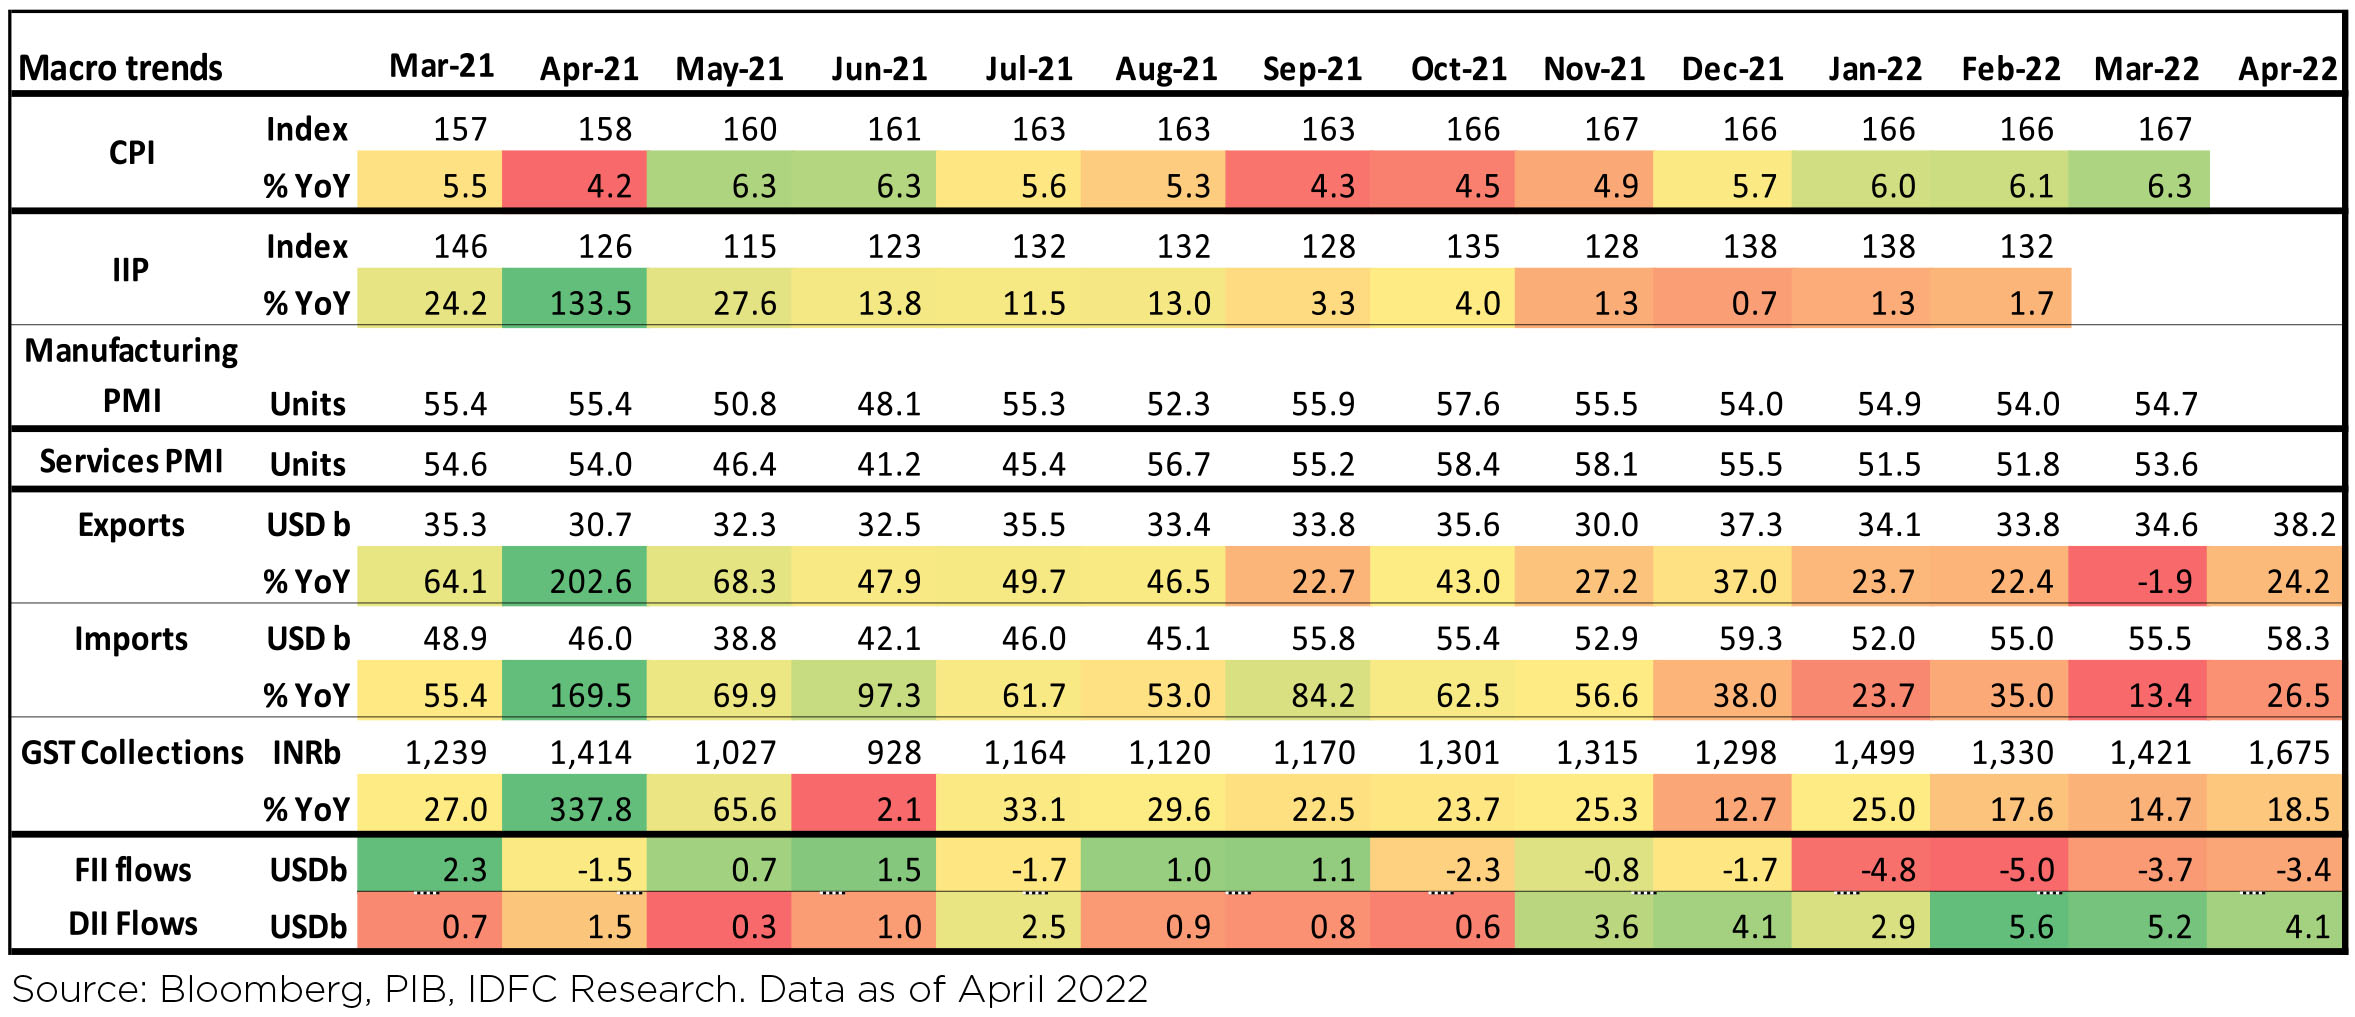
Macro prints were Positive:
► In its off-cycle MPC meeting, RBI surprised with a Repo rate hike of 40bps to 4.4%, after a gap of almost 24 months. US FOMC also raised the Fed Funds rate by 50bp and signaled several further rate hikes of similar magnitude at its next couple of meetings as expected.
► GST mop-up at an all-time high at Rs 1.68lakh crore in April v/s Rs 1.42lakh crore in March.
► March CPI rose further, coming in at 7% ahead of expectations.
► February's Industrial Production also continued to improve (+1.7% YoY; +1.4% MoM).
► Trade deficit continued to stay high and widened to US$20 bn in April from March levels.
► Exports in April grew 24% YoY to US$38.2 bn even as they fell by 9.5% mom (March: US$42.2 bn).
4QFY22 earnings results season began early in the month with expectations of NIFTY names reporting aggregate topline and bottom-line growth of 24% and 12% YoY respectively.
FIIs continued to remain net sellers of Indian equities in April (-$3.4bn, following -$3.7bn in March). This marked the 7th consecutive month of net equity outflows for FIIs, with YTD outflows of $16.9bn. DIIs recorded inflows of $4.1bn in April, maintaining the buying trend observed since March 2021. Mutual funds and Insurance funds were both net buyers during the month.
India's Inflation Dynamics: Indian policymakers face an unenviable balancing act with an incomplete recovery from COVID coinciding with sticky and elevated inflation. We expect the level of GDP shall be maintained even as headline CPI has averaged almost 6% since the start of the pandemic. And this policy dilemma has unfolded before the latest energy and commodity price shock, which is likely to further impinge growth and pressure inflation.
Both headline and core momentum have been elevated in recent months with inflation being increasingly broad-based. Margin pressures and a mean reversion of services inflation pose key upside risks in the coming months. Food inflation, which comprises almost 50% of the basket, will be the key wild card going forward.


Domestic Markets
The performance of both midcaps (-0.6% MoM) and small caps (+0.5% MoM) was mixed but outperformed the large caps (-0.8% MoM). Performance of sectors was mixed with Energy, Utilities, Consumer Staples, Industrials, and Consumer Discretionary ending in the green. Materials, Healthcare, Communication Services, Financials and IT ended in the red.
INR depreciated over the month (down 0.8% MoM) and ended the month at 76.43/$ in April'22.


Performance of major Commodities:
Benchmark 10-year Treasury yields averaged 7.08% in April (26bps higher vs. March avg.). On month-end values, the 10Y yield was up and ended the month at 7.14% (up 30bps MoM). Oil prices remained flat over the month of April, after a rise of +5.7% in March.
China implements zero duties on all imported coal for one year: The current duties on coking coal was 3% and for others was 6% which now stands at nil. This move may reduce Chinese mill costs and increase competitiveness in the export market.
HRC prices retreated to Rs 73,500-74,000/t as discounts increased. Parity Prices: Indian trade steel HRC prices are now at par with China's imports. Indian HRC export offers in SE Asia fell 2% wow to US$ 920/t.
Macro prints were Positive:
► In its off-cycle MPC meeting, RBI surprised with a Repo rate hike of 40bps to 4.4%, after a gap of almost 24 months. US FOMC also raised the Fed Funds rate by 50bp and signaled several further rate hikes of similar magnitude at its next couple of meetings as expected.
► GST mop-up at an all-time high at Rs 1.68lakh crore in April v/s Rs 1.42lakh crore in March.
► March CPI rose further, coming in at 7% ahead of expectations.
► February's Industrial Production also continued to improve (+1.7% YoY; +1.4% MoM).
► Trade deficit continued to stay high and widened to US$20 bn in April from March levels.
► Exports in April grew 24% YoY to US$38.2 bn even as they fell by 9.5% mom (March: US$42.2 bn).
4QFY22 earnings results season began early in the month with expectations of NIFTY names reporting aggregate topline and bottom-line growth of 24% and 12% YoY respectively.
FIIs continued to remain net sellers of Indian equities in April (-$3.4bn, following -$3.7bn in March). This marked the 7th consecutive month of net equity outflows for FIIs, with YTD outflows of $16.9bn. DIIs recorded inflows of $4.1bn in April, maintaining the buying trend observed since March 2021. Mutual funds and Insurance funds were both net buyers during the month.
India's Inflation Dynamics: Indian policymakers face an unenviable balancing act with an incomplete recovery from COVID coinciding with sticky and elevated inflation. We expect the level of GDP shall be maintained even as headline CPI has averaged almost 6% since the start of the pandemic. And this policy dilemma has unfolded before the latest energy and commodity price shock, which is likely to further impinge growth and pressure inflation.
Both headline and core momentum have been elevated in recent months with inflation being increasingly broad-based. Margin pressures and a mean reversion of services inflation pose key upside risks in the coming months. Food inflation, which comprises almost 50% of the basket, will be the key wild card going forward.

Market Performance
Outlook
Investor, Trader or "Investrader"?
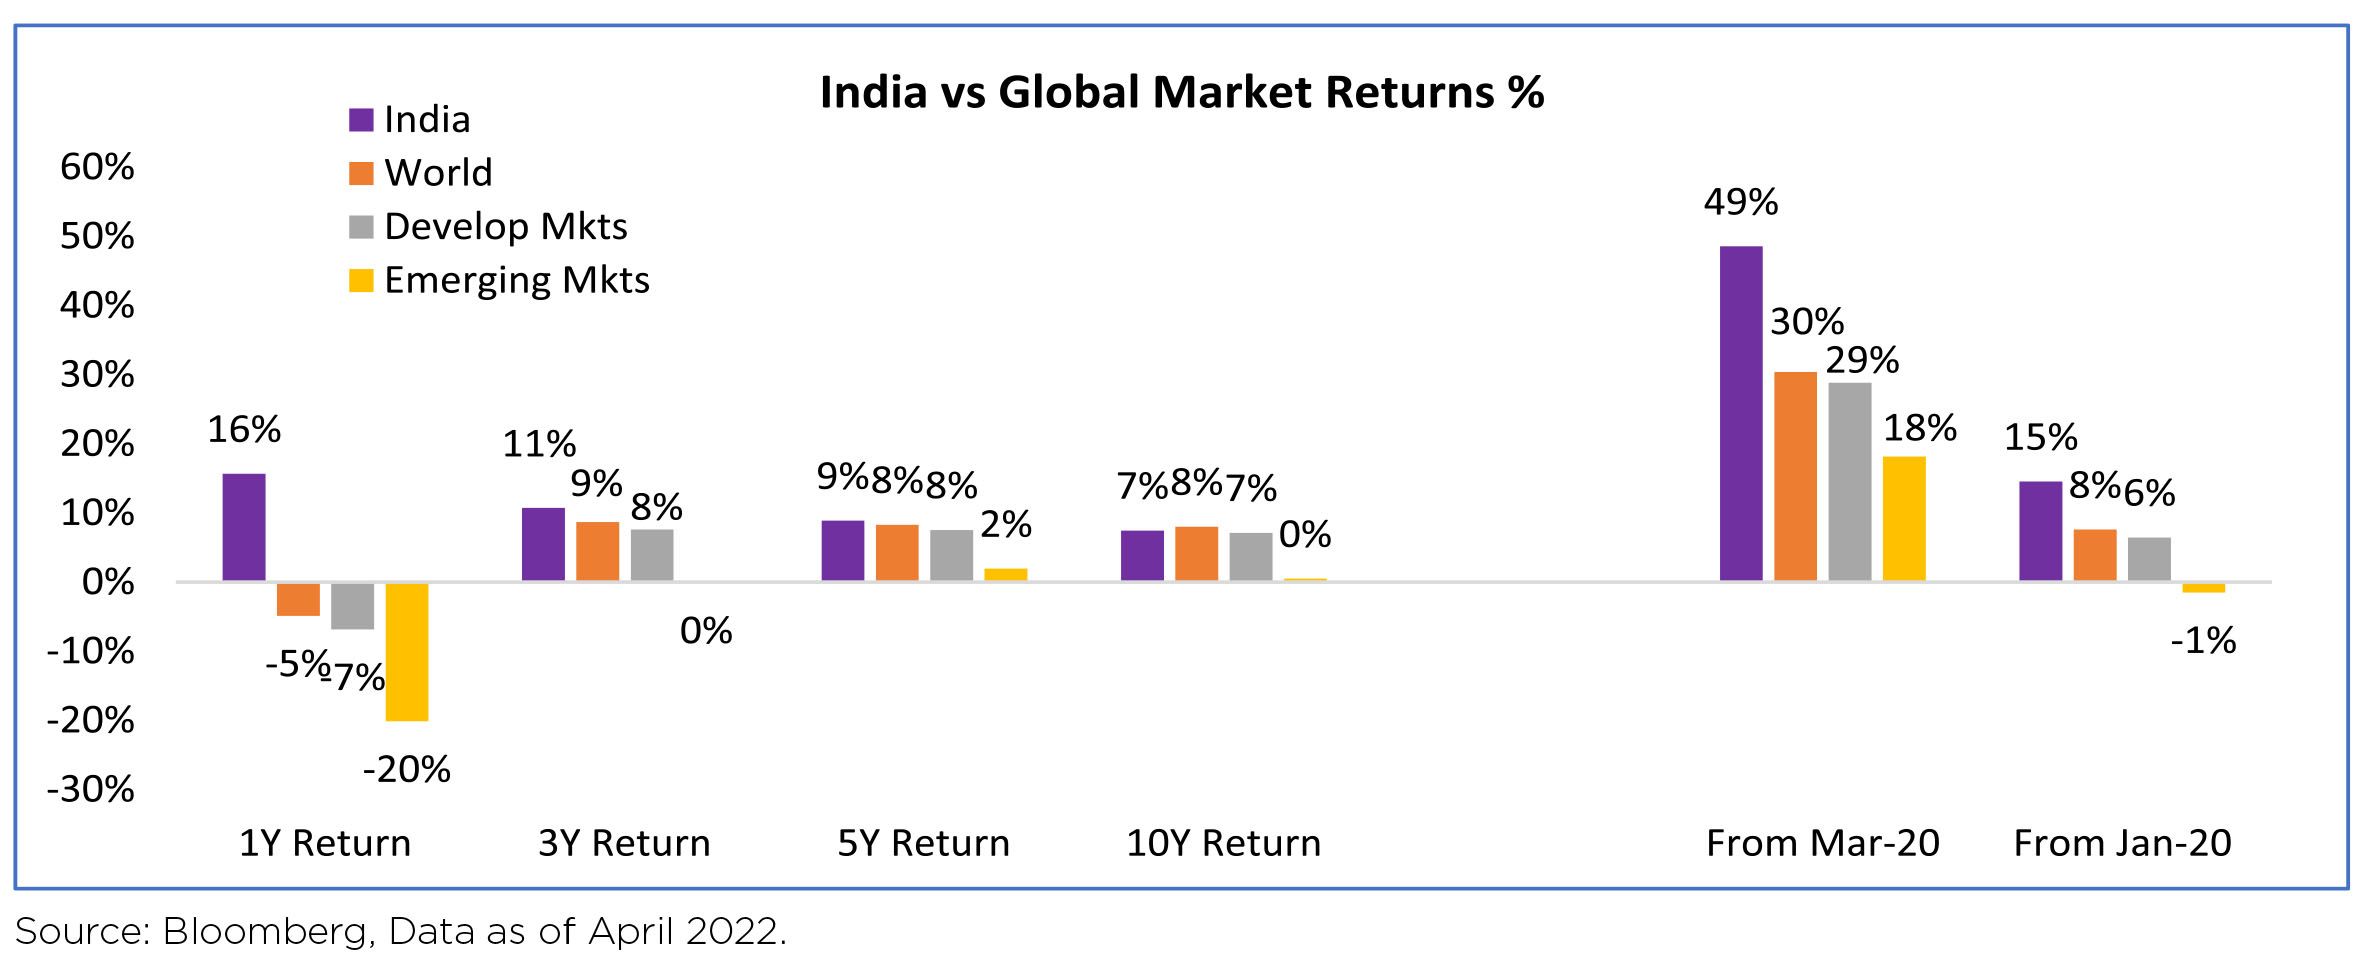
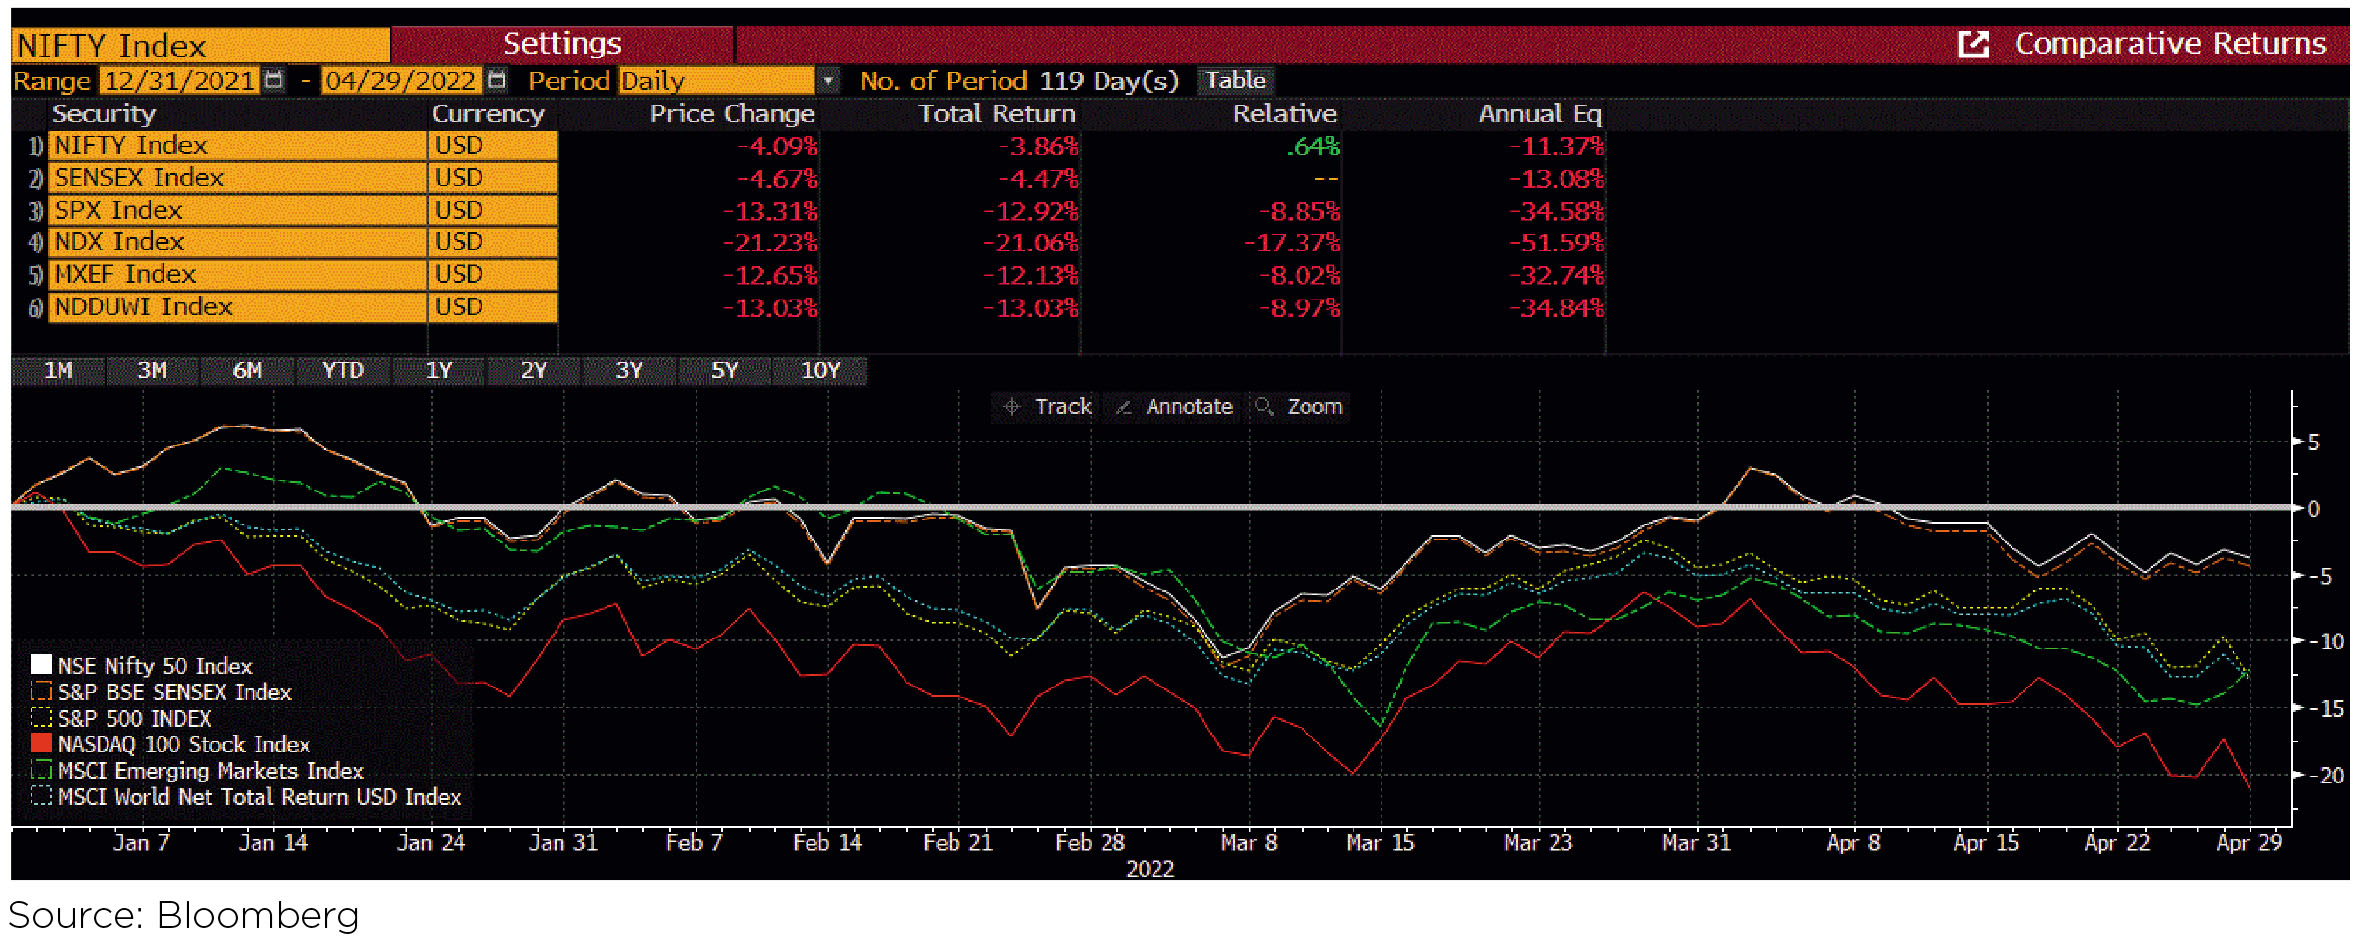
The outperformance of Indian markets relative to global markets continued in Apr'22. Since Jan'21 the divergence in performance between US and India has been eye-popping. Given that Apr'22 witnessed large FII outflows, the strength of Indian retail flows - direct as well as through Mutual Funds was the fulcrum on which this performance was achieved.
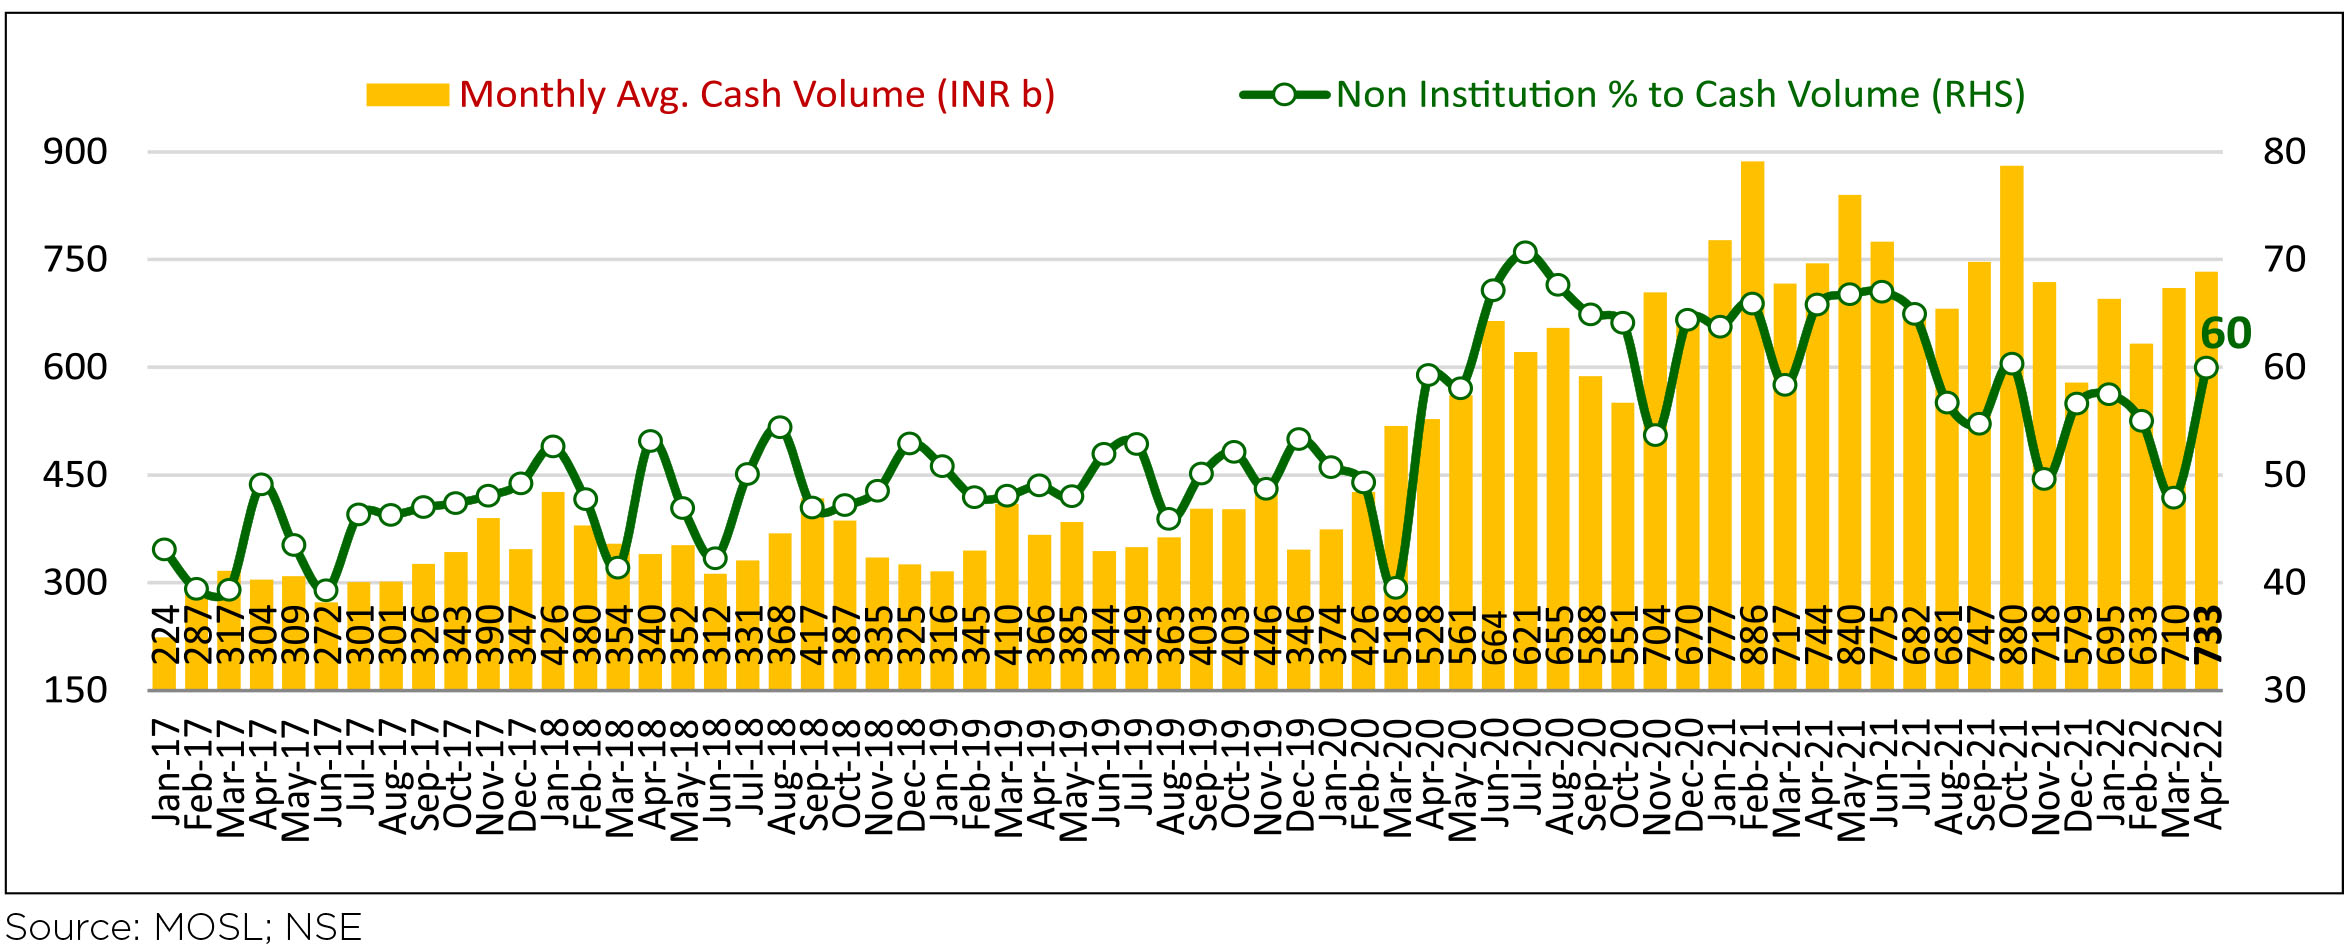
However, the results of retail brokerages for Q4 FY22 reveal an interesting pattern. "Cash" share purchases, i.e. stock bought for delivery (and not funded by margin funding) has shown a decline in the Jan-Mar'22 quarter while Options and Futures traded by retail have gained momentum. Thus, retail "leverage" is higher at current market levels and is largely in Top 200 stocks rather than at the smaller cap end of the market, as has been the case in the past. The "new-age" investors, it appears, are increasing the retail's share in Options trading in the Large cap space, a domain erstwhile dominated by Institutional investors. As Options and Futures are usually margin funded, retail leverage should be increasing, as the data of the last few quarters shows.
An interesting observation is a dichotomy in the Retail's positioning on Index Futures versus Individual Stock Futures. Retail accounts for roughly 69% of all Index Futures long positions, while on the Short side, Retails's share hovers ~ 49%. However, on an individual stock basis, Retail accounts for 52% of all Long Futures and less than 7% of Short Futures. Clearly, retail investors are bullish on the stock and less bullish on the Index movement going forward. With increasing volumes on the Options trading side, the leverage of Retail may be increasing. Leverage, always leads to higher volatility, especially when events that were not forecasted or were viewed as having a low probability actualize. How this plays out, could well decide the trend of the market, at least in the short term (less than 1 year). Are the retail investors really investors or traders or "Investrader"?
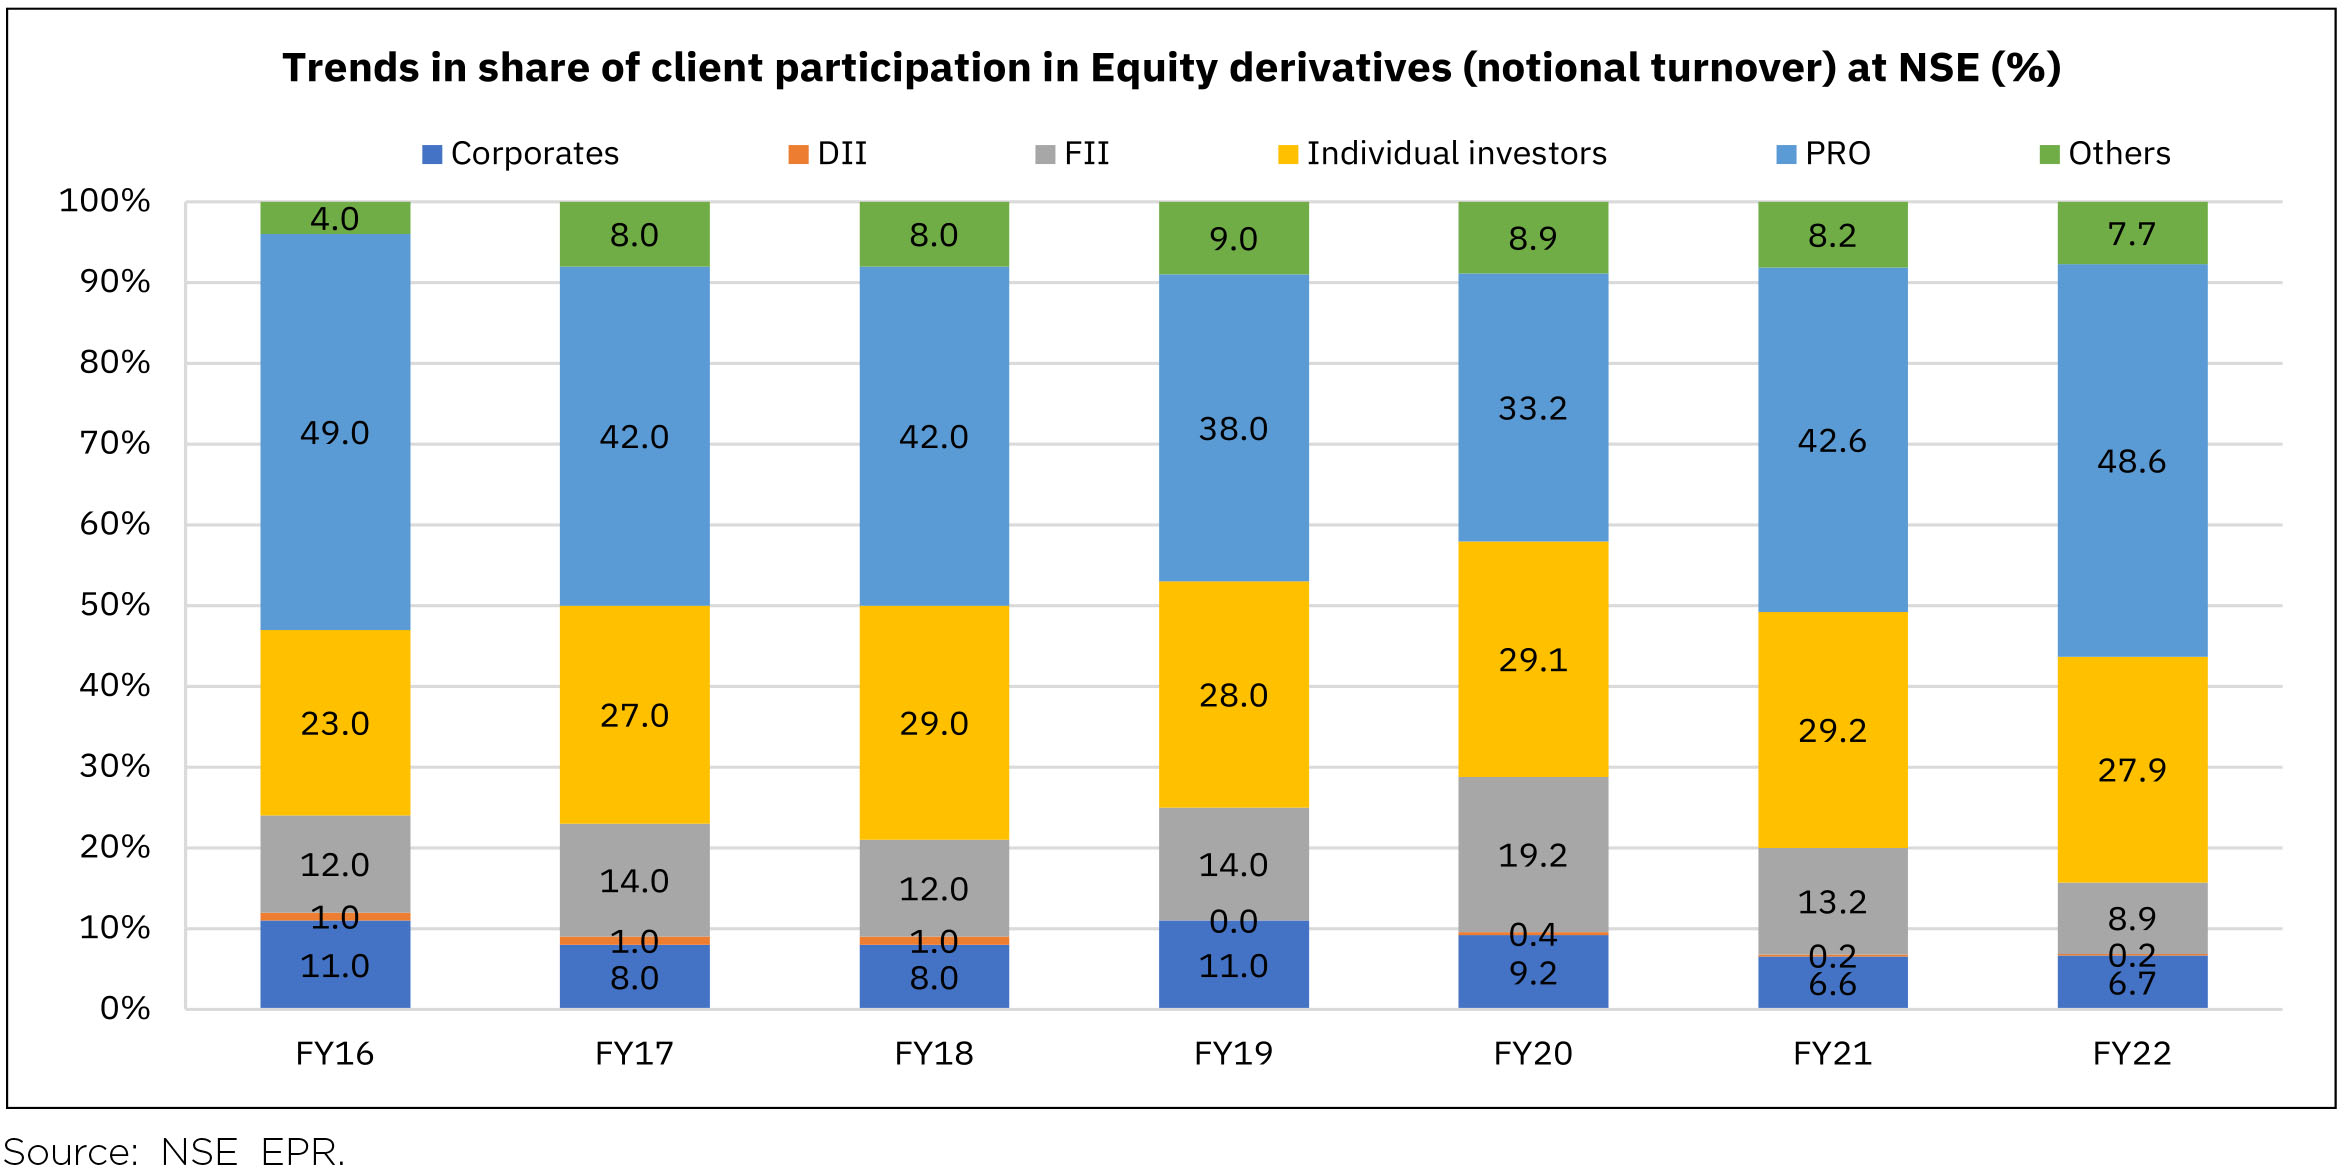
Note: DII: Domestic Institutional Investors include Banks, Mutual Funds, Insurance Companies, NBFCs, Domestic VC Funds, AIFs, PMS clients etc., FII: Foreign Institutional Investors include FPIs, FDIs and Foreign VC Funds etc., Prop traders: Proprietary Traders, Individual investors: individual domestic investors, NRIs, sole proprietorship firms and HUFs, Others: Partnership Firms/LLP, Trust / Society, AIF, Depository Receipts, PMS clients, Statutory Bodies, OCB, FNs, etc. FY22 considers data till February 2022; Above data represents share in gross turnover i.e., buy-side turnover + sell-side turnover.
Over the longer term, earnings growth usually sets the pattern for the market. On that front, the early results, though a mixed bag, are not reporting anything alarming. While earning estimates may be cut for FY23, estimates for FY24 are still largely intact. Aggregate earnings may not appear to have changed much, as upgrades will be limited to a few sectors - Oil & Gas; Metals; Coal & Autos (maybe) the quantum of these upgrades will be equal to or higher than the cuts across a swathe of sectors like consumer staples; discretionary; pharmaceuticals; engineering; EPC, in short users of commodities.
We continue to believe that the elevated commodity prices could lead to either or both of these conditions - a) demand shrinkage, and or b) producers ramping up production, a combination of both should lead to a cooling-off price during the Second half of FY23! Whether this hypothesis works or we have a fullblown inflation scare, will have a material impact on the market move, going forward. Note: The above graph is for representation purposes only and should not be used for the development or implementation of an investment strategy. Past performance may or may not be sustained in the future.
What Went By
March'22 Consumer Price Index (CPI) inflation was higher-than-expected at 7% y/y, up from 6.1% in February'22,
primarily due to a strong pick up in prices of food and beverages. Momentum in core-CPI (CPI excluding food
and beverages, fuel and light) stayed high and has remained sticky at an average of 6% in FY22.
FY22 central government fiscal deficit till February 2022 was 83% of FY22RE (vs. 131% and 111% of actuals in FY19 and FY20 respectively) and March fiscal data is yet to be released. GST collection during April was again at an all-time high of Rs. 1.68 lakh crore and 20% y/y, with some part of the pickup likely due to higher prices and not volumes.
Industrial production (IP) growth in February was 1.7% y/y and 1.4% m/m on a seasonally adjusted basis. Sequential momentum in IP has been positive after the fall in November but eased in February. Output momentum in primary, capital, intermediate and infra goods turned stronger in February but that in consumer durables and non-durables turned negative. Output levels in all these categories, except in infra goods, in the last seven months are still below seasonally adjusted pre-pandemic levels. Infrastructure Industries output (40% weight in IP) in March was up 4.3% y/y and 0.8% m/m seasonally adjusted with sequential growth in coal and crude oil output alone continuing to stay negative.
Bank credit outstanding as on 22nd April was up 10.1% y/y, vs. average fortnightly credit growth of 8% during January-March of 2022, while bank deposit growth was at 9.8%. Of the overall non-food bank credit flow during FY22, 39% was for personal loans, 26% to services, 22% to industry and the rest to agriculture.
Merchandise trade deficit increased to USD20.1bn in April from USD 18.5bn in March, as exports sequentially fell more than imports. Oil and gold imports increased sequentially but non-oil-non-gold imports fell after the pickup in March. Trade deficit has averaged USD 20bn since September 2021 vs. USD 11bn during April-August. Importantly, non-oil-non-gold imports picked up to an average of USD 36.7bn from USD 29.3bn during the same periods.
Mobility indicators continue to increase after the Omicron-wave related fall and number of motor vehicles registered has improved since January. Number of GST e-way bills generated in April sequentially moderated marginally to 7.5cr units from the year-end level of 7.8cr units. Energy consumption level, sequentially improving since mid-January, was flattish in April although well higher year-on-year.
In the US, the FOMC (Federal Open Market Committee) increased the target range for the federal funds rate by 50bps on 4th May, after the 25bps increase in March, and said ongoing increases will be appropriate. It also decided to commence the balance sheet reduction, in line with previous communication, by USD 47.5bn for the first 3 months from 1st June and then to increase it to USD 95bn. In the press conference, Fed Governor Jerome Powell said 50bps hikes are possible in the next two meetings and that a 75bps hike is not being actively considered as of now, although the FOMC stands ready to raise rates by a higher amount than 50bps if needed. US headline and core CPI moved up further to 8.5% y/y and 6.5% respectively in March from 7.9% and 6.4% respectively in February. Price pressures remained broad-based but some components registered slightly weaker momentum in March. US non-farm payroll addition in March (431,000 persons) was lower than in February but remained buoyant. Unemployment rate fell further to 3.6% in March from 3.8% in February and close to 3.5% pre-pandemic in February 2020. Labour force participation rate is however at 62.4% in March vs. 63.4% in February 2020. Sequential growth in average hourly earnings picked back up after easing in February.
China has been continuing with its Zero-Covid Strategy while economic activity indicators like Purchasing Managers' Indices for manufacturing and services, imports, etc. have been coming in weaker. The Chinese Yuan depreciated by ~4% vs. the U.S. Dollar in April. The State Council had previously mentioned about likely higher monetary policy support in the offing. Policy measures implemented thereafter include a 25bps cut in the Reserve Requirement Ratio (RRR) for banks with a 5%+ ratio and a 1ppt cut to 8% (effective 15th May) in the RRR for foreign exchange deposits. The government is also reportedly looking at infrastructure investments to support growth.
In a surprising turn of events, RBI / MPC made an intermeeting decision to hike repo rate by 40 bps and CRR by 50 bps on 4th May 2022. Though since the April policy market has been pricing for a faster normalisation (interest rate swaps had been factoring in front loaded normalisation and cumulative hikes of 275 bps over 2 years), almost no one at all was prepared for an inter-meeting action. The Governor positioned this as a reversal of the intermeeting 40 bps cut undertaken on 22nd May 2020 and thus in keeping with the announced stance of withdrawal of accommodation as per April 2022 policy.
Outlook
We had assessed in our previous note (https://idfcmf.com/article/7676), that we are in the endgame of rate hike pricing. This had three takeaways in our view: One, there is a world of difference between actual central bank action and what the forward pricing mechanism of markets discounts. We had further concluded that swap pricing seemed excessive given our underlying views on the cycle. Two, we had cautioned that markets had a tendency to overshoot and the objective of flagging the endgame therefore was that while expecting volatility over the next few months investors should still start scaling into medium duration bonds with a sufficiently long investment horizon, rather than looking away from these. This was especially true after factoring in the carry buffer owing to steepness of curve. Three, we had made the case for 4 - 5 year segment basis the steepness of this segment over 2 year yields and our assessment that while rate hike pricing may be nearing a top, bond supply premium isn't since the supply calendar has only started. Thus, longer duration bonds (10 year and beyond) didn't appear as efficient ways to play curve steepness, given the added duration risk that they posed.
A stark assessment of this framework basis recent developments seems to render it on shaky grounds. Thus swap yields have put on another 50 bps as observed earlier and, although we can hide behind our observation that we flagged volatility over this last phase of repricing, that would be an unjustifiable and a pathetically transparent cover. Instead we must admit that we never expected this large a volatility over this short a timeframe. While we have noted that one needs to have sufficiently long investment horizons to benefit from the steepness protection calculation, it is also true that the 30 - 45 bps rise in bond yields today in the 4- 5 year segment has taken out something like 6 - 8 months' of carry buffer. Finally, the spread to 10 year of our preferred segment (4 -5 years) has further compressed over this move.
The above said we find no reason to drop the framework. The essence of the issue is a rapid re-assessment of market's expected rate hike cycle without an equally material change in the characterisation of the underlying macro-economic cycle. Thus while the pace of normalisation being undertaken is swifter than earlier envisaged we believe the market's extrapolation of the same, while understandable, is probably incorrect. In other words this means a quicker journey to a somewhat neutral setting but much more reluctance beyond that as compared with what the market is currently pricing. The risk in the meanwhile remains that, unless RBI actively recognises the unnecessary costs currently being borne from the normalisation cycle and actively moves to address the forward pricing mechanism, market will remain confused with respect to what to price in as terminal rates in this cycle. However, we expect this confusion to start to get resolved later in the year as more visible signs of growth slowdown emerge with consequent lesser fears of second round effects of inflation. Thus, and notwithstanding the recent setback, we continue to think that 4 - 5 year sovereign bonds provide very decent duration risk adjusted return for a medium term horizon, and that investors should continue scaling into this segment over the next few months for those relevant investment horizons.


