IDFC Emerging Businesses Fund
Small Cap Fund - An open ended equity scheme predominantly investing in small cap stocks

IDFC Emerging Businesses Fund
Small Cap Fund - An open ended equity scheme predominantly investing in small cap stocks
|
|
|
|
|

|


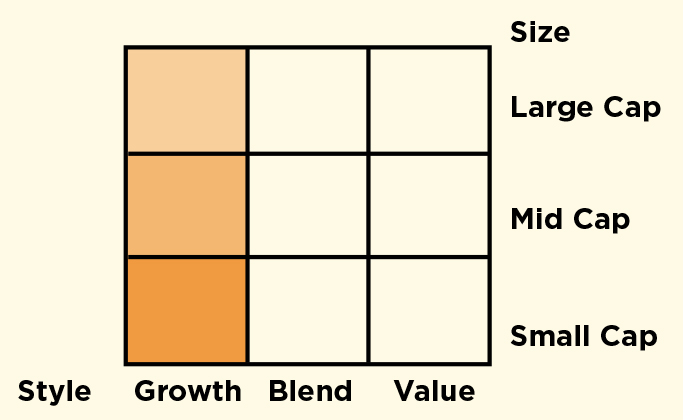
About the Fund: Fund focuses on building a diversified portfolio within the small cap segment.
• Portfolio will contain buy and hold strategies as well as opportunistic picks in the cyclical space.
• Fund may also look to participate in new businesses via IPOs.
Category: Small Cap Fund
 : ₹ 1,482.19 Crores
AUM or assets under management refers to the recent / updated cumulative market value of investments managed by a mutual fund or any investment firm.
: ₹ 1,482.24 Crores
AUM or assets under management refers to the recent / updated cumulative market value of investments managed by a mutual fund or any investment firm.
:
An employee of the asset management company such as a mutual fund or life insurer, who manages investments of the scheme. He is usually part of a larger team of fund managers and research analysts.
| Portfolio Turnover | |
| Equity | 0.20 |
| Aggregate^ | 0.20 |
| Total Expense Ratio | |
| Regular | 2.17% |
| Direct | 0.53% |
SIP (Minimum Amount): ₹ 100/- and in multiples of Rs.1 thereafter
SIP Frequency: Monthly
SIP Dates (Monthly): Investor may choose any day of the month except 29th, 30th and 31st as the date of instalment.
Investment Objective: Click here
Minimum Investment Amount : ₹ 5,000/- and any amount thereafter
Option Available: The Scheme offer IDCW@ Option & Growth Option. IDCW@ Option under each Plan further offers of choice of Payout & Sweep facilities.
:
Exit load is charged at the time an investor redeems the units of a mutual fund. The exit load is deducted from the prevailing NAV at the time of redemption. For instance, if the NAV is ₹ 100 and the exit load is 1%, the redemption price would be ₹ 99 per unit.
NAV (₹) as on October 31, 2022
| Regular Plan | Growth | 21.40 |
| Regular Plan | IDCW@ | 19.40 |
| Name | % of NAV |
| Equity and Equity related Instruments | 94.12% |
| Consumer Durables | 9.72% |
| oMetro Brands | 2.84% |
| oKajaria Ceramics | 2.53% |
| Mayur Uniquoters | 1.68% |
| Cera Sanitaryware | 1.47% |
| Greenply Industries | 1.21% |
| Auto Components | 9.68% |
| oAutomotive Axles | 2.31% |
| Wheels India | 2.12% |
| Alicon Castalloy | 1.82% |
| Jamna Auto Industries | 1.59% |
| GNA Axles | 1.41% |
| Schaeffler India | 0.43% |
| Industrial Products | 7.84% |
| oShaily Engineering Plastics | 3.58% |
| oCarborundum Universal | 2.55% |
| Graphite India | 0.95% |
| Kirloskar Brothers | 0.77% |
| Leisure Services | 7.67% |
| oWestlife Development | 2.73% |
| oEIH | 2.17% |
| Jubilant Foodworks | 1.39% |
| Taj GVK Hotels & Resorts | 0.94% |
| Restaurant Brands Asia | 0.44% |
| Chemicals & Petrochemicals | 5.48% |
| oNOCIL | 2.49% |
| Navin Fluorine International | 2.13% |
| Chemplast Sanmar | 0.85% |
| Healthcare Services | 3.90% |
| Narayana Hrudayalaya | 1.93% |
| Krishna Institute of Medical Sciences | 1.14% |
| Krsnaa Diagnostics | 0.83% |
| Finance | 3.78% |
| Can Fin Homes | 1.41% |
| Mas Financial Services | 1.24% |
| Poonawalla Fincorp | 1.13% |
| Retailing | 3.41% |
| Vedant Fashions | 1.86% |
| V-Mart Retail | 1.55% |
| Pharmaceuticals & Biotechnology | 3.37% |
| Gland Pharma | 1.33% |
| FDC | 1.16% |
| Laurus Labs | 0.88% |
| Food Products | 3.16% |
| Avanti Feeds | 1.36% |
| DFM Foods | 1.15% |
| Heritage Foods | 0.66% |
| Cement & Cement Products | 3.14% |
| JK Lakshmi Cement | 1.60% |
| Name | % of NAV |
| Sagar Cements | 1.54% |
| Capital Markets | 3.10% |
| Multi Commodity Exchange of India | 1.85% |
| UTI Asset Management Company | 1.25% |
| Automobiles | 2.94% |
| Maruti Suzuki India | 1.69% |
| Tata Motors | 1.25% |
| Beverages | 2.92% |
| oRadico Khaitan | 2.92% |
| Commercial Services & Supplies | 2.89% |
| eClerx Services | 1.59% |
| TeamLease Services | 1.30% |
| IT - Software | 2.68% |
| Zensar Technologies | 1.52% |
| Birlasoft | 1.16% |
| Agricultural, Commercial & Construction Vehicles | 2.25% |
| oAshok Leyland | 2.25% |
| Banks | 2.04% |
| State Bank of India | 2.04% |
| Construction | 1.96% |
| Kalpataru Power Transmission | 1.96% |
| Agricultural Food & other Products | 1.93% |
| Balrampur Chini Mills | 1.93% |
| IT - Services | 1.42% |
| Cyient | 1.42% |
| Fertilizers & Agrochemicals | 1.39% |
| Heranba Industries | 1.39% |
| Diversified | 1.27% |
| DCM Shriram | 1.27% |
| Cigarettes & Tobacco Products | 1.21% |
| Godfrey Phillips India | 1.21% |
| Industrial Manufacturing | 1.08% |
| Syrma SGS Technology | 1.08% |
| Petroleum Products | 1.07% |
| Gulf Oil Lubricants India | 1.07% |
| Realty | 0.98% |
| Mahindra Lifespace Developers | 0.98% |
| Personal Products | 0.72% |
| Emami | 0.72% |
| Textiles & Apparels | 0.64% |
| Nitin Spinners | 0.64% |
| Insurance | 0.25% |
| Life Insurance Corporation of India | 0.25% |
| Transport Services | 0.25% |
| VRL Logistics | 0.25% |
| Net Cash and Cash Equivalent | 5.88% |
| Grand Total | 100.00% |
| oTop 10 Equity Holdings |
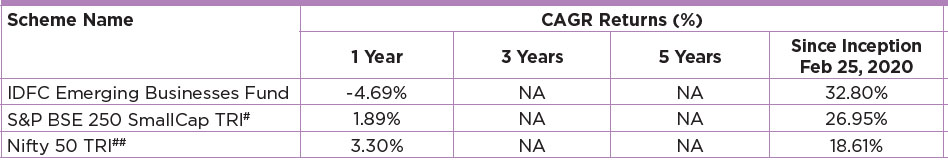
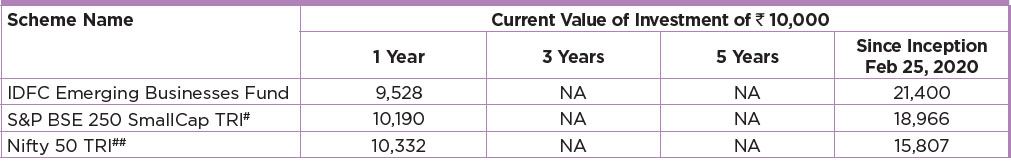
Performance based on NAV as on 31/10/2022. Past performance may or may not be sustained in future.
The performances given are of regular plan growth option.
Click here for other funds managed by the fund manager and refer to the respective fund pages
#Benchmark Returns. ##Alternate Benchmark Returns.
Scheme risk-o-meter
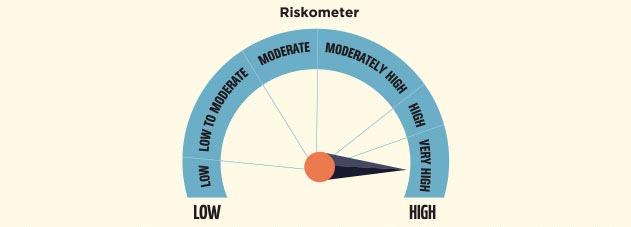
Investors understand that their principal will be at Very High risk
This product is suitable for investors who are seeking*
- To create wealth over long term.
- Investment in equity and equity related instrument of small cap companies.
* Investors should consult their financial advisers if in doubt about whether the product is suitable for them.
Benchmark risk-o-meter
S&P BSE 250 SmallCap TRI
The scheme has been in existence for more than 1 year but less than 3 years or 5 years.
Regular and Direct Plans have different expense structure. Direct Plan shall have a lower expense ratio excluding distribution expenses, commission expenses etc..
Other ratios are not given as scheme has not completed 3 years.
^Portfolio Turnover ratio is calculated as Lower of purchase or sale during the period / Average AUM for the last one year (includes Fixed Income securities and Equity derivatives).
