Commentary

Commentary
|
|
|
|
|

|


Global Markets
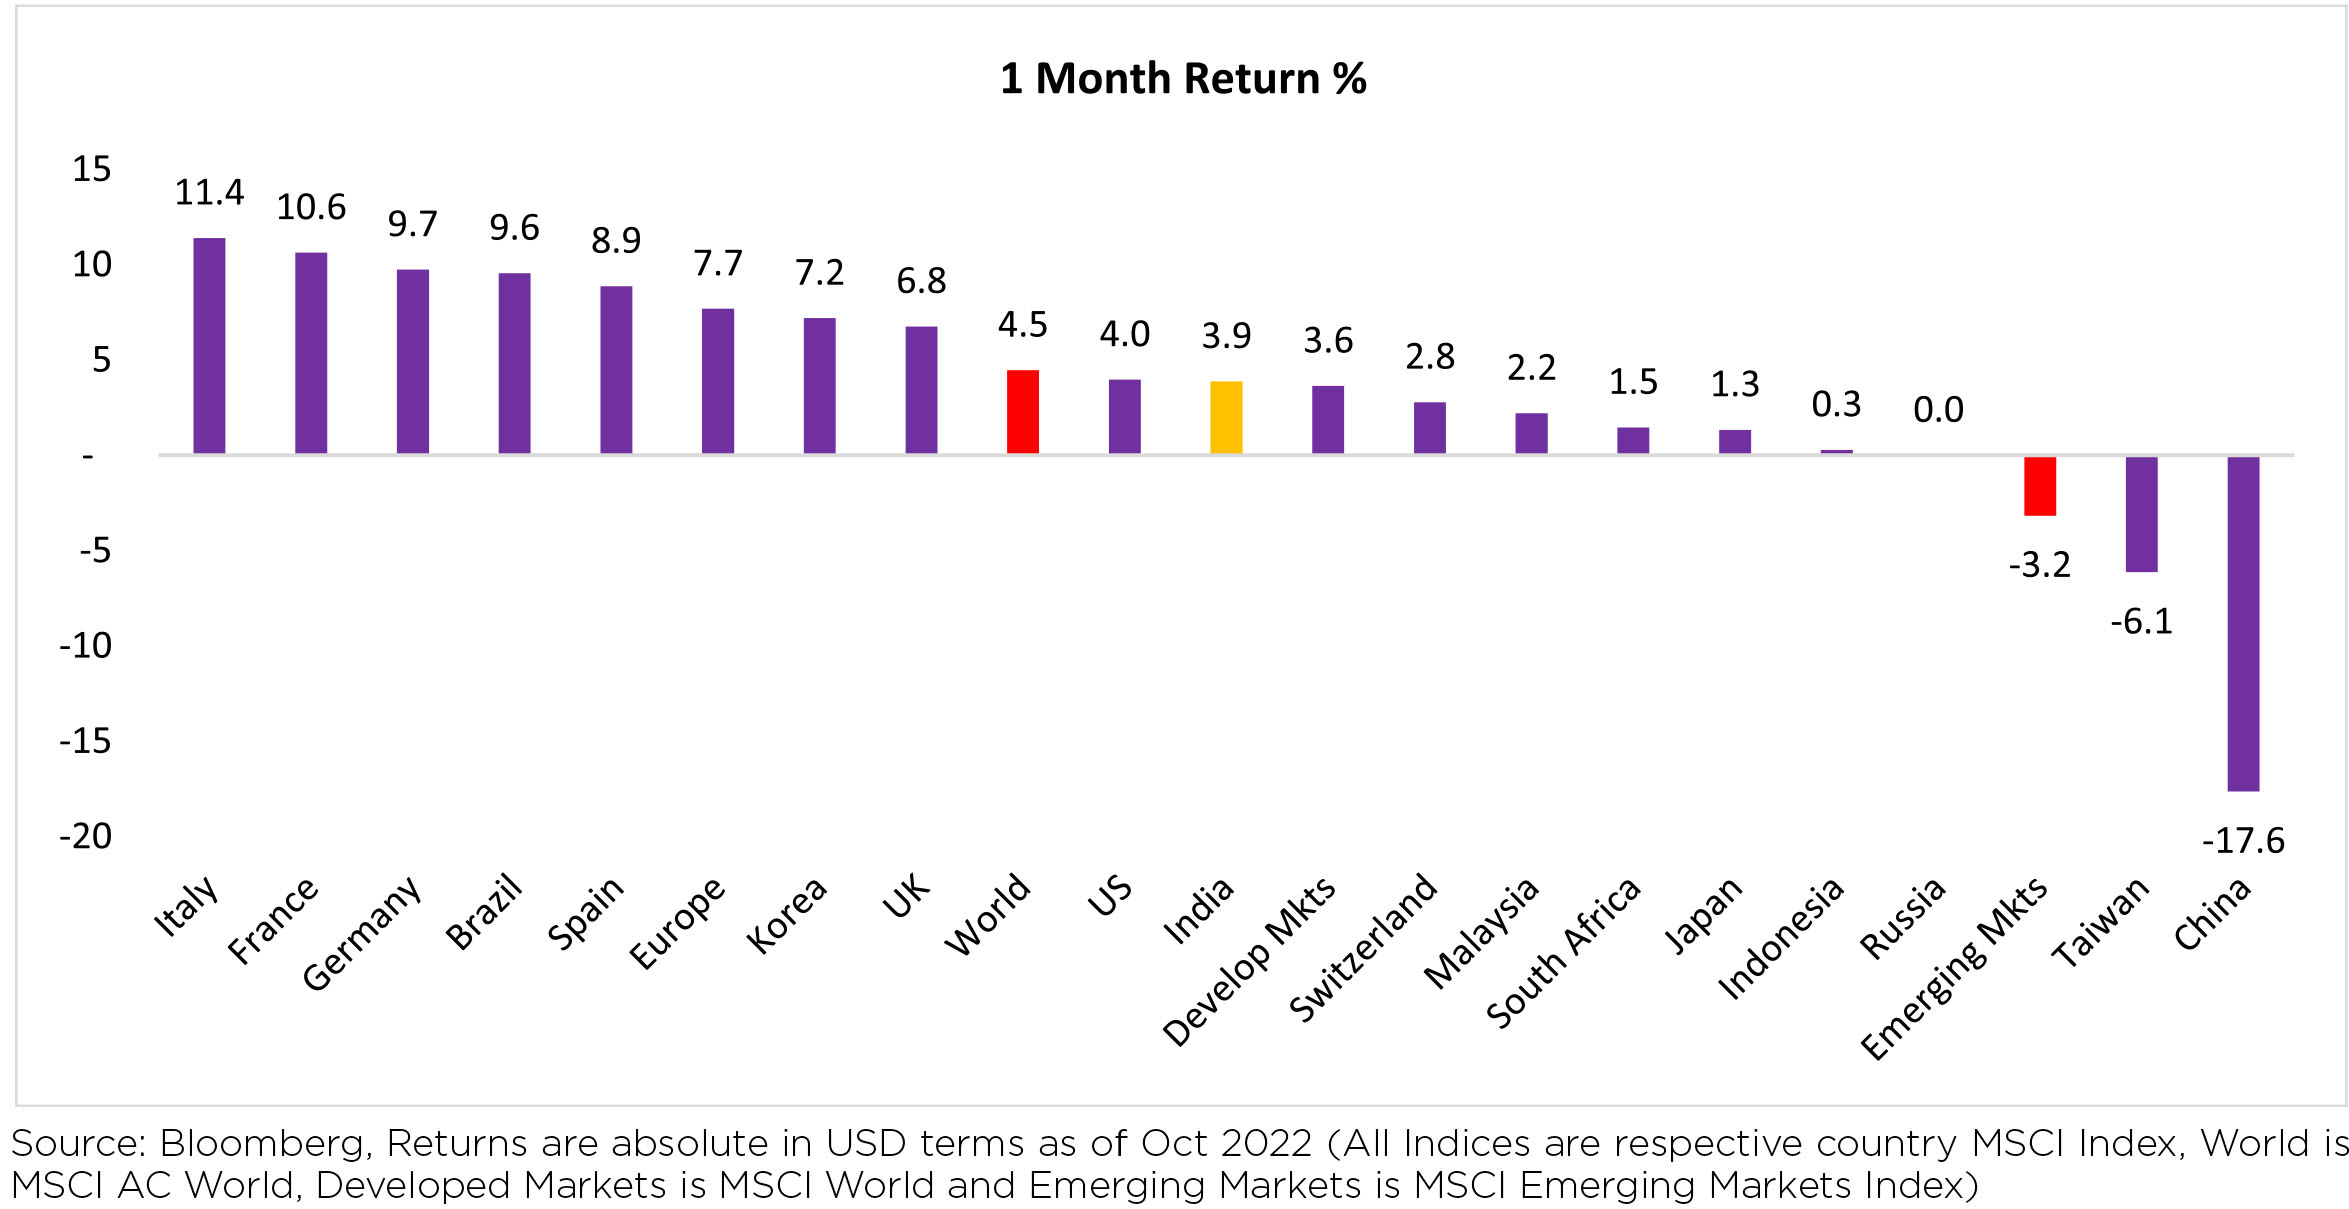
Global equities improved across regions (+4.5% MoM/-21.2% YTD). China (-17.6% MoM) and Taiwan (-6.1%
MoM) were in red dragging the EM performance (-3.2% MoM).
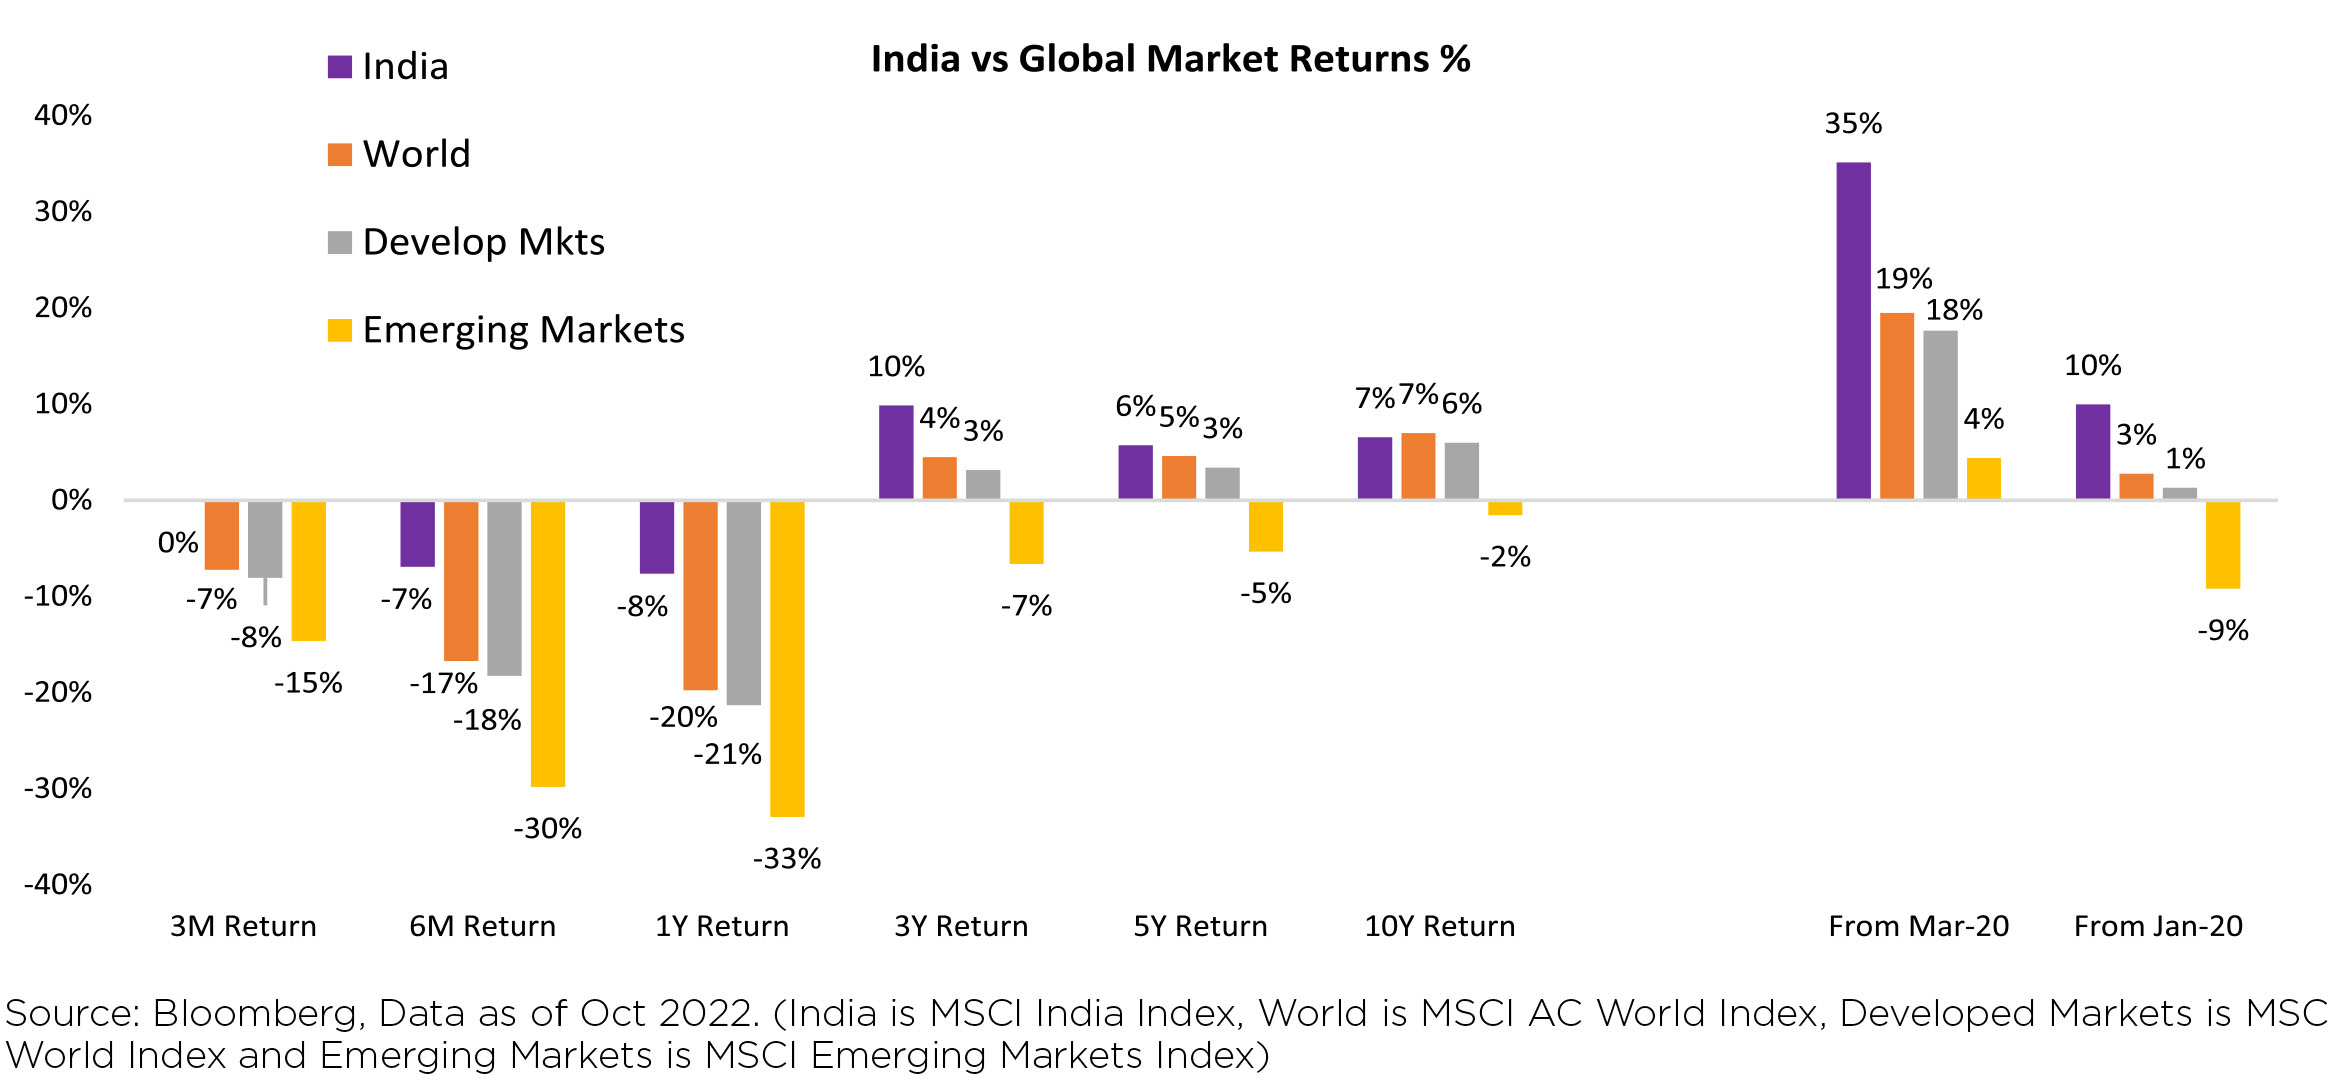
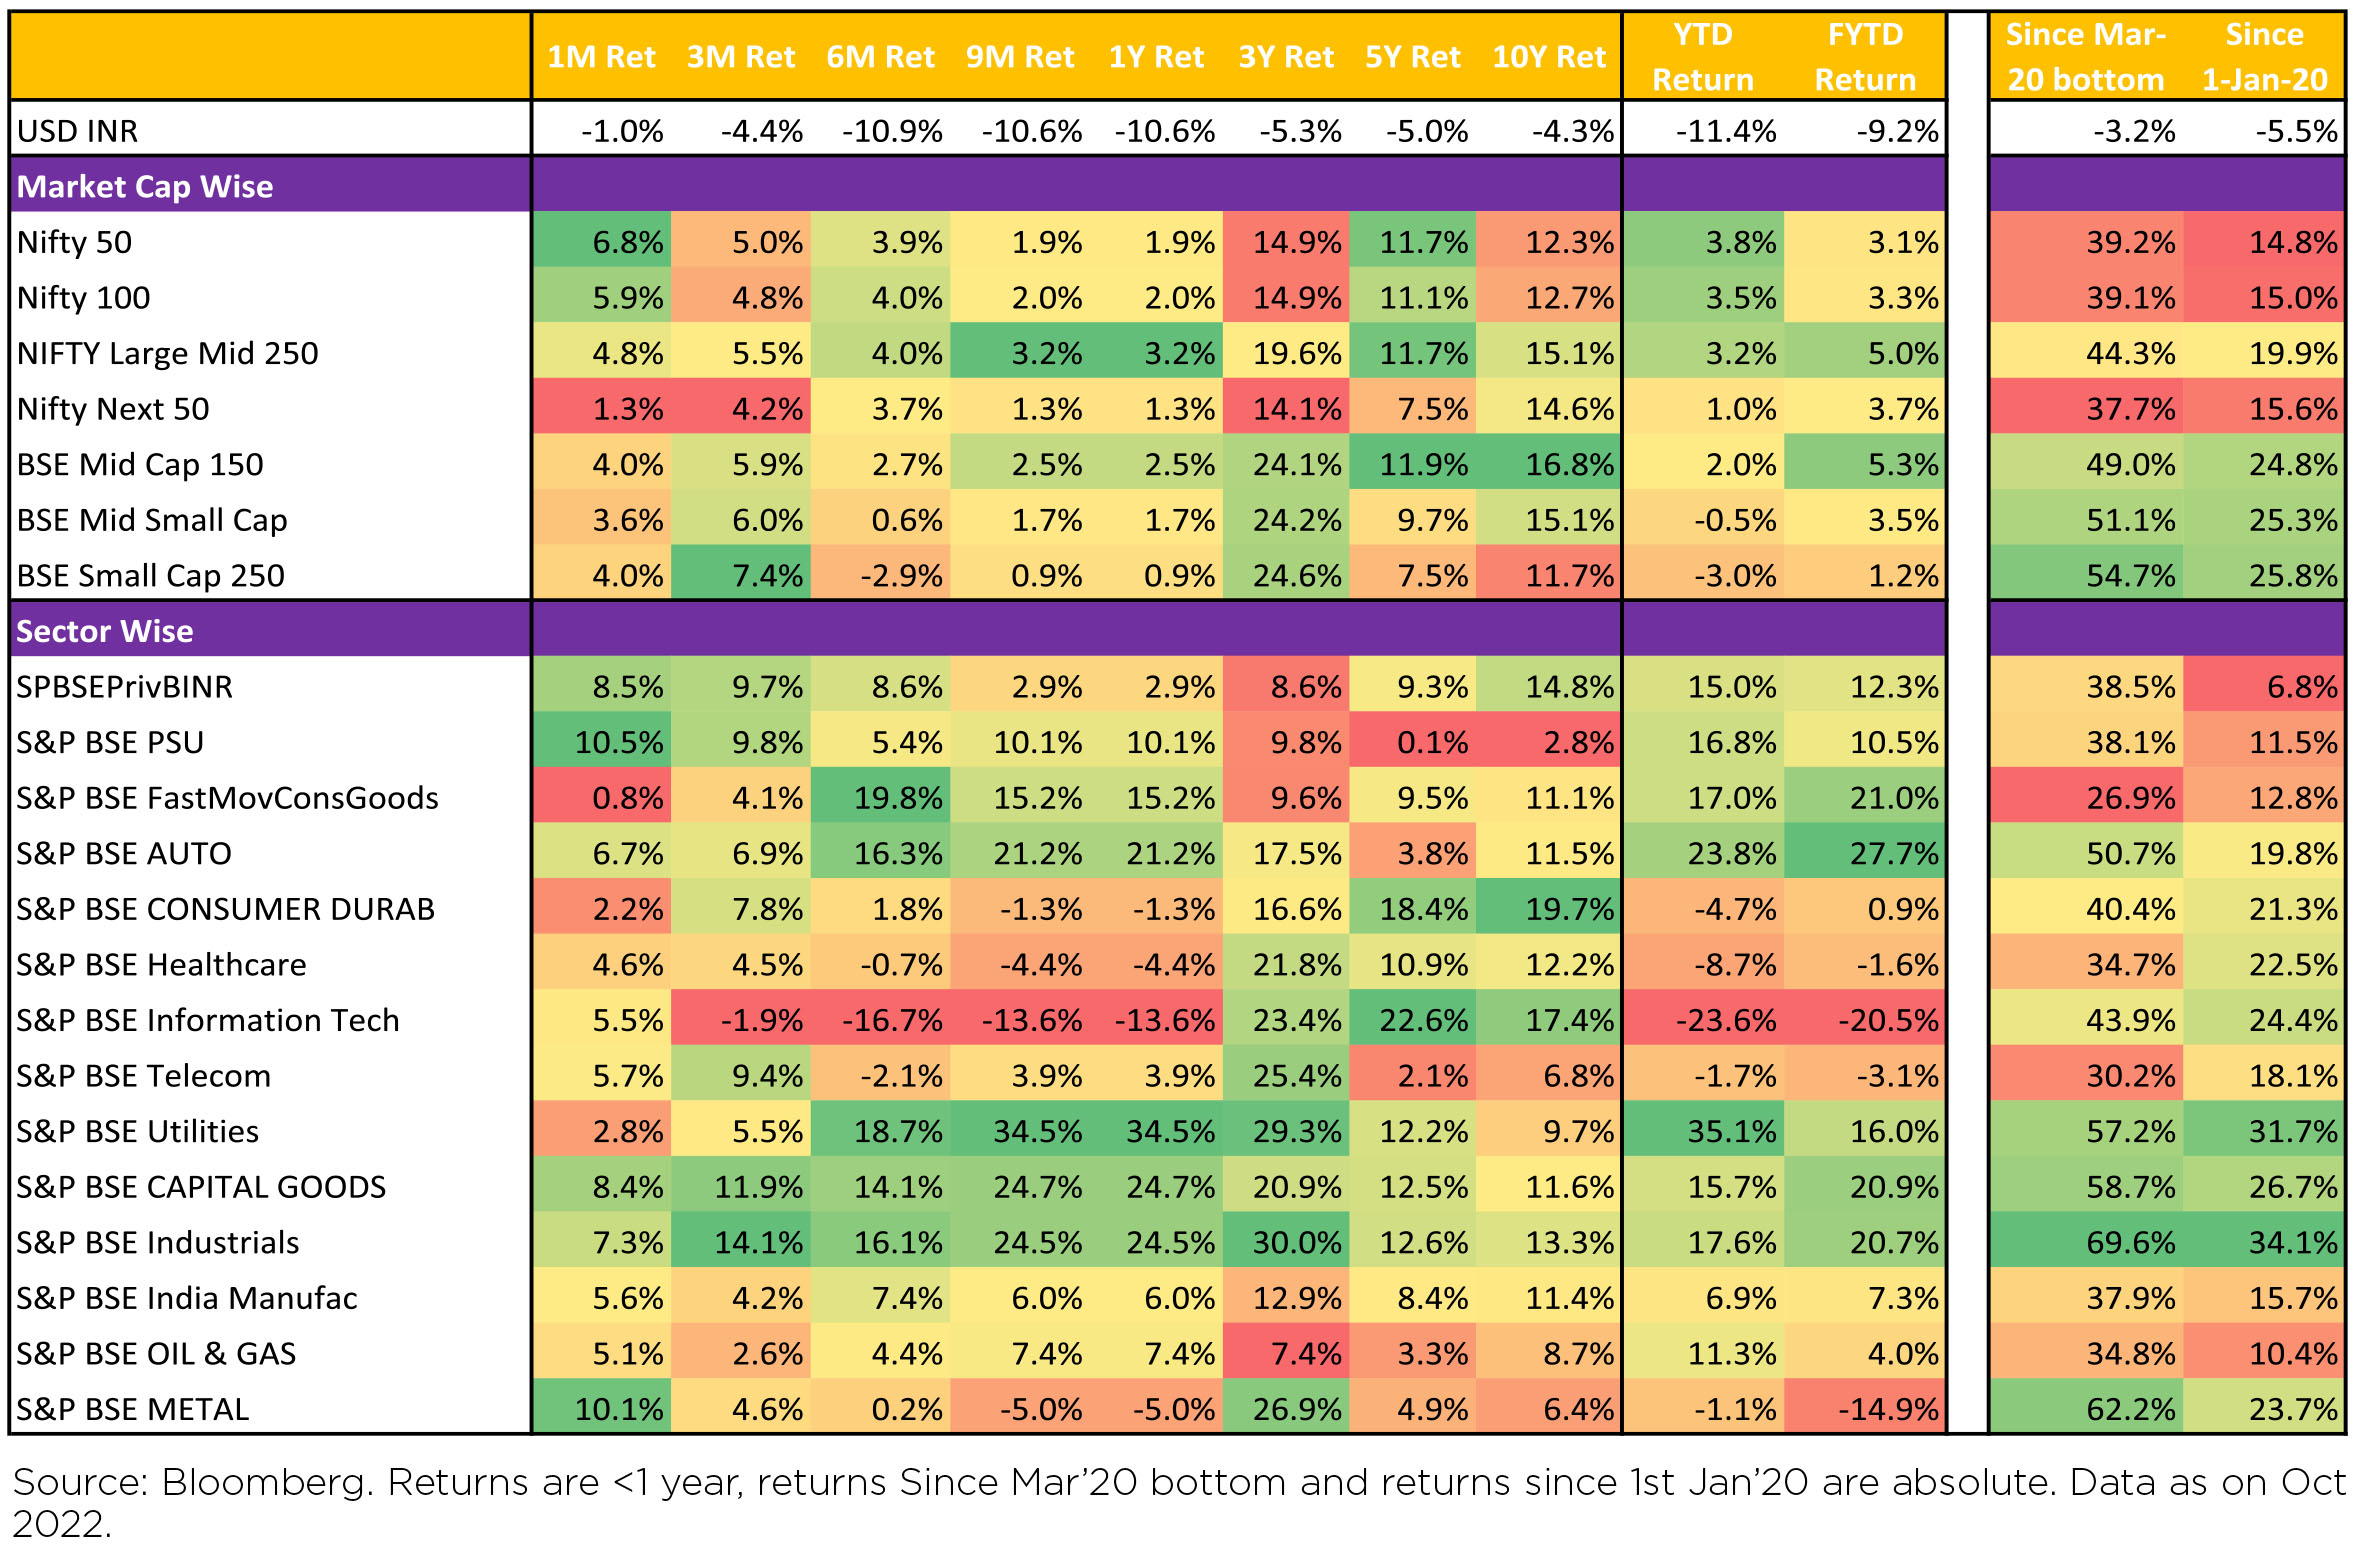
Indian equities rose +3.9% MoM (in USD terms), while outperforming the APAC region and its peers (MSCI APxJ/EM: -4.2%/-3.2%).
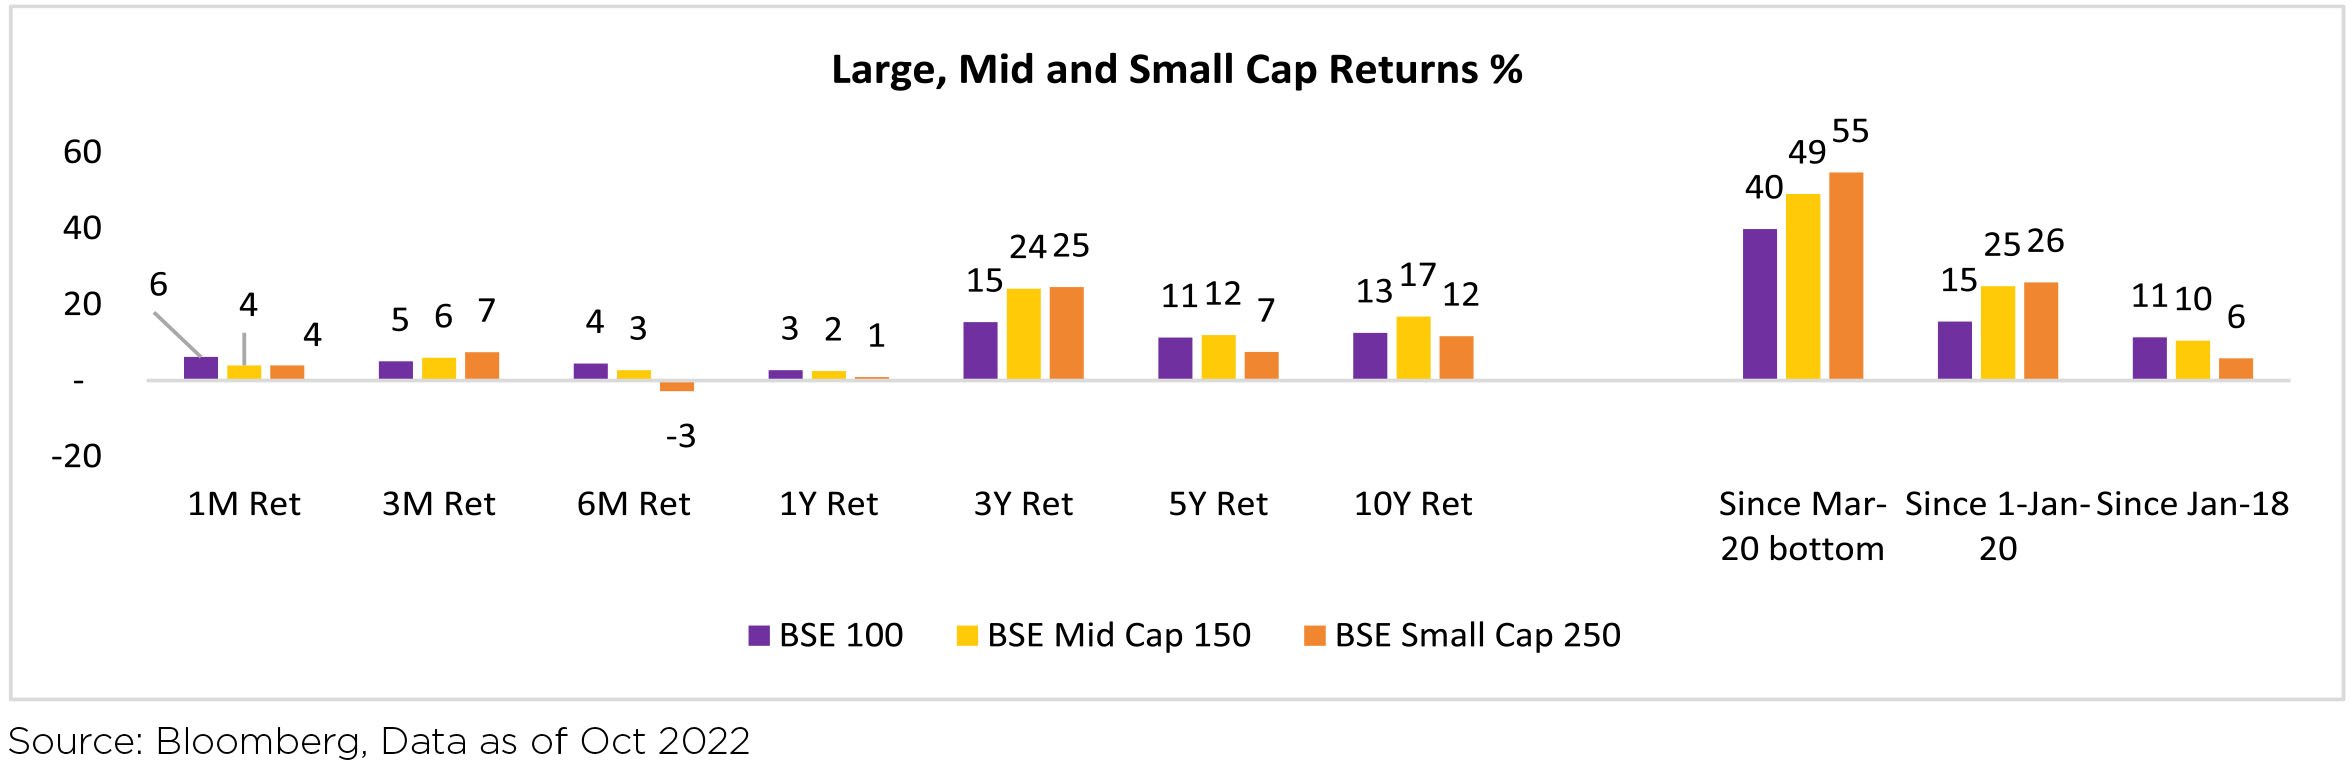
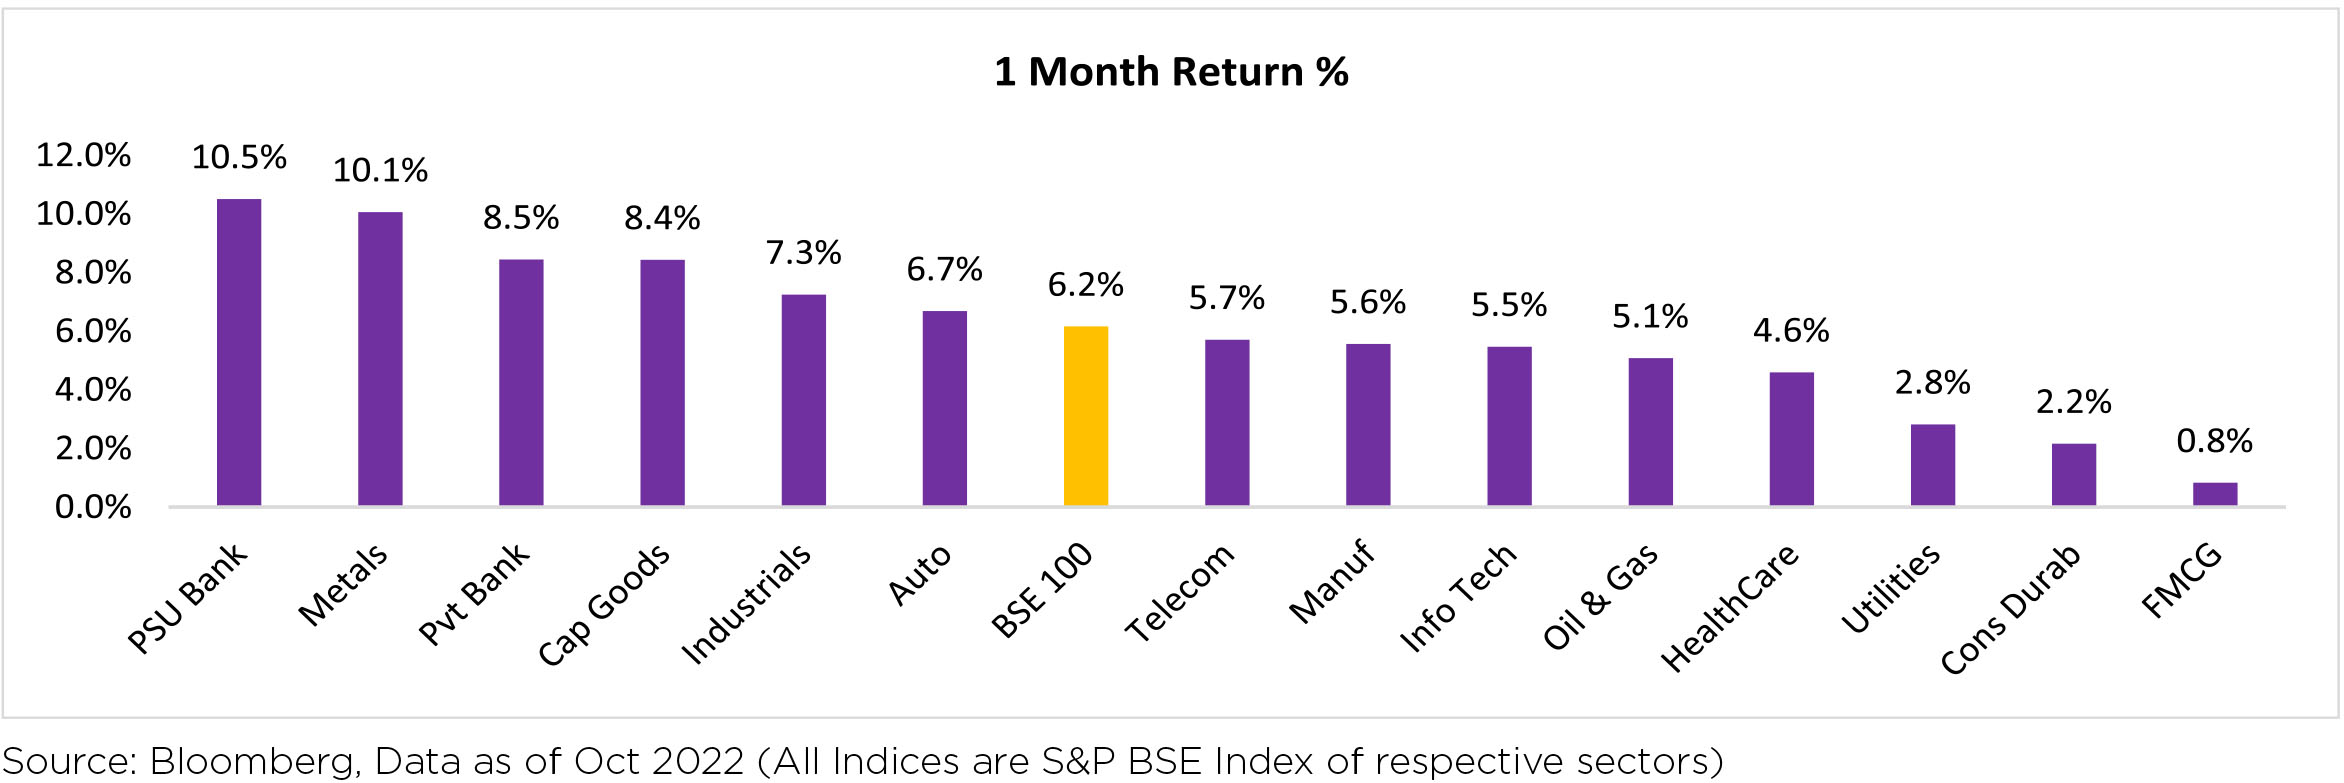
Within India, Mid-caps (+4% MoM) and small caps (+4% MoM) underperformed the large caps (+6.2%
MoM). All sectors ended the month in the green with Financials, Metals, Capital Goods, Industrials and
Auto outperforming the benchmark NIFTY (+6.8% MoM), reclaiming the 18K level at the close of the
month.
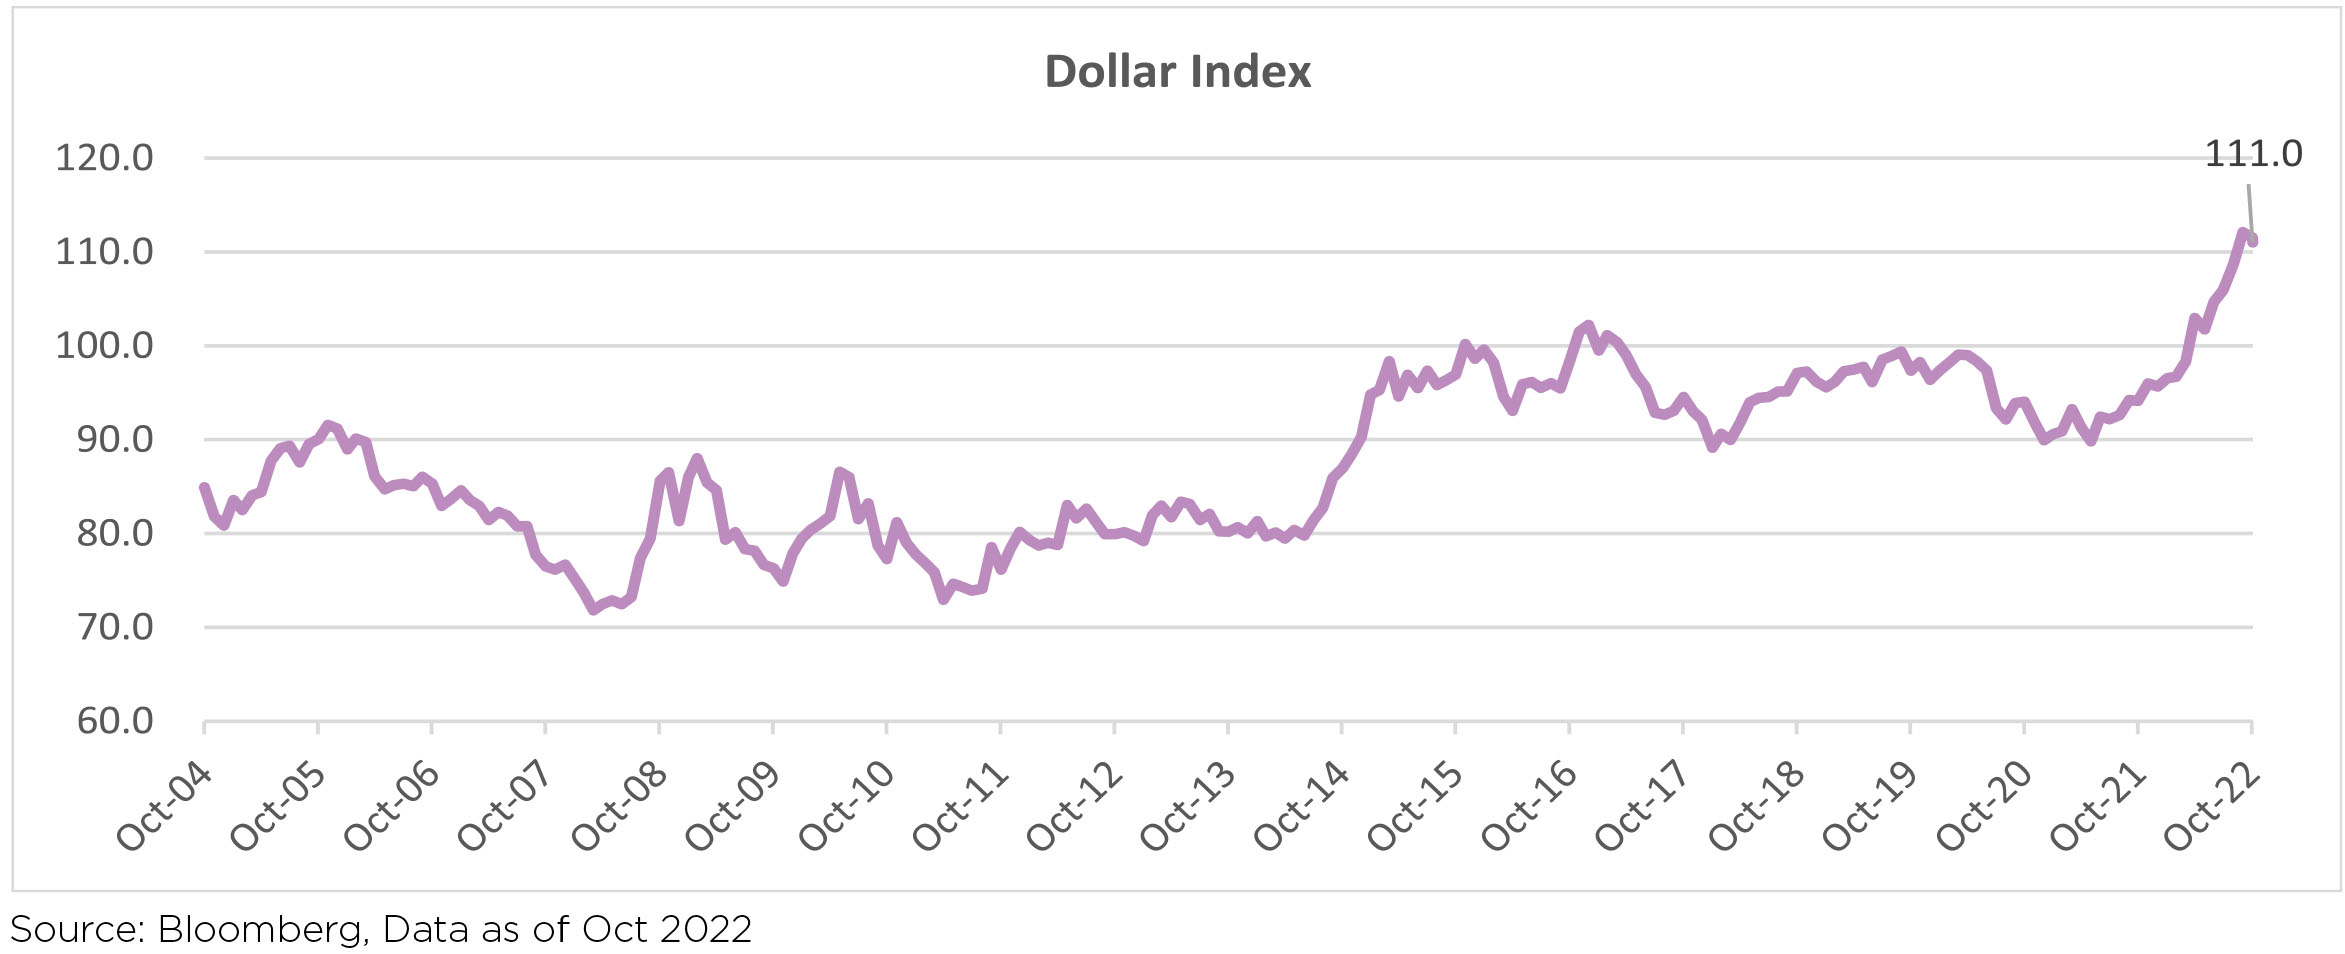
INR depreciated by 1.7% MoM, reaching ~82.79/USD at the end of October. DXY (Dollar Index) weakened marginally over the month and closed at 111.
Commodities, Interest rate and Inflation:
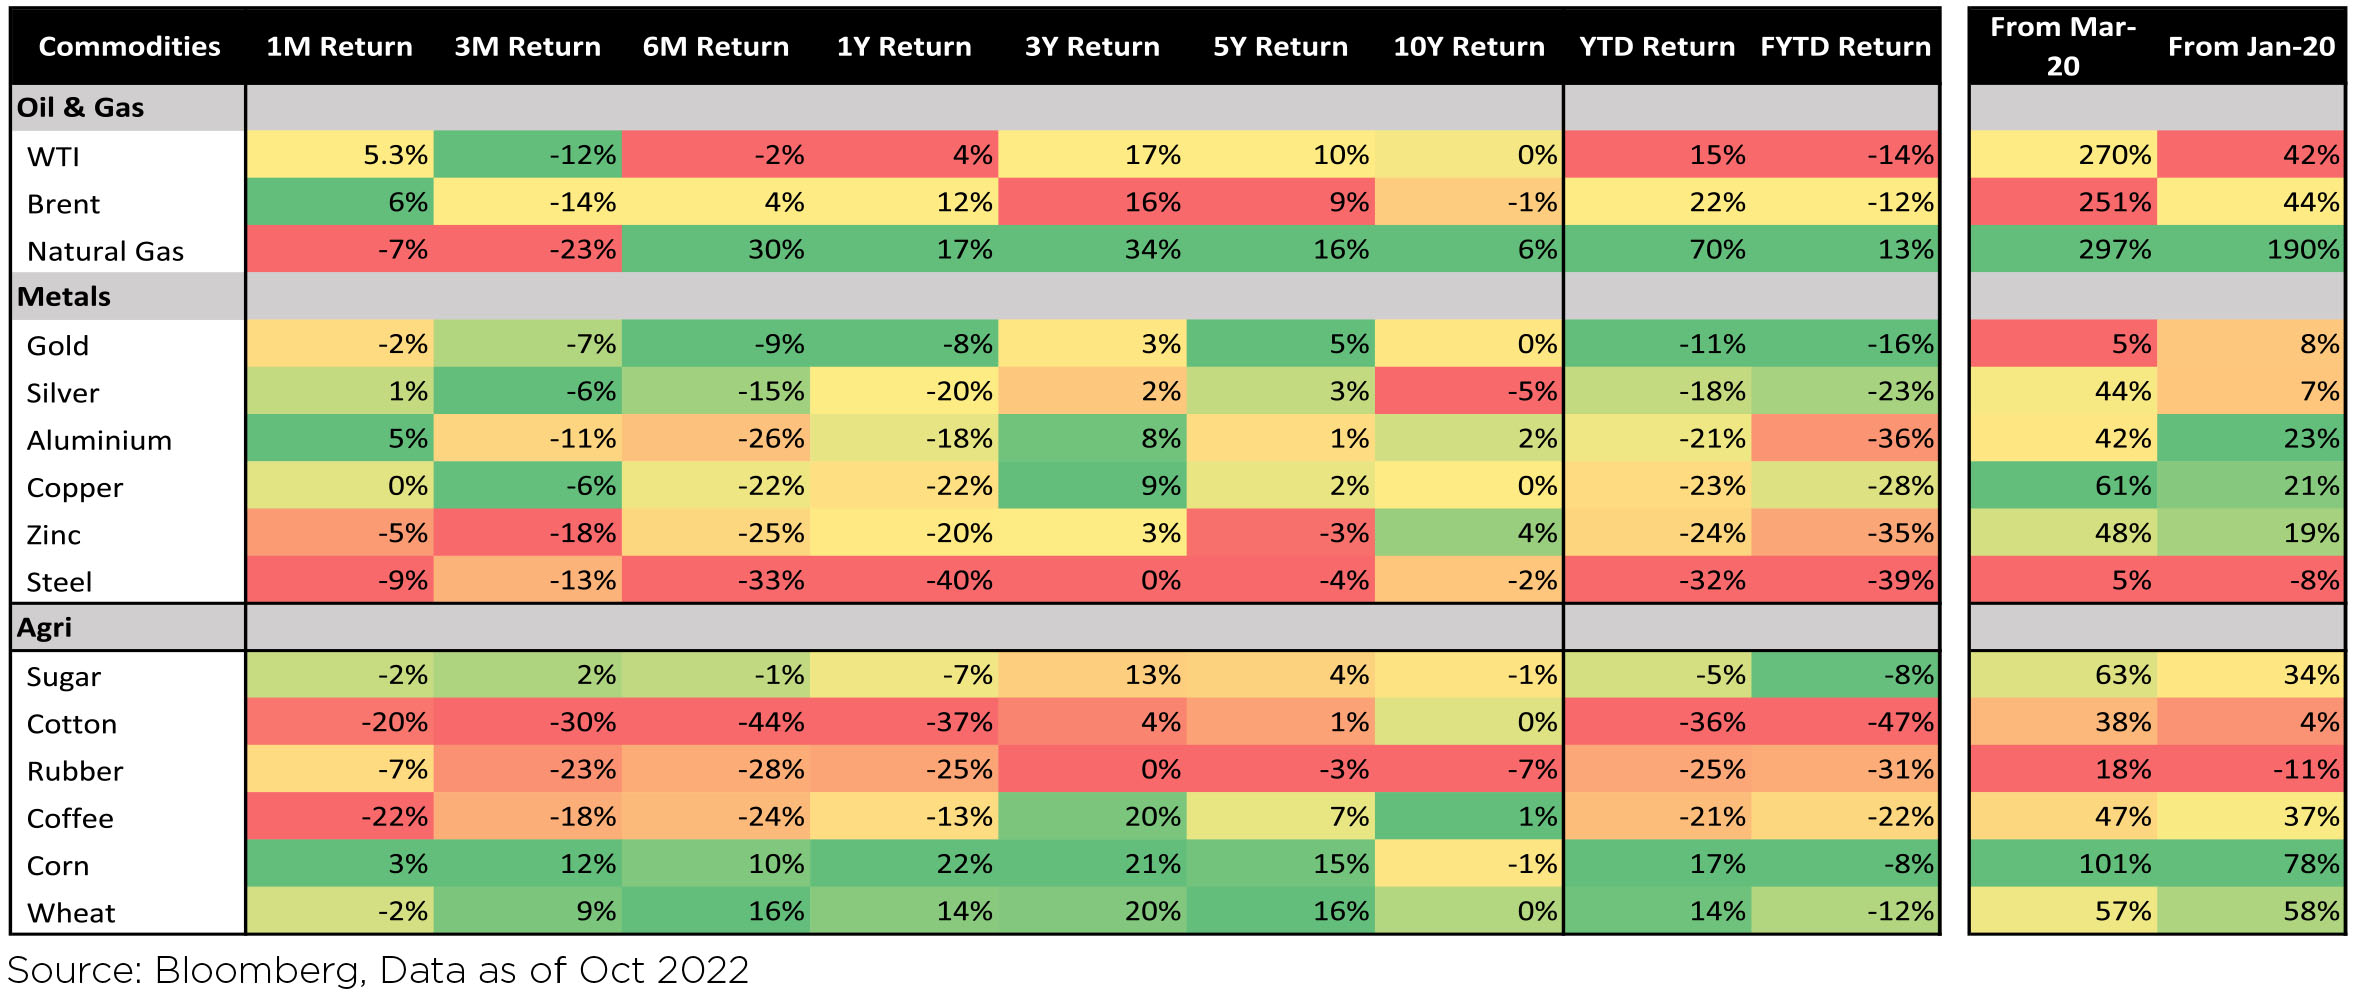
Brent crude prices rose (+6.2%) over the month of October, following steady declines since June. Weakness is seen in prices amidst weaker than expected manufacturing data from China, hinting towardsdemand worries.
Indian bond yields closed higher amidst anticipation ahead of US Fed policy and an additional MPC meeting on November 3rd. The 10-Yr closed at 7.45 (+3 bps) and the 5-Yr closed at 7.37 (+3 bps).
Domestically, the quantum of excess rainfall is receding and rabi sowing has picked up a good pace across cereals supported by reservoir levels are at 89% of total capacity (much higher than the long period average). 1st advance estimates for FY23 indicated a 4% decline in food grains and a 1% decline in pulses (with the first decline in rice after eight years).
Macro prints deteriorated:
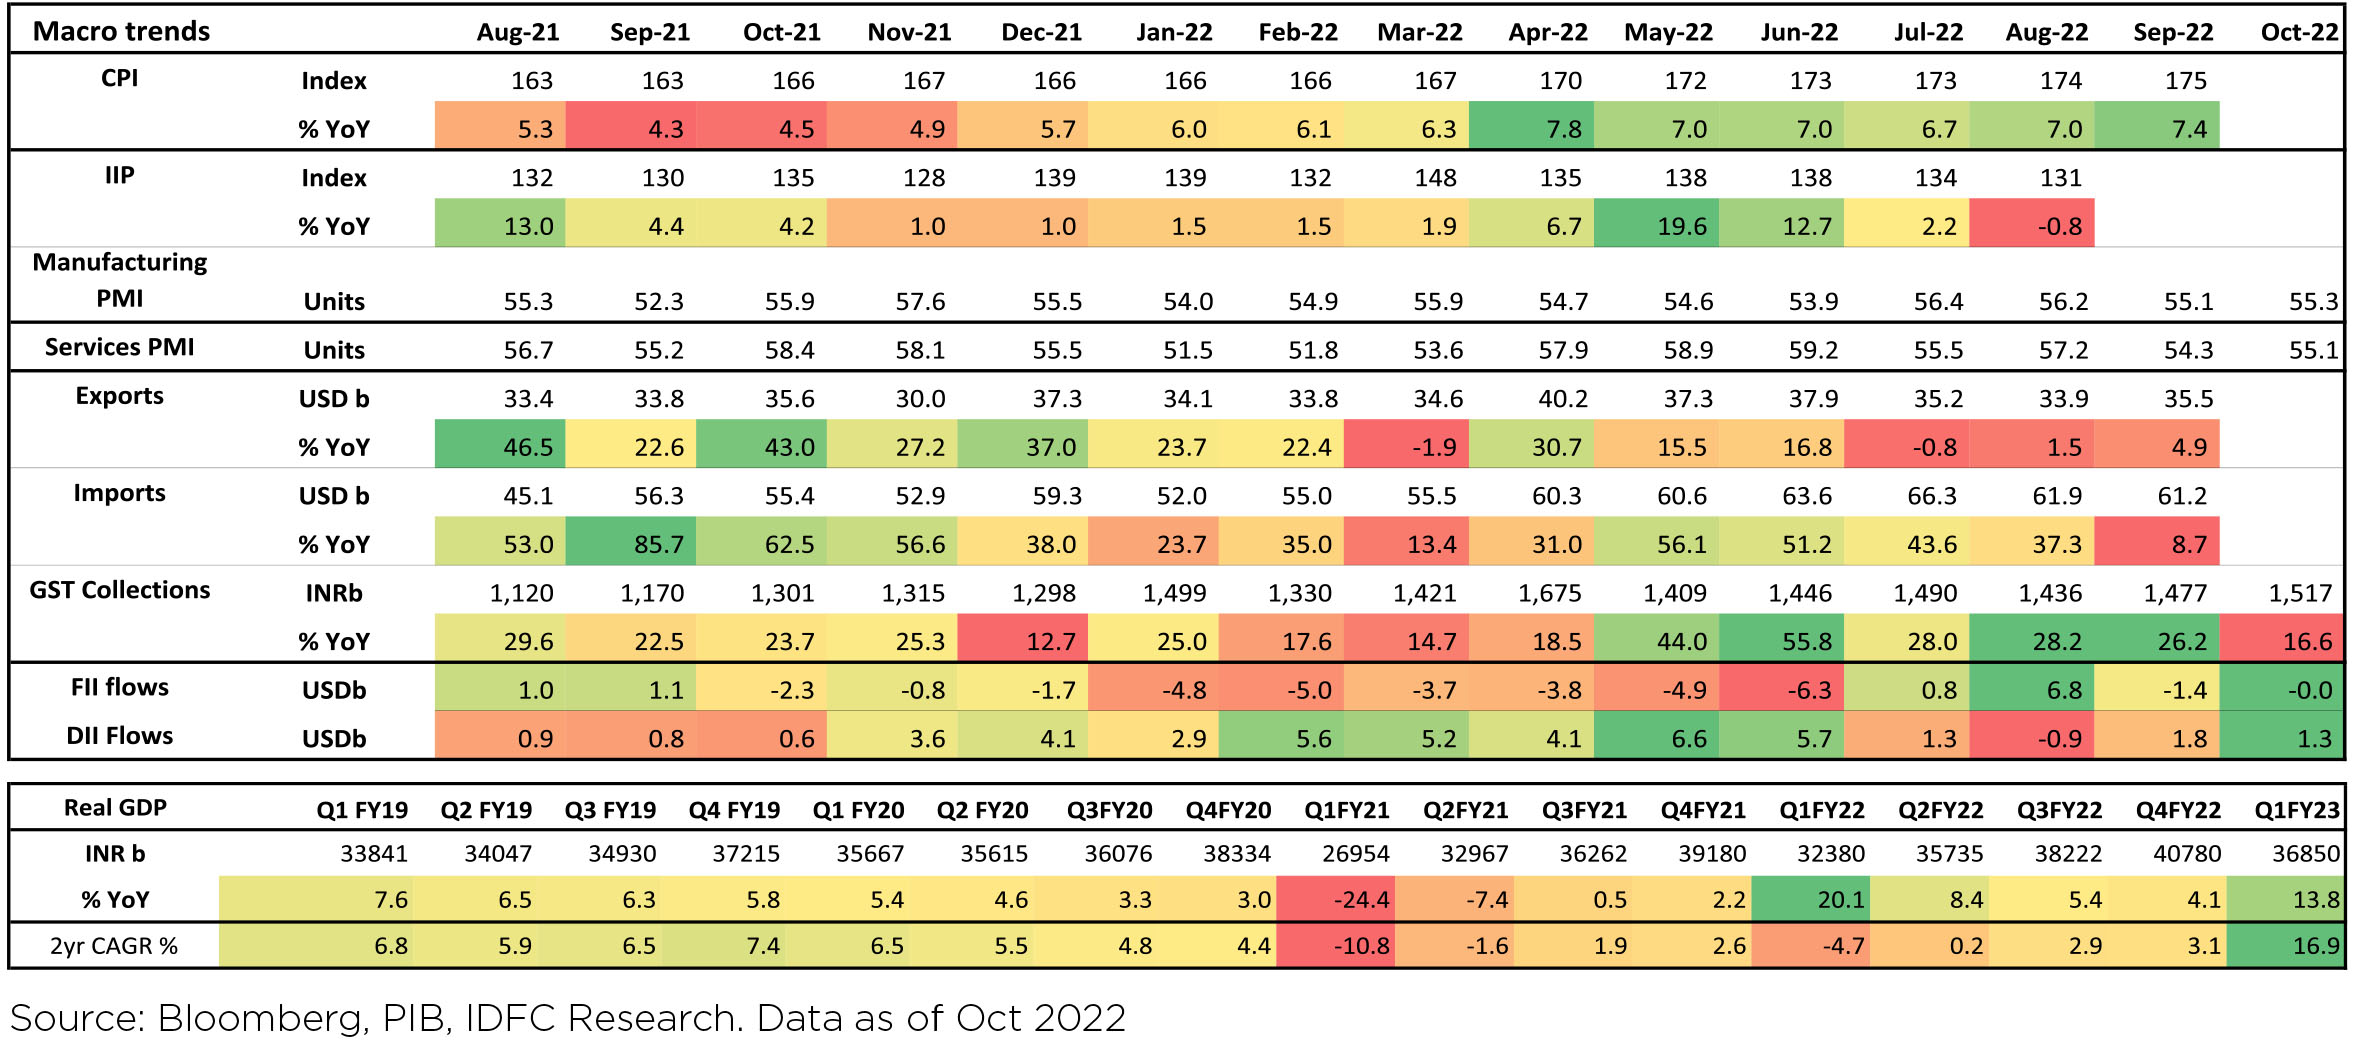
► Fiscal deficit YTD has touched 37.3% of BE v/s 33% last month. Upbeat direct and indirect tax collections was offset by an increase in spending, both revenue (6% YTD) and capital (49.5% to Rs.3.4tn YTD).
► Manufacturing PMI came in at 55.3 for Oct-22 v/s 55.1 in Sept-22, reflecting an increase in employment, stocks of purchase, and improved demand. October Services PMI rose to 55.1 vs. 54.3 last month indicating a recovery in some of the growth momentum lost in the last month.
► GST collections rose to 1.52tn in Oct-22 vs 1.48tn in Sept-22.
► September'22 CPI continued to rise since July and was up 7.4%; August's Industrial production fell sharply (-0.8% YoY).
► India's foreign exchange reserves continue to fall ($533bn now) as policymakers mitigate the transmission of global volatility/ tightness to India. The deterioration in the Current Account is not only on account of higher oil, but Coal also has been a bigger culprit so far. Weakening INR is causing a double whammy to the external account.
FII flows remained flat for the month, following -$1.6bn outflows in September. So far, India has seen YTD FII outflows of $22.6bn. DIIs saw buying of $1.3bn in October, with YTD inflows of $33.8bn. Mutual funds and Insurance funds were both net buyers in October.
For the September'22 Earnings season so far, we are seeing 4th straight quarter of downgrades higher than the earnings upgrades. Nifty consensus earnings for FY23 have also seen -2.3% revision during the results season with another ~1% cut due to index component changes. Consumer durables, Industrials, Cement, and Metals have seen cuts; though margin pressures are estimated to ease going ahead. On the positive side, the cyclical viz. autos and banks have seen upgrades. Also, strong order booking by contractors/developers is seen, raising the hopes of eventual Pvt CAPEX recovery. What remains crucial to be seen is whether the FY23 Nifty earnings growth holds up to the double-digit consensus YoY growth estimates.
Indian equities rose +3.9% MoM (in USD terms), while outperforming the APAC region and its peers (MSCI APxJ/EM: -4.2%/-3.2%).
Domestic Markets
INR depreciated by 1.7% MoM, reaching ~82.79/USD at the end of October. DXY (Dollar Index) weakened marginally over the month and closed at 111.
Commodities, Interest rate and Inflation:
Brent crude prices rose (+6.2%) over the month of October, following steady declines since June. Weakness is seen in prices amidst weaker than expected manufacturing data from China, hinting towardsdemand worries.
Indian bond yields closed higher amidst anticipation ahead of US Fed policy and an additional MPC meeting on November 3rd. The 10-Yr closed at 7.45 (+3 bps) and the 5-Yr closed at 7.37 (+3 bps).
Domestically, the quantum of excess rainfall is receding and rabi sowing has picked up a good pace across cereals supported by reservoir levels are at 89% of total capacity (much higher than the long period average). 1st advance estimates for FY23 indicated a 4% decline in food grains and a 1% decline in pulses (with the first decline in rice after eight years).
Macro prints deteriorated:
► Fiscal deficit YTD has touched 37.3% of BE v/s 33% last month. Upbeat direct and indirect tax collections was offset by an increase in spending, both revenue (6% YTD) and capital (49.5% to Rs.3.4tn YTD).
► Manufacturing PMI came in at 55.3 for Oct-22 v/s 55.1 in Sept-22, reflecting an increase in employment, stocks of purchase, and improved demand. October Services PMI rose to 55.1 vs. 54.3 last month indicating a recovery in some of the growth momentum lost in the last month.
► GST collections rose to 1.52tn in Oct-22 vs 1.48tn in Sept-22.
► September'22 CPI continued to rise since July and was up 7.4%; August's Industrial production fell sharply (-0.8% YoY).
► India's foreign exchange reserves continue to fall ($533bn now) as policymakers mitigate the transmission of global volatility/ tightness to India. The deterioration in the Current Account is not only on account of higher oil, but Coal also has been a bigger culprit so far. Weakening INR is causing a double whammy to the external account.
FII flows remained flat for the month, following -$1.6bn outflows in September. So far, India has seen YTD FII outflows of $22.6bn. DIIs saw buying of $1.3bn in October, with YTD inflows of $33.8bn. Mutual funds and Insurance funds were both net buyers in October.
For the September'22 Earnings season so far, we are seeing 4th straight quarter of downgrades higher than the earnings upgrades. Nifty consensus earnings for FY23 have also seen -2.3% revision during the results season with another ~1% cut due to index component changes. Consumer durables, Industrials, Cement, and Metals have seen cuts; though margin pressures are estimated to ease going ahead. On the positive side, the cyclical viz. autos and banks have seen upgrades. Also, strong order booking by contractors/developers is seen, raising the hopes of eventual Pvt CAPEX recovery. What remains crucial to be seen is whether the FY23 Nifty earnings growth holds up to the double-digit consensus YoY growth estimates.
Market Performance
Outlook
The divergence of Indian markets with either Emerging markets or even Developed markets is becoming curiouser and curiouser. India shining amidst a pall of global gloom is not a belief we have had to face as investors many times before. Usually, if Developed (read, US) markets sneezed, emerging markets caught a cold. The case for "global caution" - a term we have coined, is well documented - US markets (MSCI USA) are down by -17% YTD; Europe markets are in a funk (MSCI Europe down -26% YTD), awaiting a "winter of extreme discomfort"; China's Covid policy has forced the Government to defer declaring quarterly GDP growth numbers (MSCI China down -44% YTD); Crude oil production is planned to be reduced by OPEC+ by 2mn barrels per day from Nov'22; inflation in Developed economies is higher than many emerging markets. Yet amidst all this pall of gloom, Indian equity markets continue to defy rules of "equity gravity" - every EM market is destined to fall each & every time the US market falls!
Logic and rationality, it appears have taken a back seat. Liquidity and flows rule the roost. While every equity bull market is always fueled by easy and cheap liquidity; currently RBI has taken several measured steps to curb liquidity - even housing loan rates are up 150bps in just over a quarter. Yet, Indian equities continue to stay strong. Amidst all these rational "fears" the market mood appears robust - retail participation in Options trading hasn't reduced sharply from the Oct-Dec'21 quarter when Nifty spiked to a new all-time high. MF flows, especially SIP flows remain robust. FII flows remain uneven, after briefly turning positive in July-August'22, and turned negative from September'22.
Today, when one can easily counter every positive with a negative and vice versa without taking a polemic side on either side of this argument, we have consciously tried to respect and follow one factor which we believe will work in such contrasting and confusing times - follow the earnings trail. Rather than focus exclusively on valuations, we are focusing primarily on sectors with strong visibility of earnings growth over the next two/three quarters - Banks incl. PSU banks; Automobiles and ancillaries; Capital goods; Hospitality - Hotels and QSRs; and some emerging sectors like Defence which we have missed. Hopefully, by having exposure across most of the segments of the markets which will deliver the earnings pool growth over the next few years, we will be relatively better placed. We have also become more selective while evaluating IPOs, another area where mistakes creep in.
A similar conundrum is faced by investors - with all experts forecasting caution, do not get swayed to reduce equity nor rush to increase allocation. This is the time to stay put and learn the meaning that equity investing is akin to a roller coaster ride. Buckle up and enjoy the ride.
Note: The above graph is for representation purposes only and should not be used for the development or implementation of an investment strategy. Past performance may or may not be sustained in the future.
What Went By
ConsumerConsumer Price Index (CPI) inflation in India was 7.4% y/y in September, after 7% in August, as food price
momentum picked up further. Core inflation (CPI excluding food and beverages, fuel and light) was at 6.1%
in September, and has averaged 6.1% in H1 FY23 and 6% in FY22. Real time prices of edible oils, vegetables,
pulses and wheat have moved up sequentially in October. Among vegetables, price of onions has picked up in
October while that of tomatoes has moderated mildly after two months of strong increase.
During April-September of FY23, central government net tax revenue growth was 9.9% y/y while total expenditure grew 12.2%. Fiscal deficit so far is thus 37.3% of FY23 budget estimate vs. 33.1% this time last year. Small savings inflow during April-September 2022 was slightly lower than that during the same period of last year but needs to be ~Rs. 61,000cr higher during the remaining fiscal year (vs. last year). GST collection continued to remain robust at Rs. 1.52 lakh crore and 17% y/y during October.
Industrial production (IP) growth was -0.8% y/y in August after 2.2% in July. On a seasonally adjusted month-onmonth basis, it was -2.8% in August after -4.7% in July. Output momentum stayed negative across categories of consumer, capital, intermediate, infrastructure and construction goods in August while that in primary goods turned positive. Infrastructure Industries output (40% weight in IP) was up 1.7% m/m seasonally adjusted in September and 2.8% in August, after being negative for three months.
Bank credit outstanding as on 21st October was up 17.9% y/y and has averaged 13.7% since April 2022 (up from 8% during January-March), likely also due to higher inflation and thus higher demand for working capital. Bank deposit growth was at 9.5%. Credit flow till date during the financial year has been much higher in FY22, vs. FY20 and FY21, while deposit flow has been lower. During FY22, overall bank credit flow so far has been the highest for personal loans and lowest for industries.
Merchandise trade deficit eased slightly to USD 25.7bn in September from USD 28bn in August. In September, non-oil exports and oil imports continued to sequentially moderate for the third month (possibly also price effect), while non-oil-non-gold imports increased after moderating in August. Trade deficit has averaged USD 22.1bn since September 2021 vs. USD 10.8bn during April-August 2021. During the same periods, non-oil-nongold imports picked up to an average of USD 38.6bn vs. USD 29.3bn.
Among higher-frequency variables, number of two-wheelers registered picked up sharply from October (likely also festive season effect) while energy consumption level has eased but is above previous year level. Monthly number of GST e-way bills generated continues to remain strong, although it moved down to 7.7cr units in October from 8.4cr in September (again likely also festive season effect) and 7.8cr in August. It has averaged 7.9cr in the September quarter after 7.4cr in the June quarter.
US headline CPI was at 8.2% y/y in September after 8.3% in August, with the sequential momentum being impacted by the drop in energy prices. However, Core CPI moved further higher at 6.6% in September after 6.3% in August. Housing rent momentum picked further up and stayed high. US non-farm payroll addition in October (261,000 persons) was below that in September (315,000 persons) but remained buoyant. Unemployment rate moved back up to 3.7% in October (as in August) from 3.5% in September, and sequential growth in average hourly earnings inched up. Non-farm job openings as per the Job Openings and Labor Turnover Survey (JOLTS) increased sequentially by 0.4mn in September, after the big drop of 0.9mn in August. The FOMC (Federal Open Market Committee) raised the target range for the federal funds rate, by 75 bps for the fourth time and a total of 375bps so far in 2022, to the 3.75-4.00% range on 02nd November. The FOMC meeting statement said it will take into account the cumulative tightening of monetary policy, the lags with which monetary policy affects economic activity and inflation, and economic and financial developments in determining the pace of future increases in the target range. However, the Fed Governor in his interaction after the FOMC meeting said incoming data since last FOMC meeting suggests ultimate level of interest rate will be higher than previously expected and that it is very premature to think about pausing.
The European Central Bank's Governing Council, in its monetary policy decision on 27th October, raised all the three key interest rates by 75bps (after 75bps in September and 50bps in July). It said future decisions will take into consideration the inflation outlook, measures taken so far and transmission lag of monetary policy. However, it also noted that it is not by simply normalising monetary policy that it will identify and reach the interest rates that are necessary in order to deliver the 2% inflation target over the medium term. In its September meeting, when forecasts were last provided, it forecasted Euro Area inflation at 8.1% y/y in 2022, 5.5% in 2023 and 2.3% in 2024. Although its baseline GDP forecast is +0.9% for 2023, the downside scenario (which includes a total shutdown of all Russian gas supply and no other alternative sources of supply including that of LNG) projected a recession in 2023 (GDP forecast of -0.9%).
China has been facing several domestic economic issues since 2021 - a property sector meltdown which started with the payment default by a major property developer, power crunch due to coal shortage last year, more recent power rationing as a severe drought impacted hydropower generation, and particularly, multiple and extensive lockdowns as part of its Zero Covid Strategy. Policy response to the issues so far has been measured, including cuts to Required Reserve Ratio & Loan Prime Rate, additional quota for policy banks (to channel targeted loans) & local government special bonds, and a focus on infrastructure investment. In October, it announced an easing of the lower bound of mortgage rate for first time home buyers, tax rebates and rate cuts to Housing Provident Fund to support home purchases. More recently, there has been some speculation on relaxation of China's Covid norms but the official communication so far does not suggest this. Further, China's export growth (in USD terms) turned negative in October while import growth also eased.
Outlook
We have presented detailed arguments on our view of RBI not needing to be in lock-step with Fed before. Subsequently, two external members of the MPC seem to have echoed our logic with both likely to vote for a pause in the upcoming December policy (even as we still expected a final 25 - 35 bps hike in December). A third external member was still hawkish but will likely vote for a scaling down on the pace of normalization (that is vote for less than 50 bps hike). An internal RBI member was debating 35 bps or 50 bps for the September meeting itself, which seems to suggest he would be unlikely to vote for a full 50 bps in December. The one caveat is that these observations are basis their last heard views which may have undergone modification by now. A potential reason for some modification, apart from Fed rate expectations having gone further up (may not be material for two external members), is that India's local food inflation pressures have inched up. Basis available data, our own forecast of Oct-Dec average CPI is around 40 bps higher than RBI's projection of 6.5%.
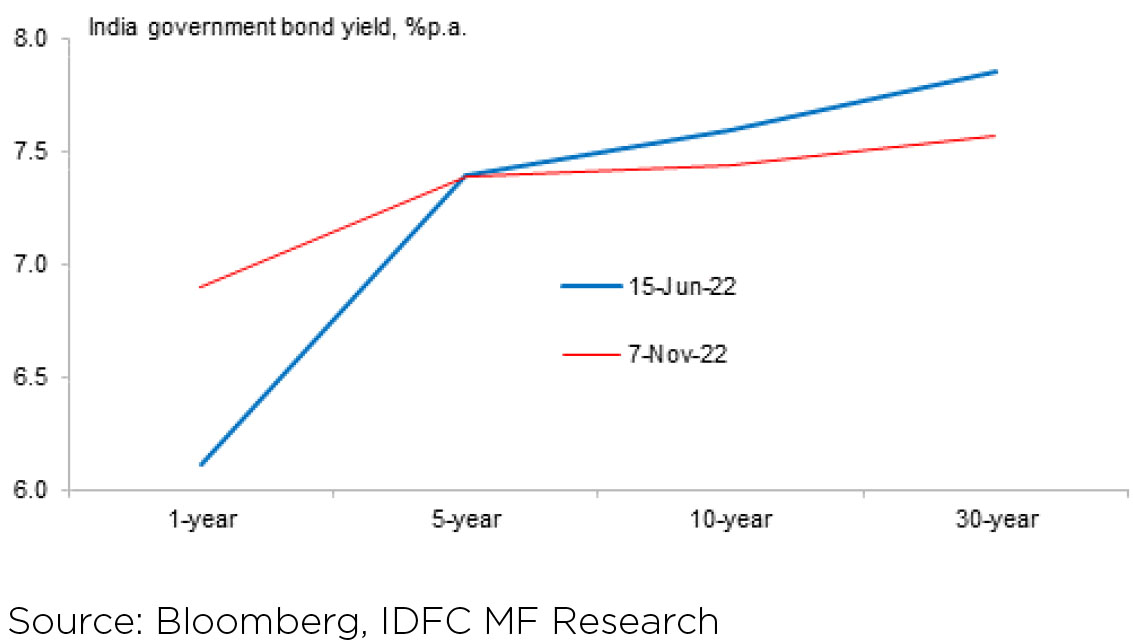
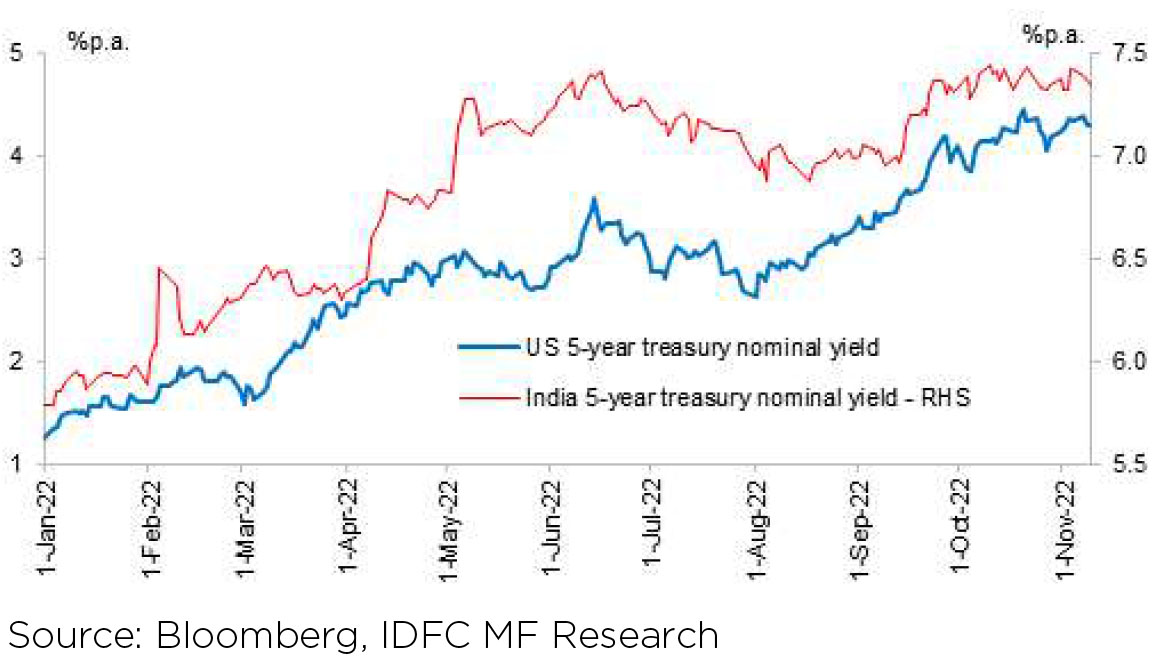
It is possible that there is some upward shift in our own terminal repo rate expectations basis the above. The bigger point though is that so long as terminal is 6.50% centric, it can be argued that sovereign bond valuations at the front end have largely adjusted for this. This will be especially true if imported volatility starts to subside. In fact, the evolution of Indian bond yields has been quite interesting so far this year. The bulk of upward adjustment actually happened in the short period between April and June as market repriced the change in RBI reaction function. However, unlike many of their DM peers, Indian yields haven't gone higher than their June highs; save for at the very front end which was to be expected as the rate cycle progressed. Indeed, while yields in the 5-year segment are similar to what they were in mid-June, those in 10 year and beyond are actually lower. The next two graphs compare the Indian yield curve between June and now, and the evolution of Indian yields versus US.
It is to be noted, however, that though we expect peak RBI to peak Fed differential to be lower in this cycle,
we expect the differential to open up again over the time ahead. The Fed is peaking much higher than
long term neutral. This is owing to much higher than usual inflation, the bulk of which is presumably cyclical.
As inflation starts to come off, Fed policy rate will also start to move towards neutral over the next couple of
years. On the other hand, since RBI is peaking not far from neutral it may have to hold rates there for longer.
Thus some of market's rate differential concerns may get addressed not by RBI being in lockstep with Fed now but rather it holding rates at peak for much longer than the Fed, in our view. That said, market may still respond by compressing term premium between front end rates (up to 5 years) and policy rate during this period. Again, however, this is possibly trying to look too much into the future. For now one is only watchful for signs of volatility stabilising at a valuation which is quite comfortable so far as government bonds up to 5 years' maturity are concerned.
During April-September of FY23, central government net tax revenue growth was 9.9% y/y while total expenditure grew 12.2%. Fiscal deficit so far is thus 37.3% of FY23 budget estimate vs. 33.1% this time last year. Small savings inflow during April-September 2022 was slightly lower than that during the same period of last year but needs to be ~Rs. 61,000cr higher during the remaining fiscal year (vs. last year). GST collection continued to remain robust at Rs. 1.52 lakh crore and 17% y/y during October.
Industrial production (IP) growth was -0.8% y/y in August after 2.2% in July. On a seasonally adjusted month-onmonth basis, it was -2.8% in August after -4.7% in July. Output momentum stayed negative across categories of consumer, capital, intermediate, infrastructure and construction goods in August while that in primary goods turned positive. Infrastructure Industries output (40% weight in IP) was up 1.7% m/m seasonally adjusted in September and 2.8% in August, after being negative for three months.
Bank credit outstanding as on 21st October was up 17.9% y/y and has averaged 13.7% since April 2022 (up from 8% during January-March), likely also due to higher inflation and thus higher demand for working capital. Bank deposit growth was at 9.5%. Credit flow till date during the financial year has been much higher in FY22, vs. FY20 and FY21, while deposit flow has been lower. During FY22, overall bank credit flow so far has been the highest for personal loans and lowest for industries.
Merchandise trade deficit eased slightly to USD 25.7bn in September from USD 28bn in August. In September, non-oil exports and oil imports continued to sequentially moderate for the third month (possibly also price effect), while non-oil-non-gold imports increased after moderating in August. Trade deficit has averaged USD 22.1bn since September 2021 vs. USD 10.8bn during April-August 2021. During the same periods, non-oil-nongold imports picked up to an average of USD 38.6bn vs. USD 29.3bn.
Among higher-frequency variables, number of two-wheelers registered picked up sharply from October (likely also festive season effect) while energy consumption level has eased but is above previous year level. Monthly number of GST e-way bills generated continues to remain strong, although it moved down to 7.7cr units in October from 8.4cr in September (again likely also festive season effect) and 7.8cr in August. It has averaged 7.9cr in the September quarter after 7.4cr in the June quarter.
US headline CPI was at 8.2% y/y in September after 8.3% in August, with the sequential momentum being impacted by the drop in energy prices. However, Core CPI moved further higher at 6.6% in September after 6.3% in August. Housing rent momentum picked further up and stayed high. US non-farm payroll addition in October (261,000 persons) was below that in September (315,000 persons) but remained buoyant. Unemployment rate moved back up to 3.7% in October (as in August) from 3.5% in September, and sequential growth in average hourly earnings inched up. Non-farm job openings as per the Job Openings and Labor Turnover Survey (JOLTS) increased sequentially by 0.4mn in September, after the big drop of 0.9mn in August. The FOMC (Federal Open Market Committee) raised the target range for the federal funds rate, by 75 bps for the fourth time and a total of 375bps so far in 2022, to the 3.75-4.00% range on 02nd November. The FOMC meeting statement said it will take into account the cumulative tightening of monetary policy, the lags with which monetary policy affects economic activity and inflation, and economic and financial developments in determining the pace of future increases in the target range. However, the Fed Governor in his interaction after the FOMC meeting said incoming data since last FOMC meeting suggests ultimate level of interest rate will be higher than previously expected and that it is very premature to think about pausing.
The European Central Bank's Governing Council, in its monetary policy decision on 27th October, raised all the three key interest rates by 75bps (after 75bps in September and 50bps in July). It said future decisions will take into consideration the inflation outlook, measures taken so far and transmission lag of monetary policy. However, it also noted that it is not by simply normalising monetary policy that it will identify and reach the interest rates that are necessary in order to deliver the 2% inflation target over the medium term. In its September meeting, when forecasts were last provided, it forecasted Euro Area inflation at 8.1% y/y in 2022, 5.5% in 2023 and 2.3% in 2024. Although its baseline GDP forecast is +0.9% for 2023, the downside scenario (which includes a total shutdown of all Russian gas supply and no other alternative sources of supply including that of LNG) projected a recession in 2023 (GDP forecast of -0.9%).
China has been facing several domestic economic issues since 2021 - a property sector meltdown which started with the payment default by a major property developer, power crunch due to coal shortage last year, more recent power rationing as a severe drought impacted hydropower generation, and particularly, multiple and extensive lockdowns as part of its Zero Covid Strategy. Policy response to the issues so far has been measured, including cuts to Required Reserve Ratio & Loan Prime Rate, additional quota for policy banks (to channel targeted loans) & local government special bonds, and a focus on infrastructure investment. In October, it announced an easing of the lower bound of mortgage rate for first time home buyers, tax rebates and rate cuts to Housing Provident Fund to support home purchases. More recently, there has been some speculation on relaxation of China's Covid norms but the official communication so far does not suggest this. Further, China's export growth (in USD terms) turned negative in October while import growth also eased.
Outlook
We have presented detailed arguments on our view of RBI not needing to be in lock-step with Fed before. Subsequently, two external members of the MPC seem to have echoed our logic with both likely to vote for a pause in the upcoming December policy (even as we still expected a final 25 - 35 bps hike in December). A third external member was still hawkish but will likely vote for a scaling down on the pace of normalization (that is vote for less than 50 bps hike). An internal RBI member was debating 35 bps or 50 bps for the September meeting itself, which seems to suggest he would be unlikely to vote for a full 50 bps in December. The one caveat is that these observations are basis their last heard views which may have undergone modification by now. A potential reason for some modification, apart from Fed rate expectations having gone further up (may not be material for two external members), is that India's local food inflation pressures have inched up. Basis available data, our own forecast of Oct-Dec average CPI is around 40 bps higher than RBI's projection of 6.5%.
It is possible that there is some upward shift in our own terminal repo rate expectations basis the above. The bigger point though is that so long as terminal is 6.50% centric, it can be argued that sovereign bond valuations at the front end have largely adjusted for this. This will be especially true if imported volatility starts to subside. In fact, the evolution of Indian bond yields has been quite interesting so far this year. The bulk of upward adjustment actually happened in the short period between April and June as market repriced the change in RBI reaction function. However, unlike many of their DM peers, Indian yields haven't gone higher than their June highs; save for at the very front end which was to be expected as the rate cycle progressed. Indeed, while yields in the 5-year segment are similar to what they were in mid-June, those in 10 year and beyond are actually lower. The next two graphs compare the Indian yield curve between June and now, and the evolution of Indian yields versus US.
Thus some of market's rate differential concerns may get addressed not by RBI being in lockstep with Fed now but rather it holding rates at peak for much longer than the Fed, in our view. That said, market may still respond by compressing term premium between front end rates (up to 5 years) and policy rate during this period. Again, however, this is possibly trying to look too much into the future. For now one is only watchful for signs of volatility stabilising at a valuation which is quite comfortable so far as government bonds up to 5 years' maturity are concerned.
