Commentary

Commentary
|
|
|
|
|

|


Global Markets
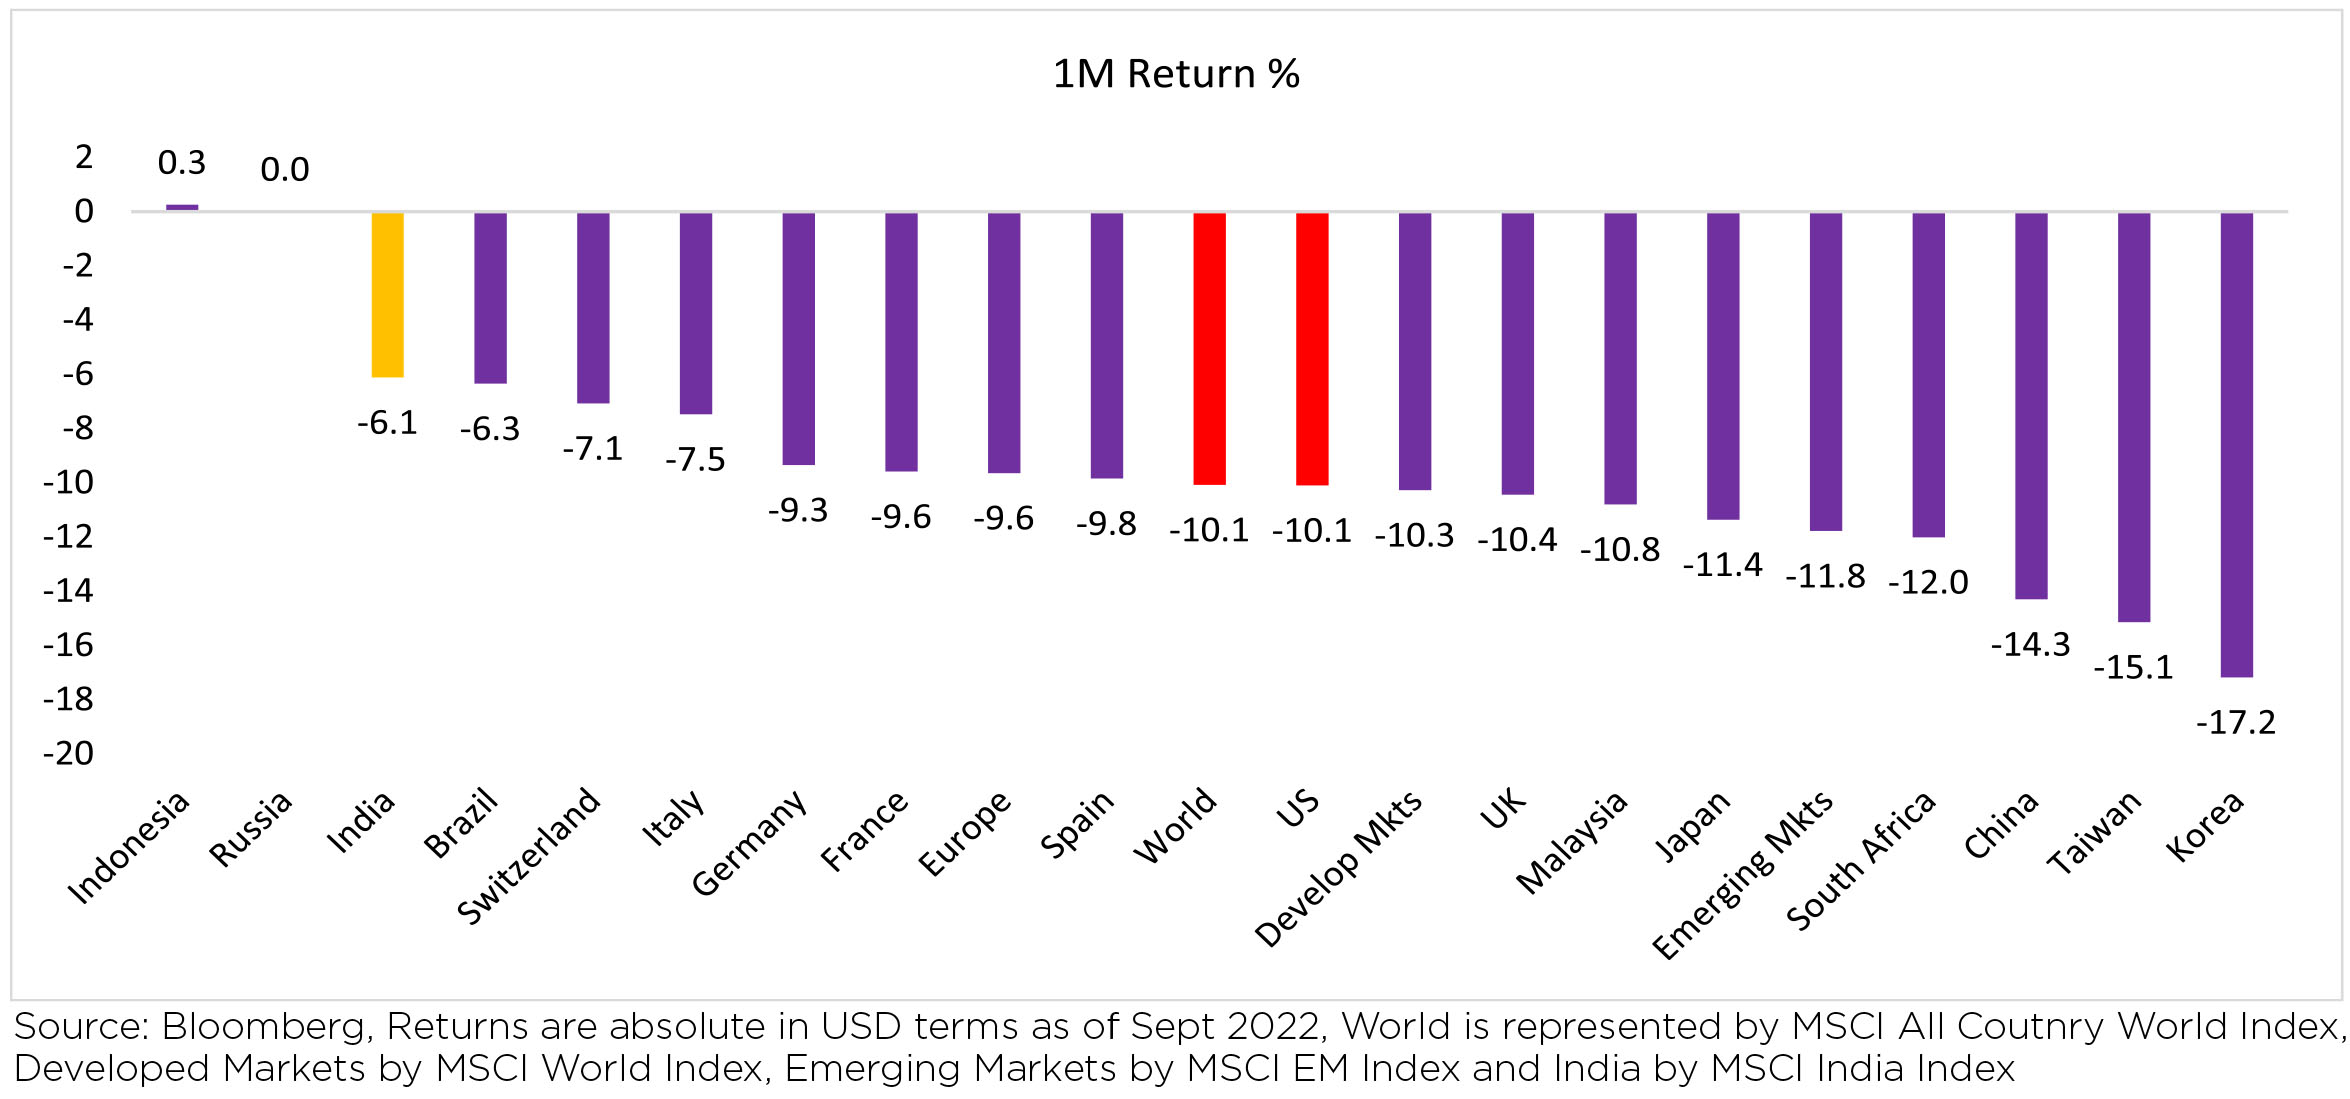
Global equities weakened across regions (-10.1% MoM/ -26.7% YTD). All major Emerging markets (EM)
/ DM regions were in the red with India outperforming the World and Emerginng markets (-10.1%/-11.8%).
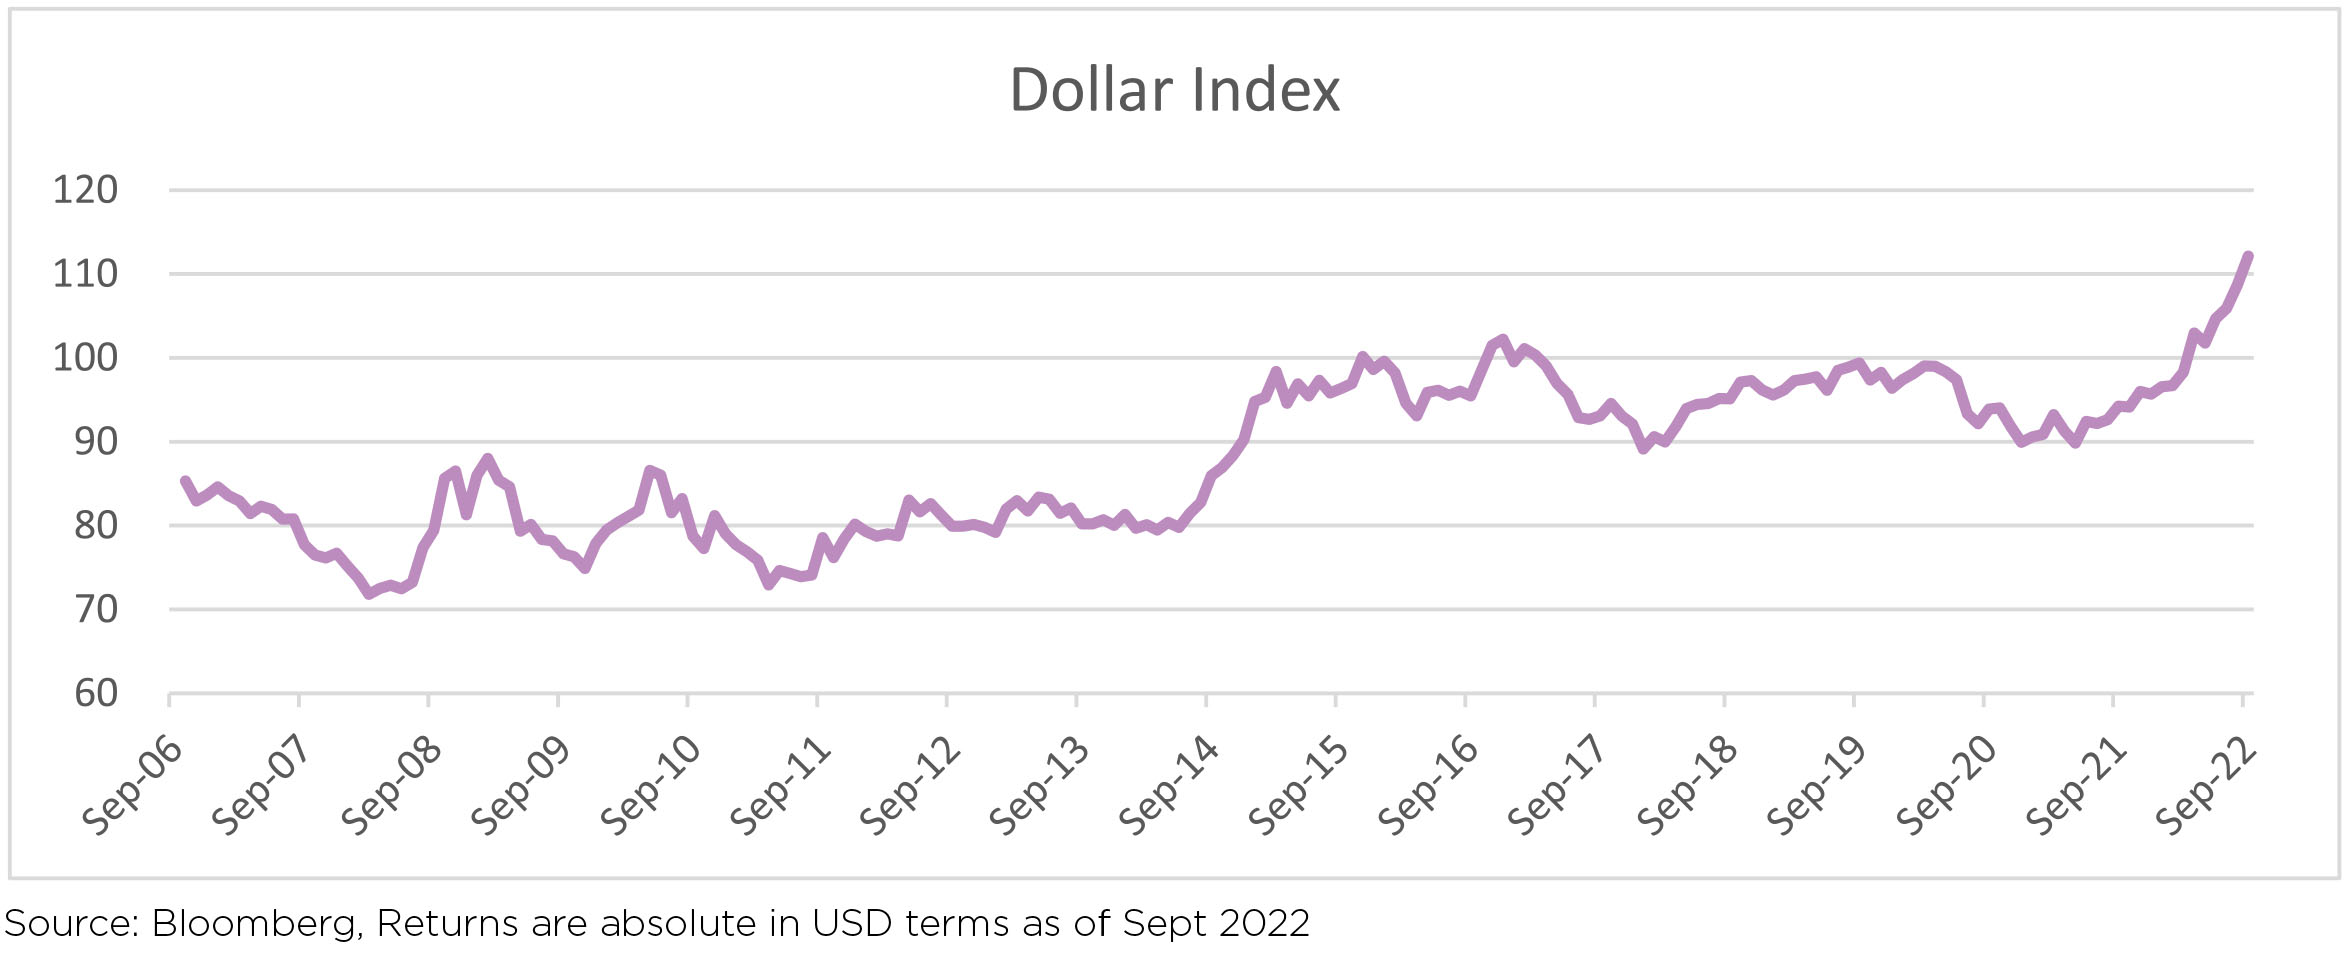
In the current episode of US Dollar strengthening, Emerging markets have remained largely unscathed, as compared to previous periods in 2008 & 2013. With US 2-year yields crossing 4%, the spreads between US 10-year and EM 10-year Bonds have remained stable. Thus, defying the "conventional" response of expanding spreads during phases of US$ strngthening. However, victory should not be declared in haste by the "decoupling" believers, as any slip up across Emerging Markets may still lead to creating ripples across "Lake Placid - EM currency & debt".
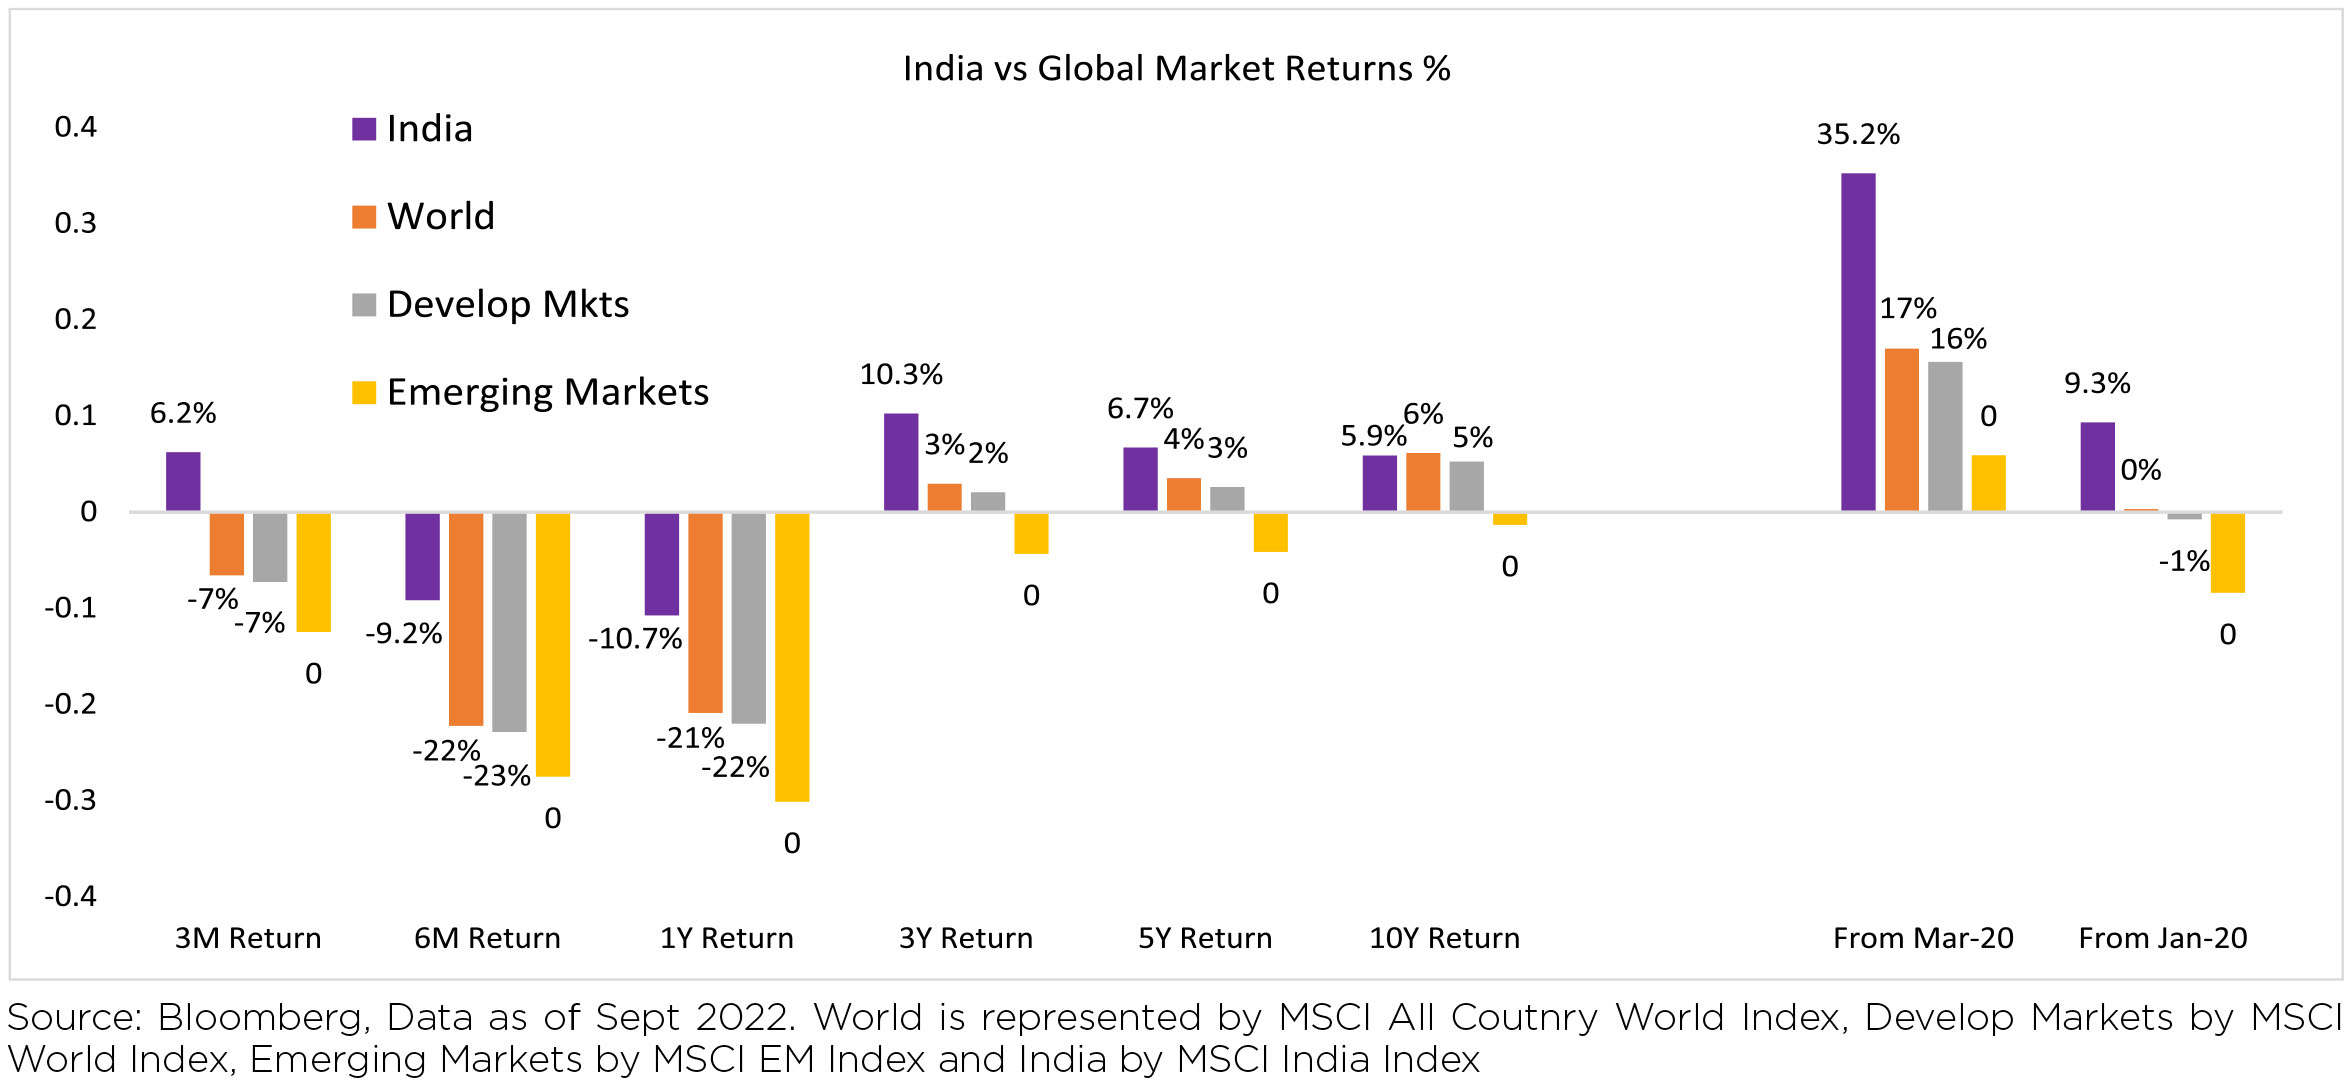
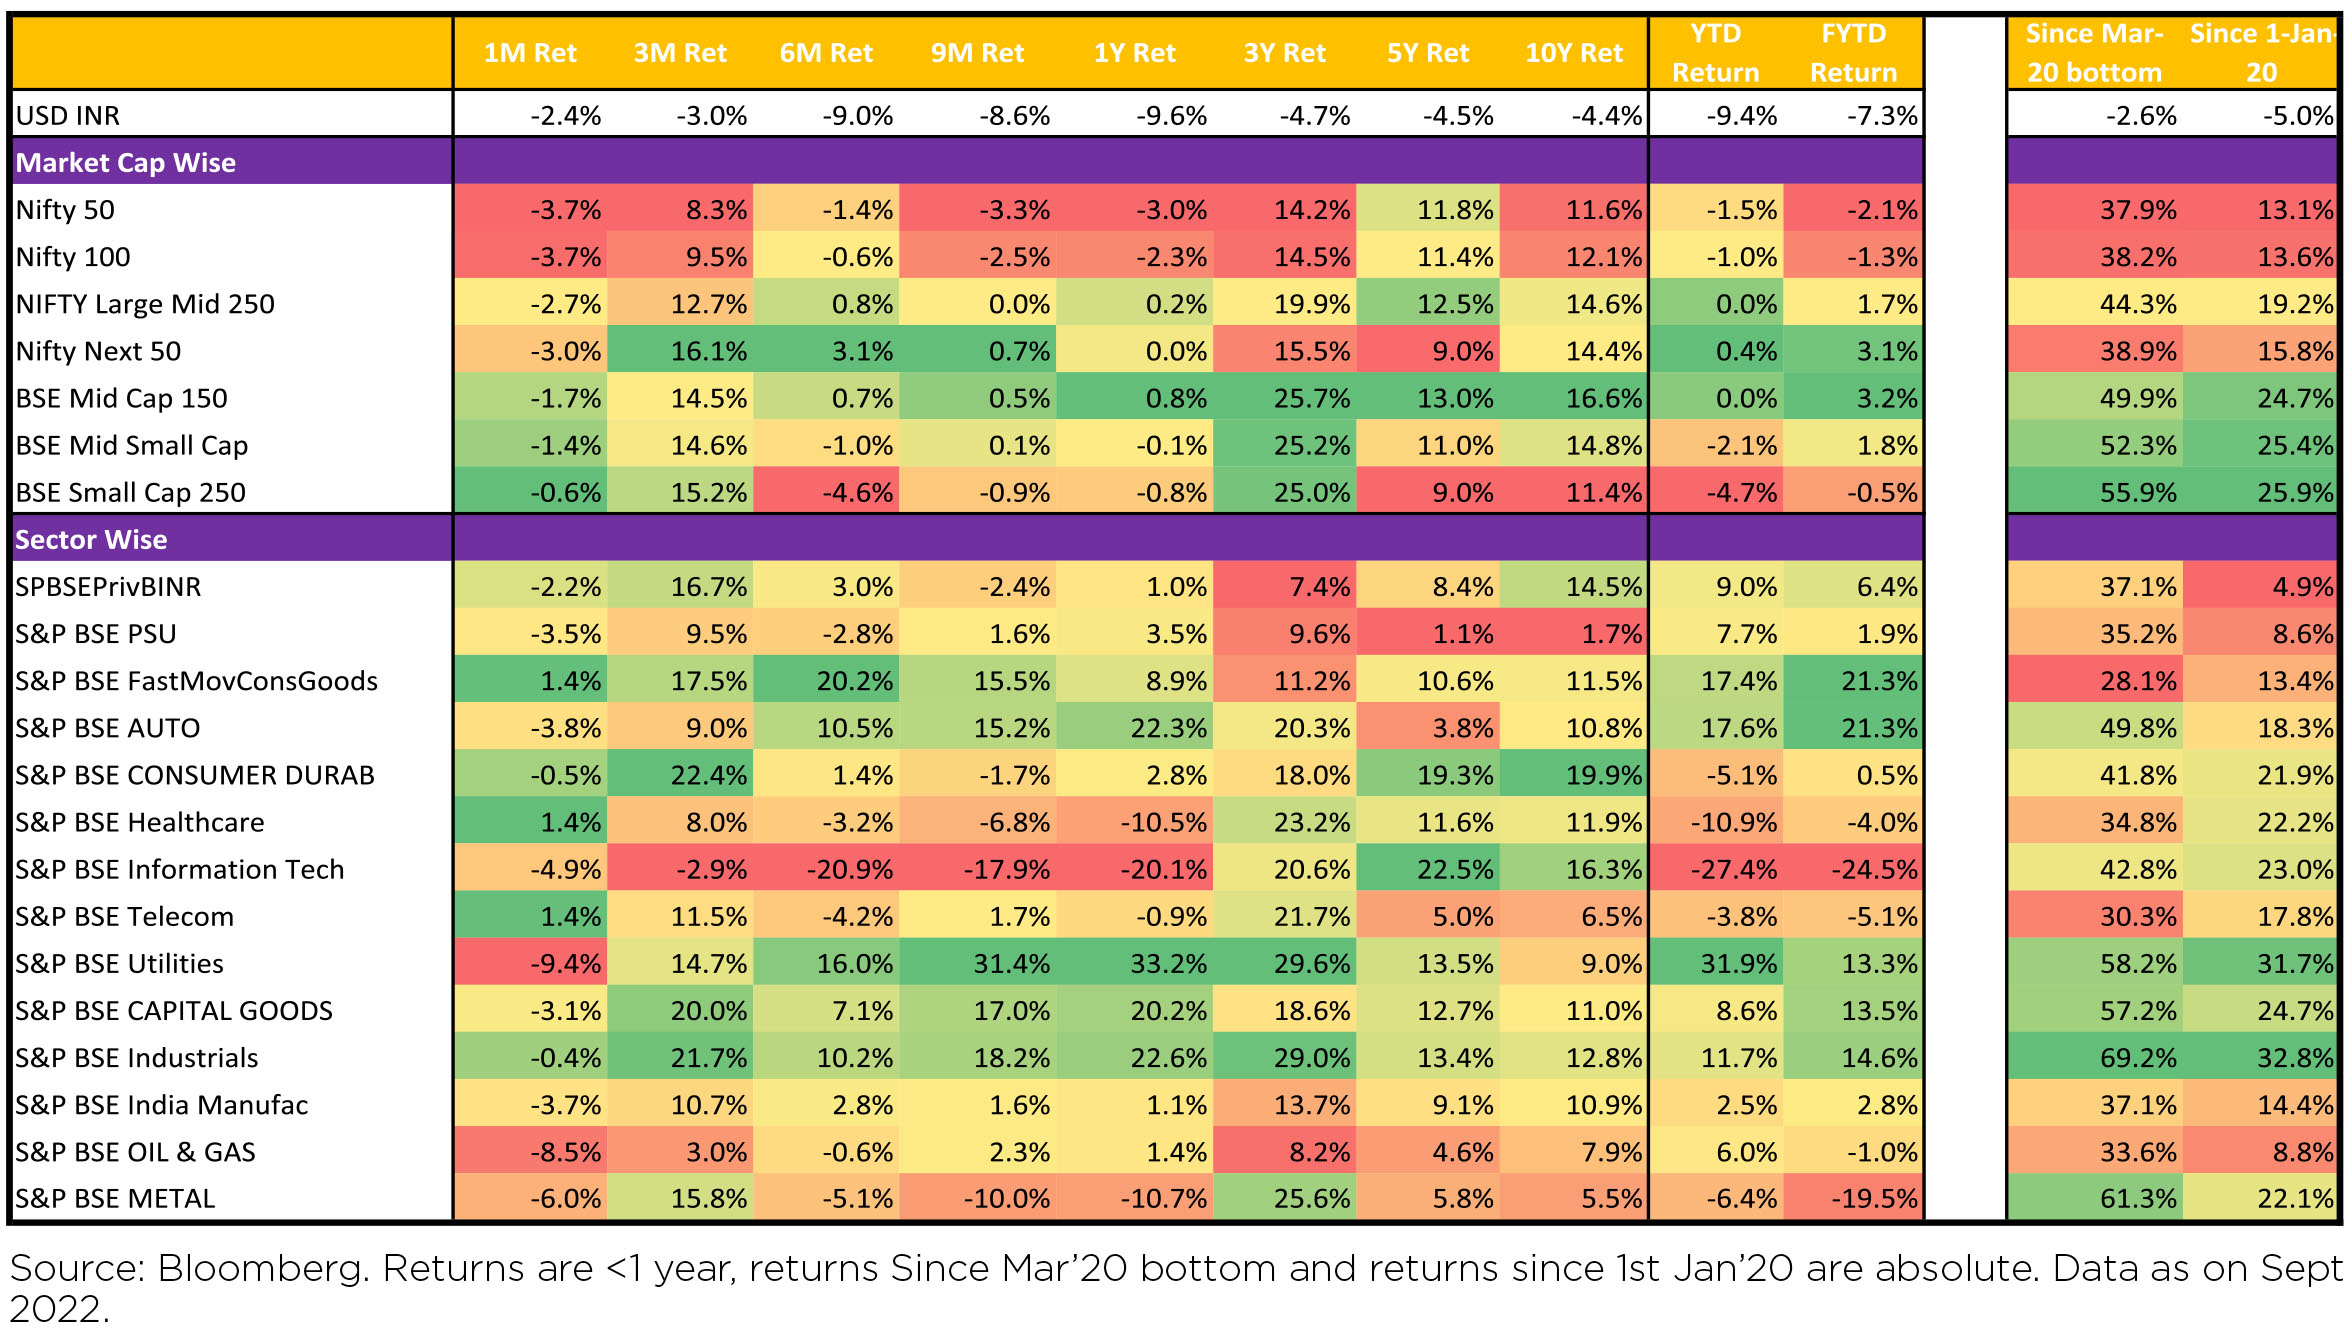
Indian equities (MSI India) declined by 6.2% MoM ($ terms) in September. However, it outperformed
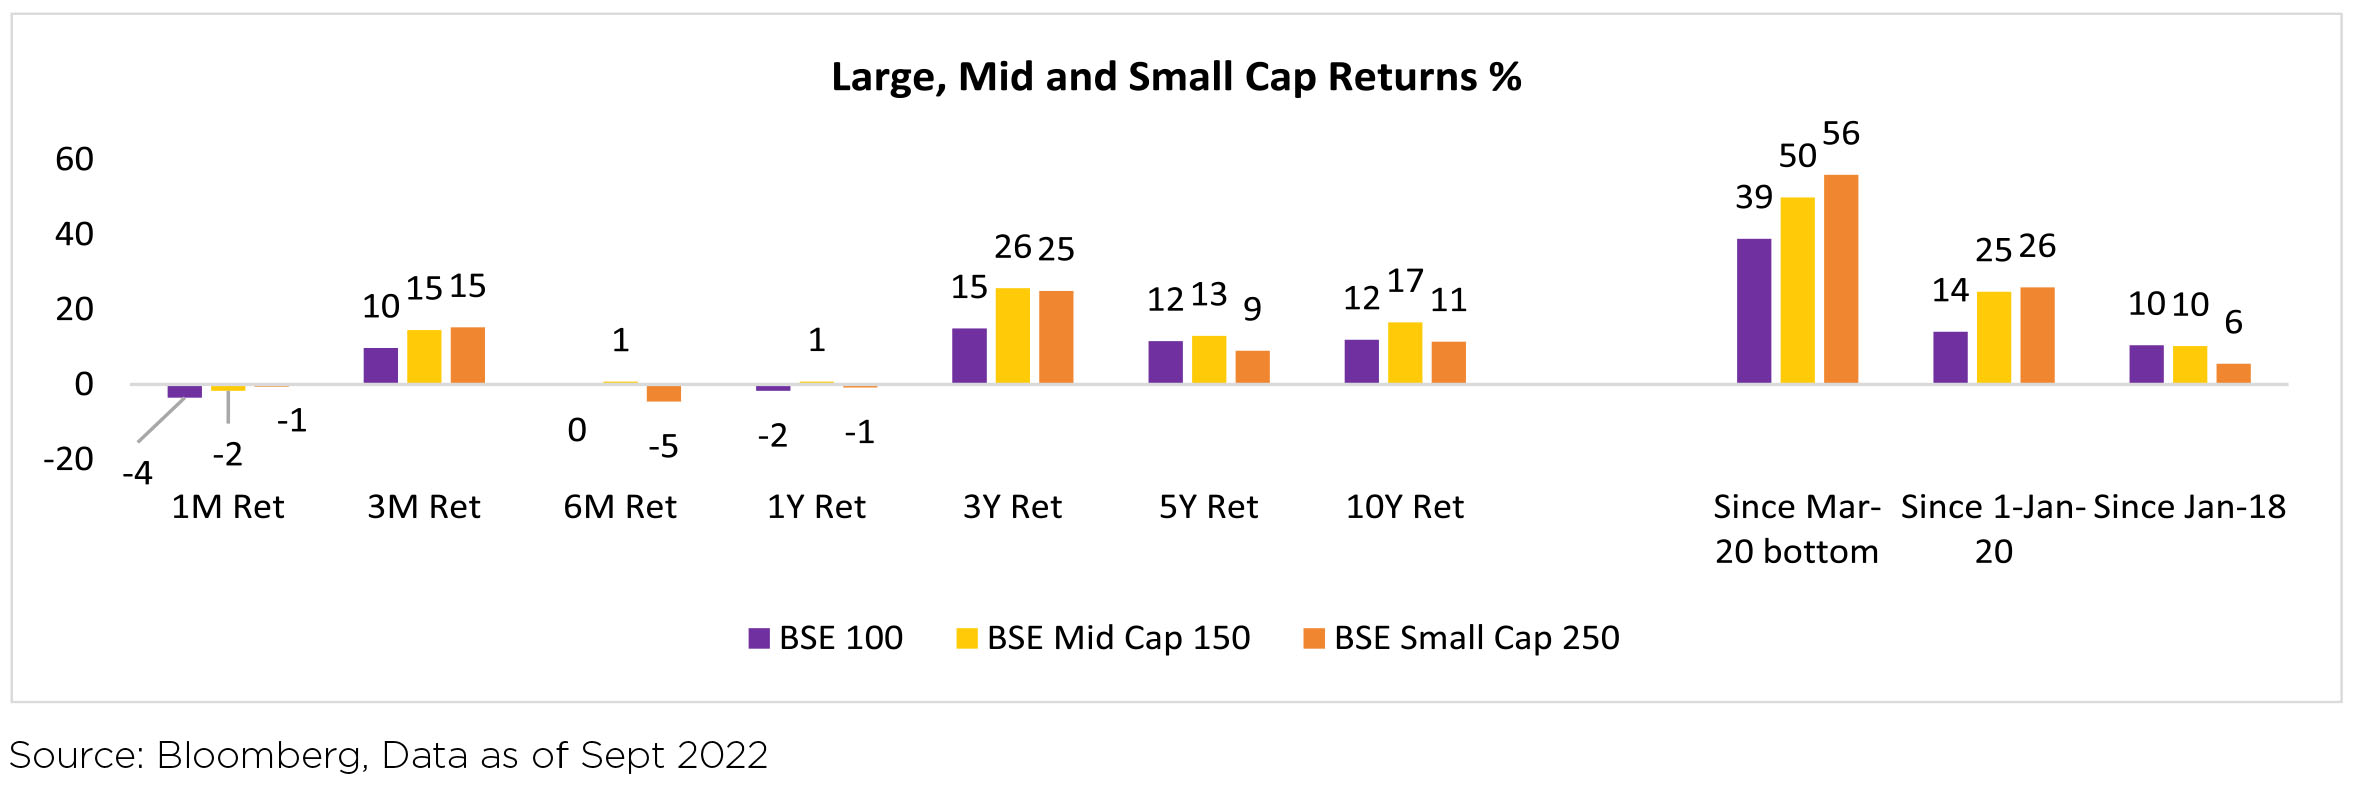
the broader markets (MSCI APxJ/EM: -12.9%/-11.9%). In INR terms, mid-caps (-1.7% MoM) and small caps
(-0.5% MoM) were surprisingly better as compared to large caps (-4.1% MoM).
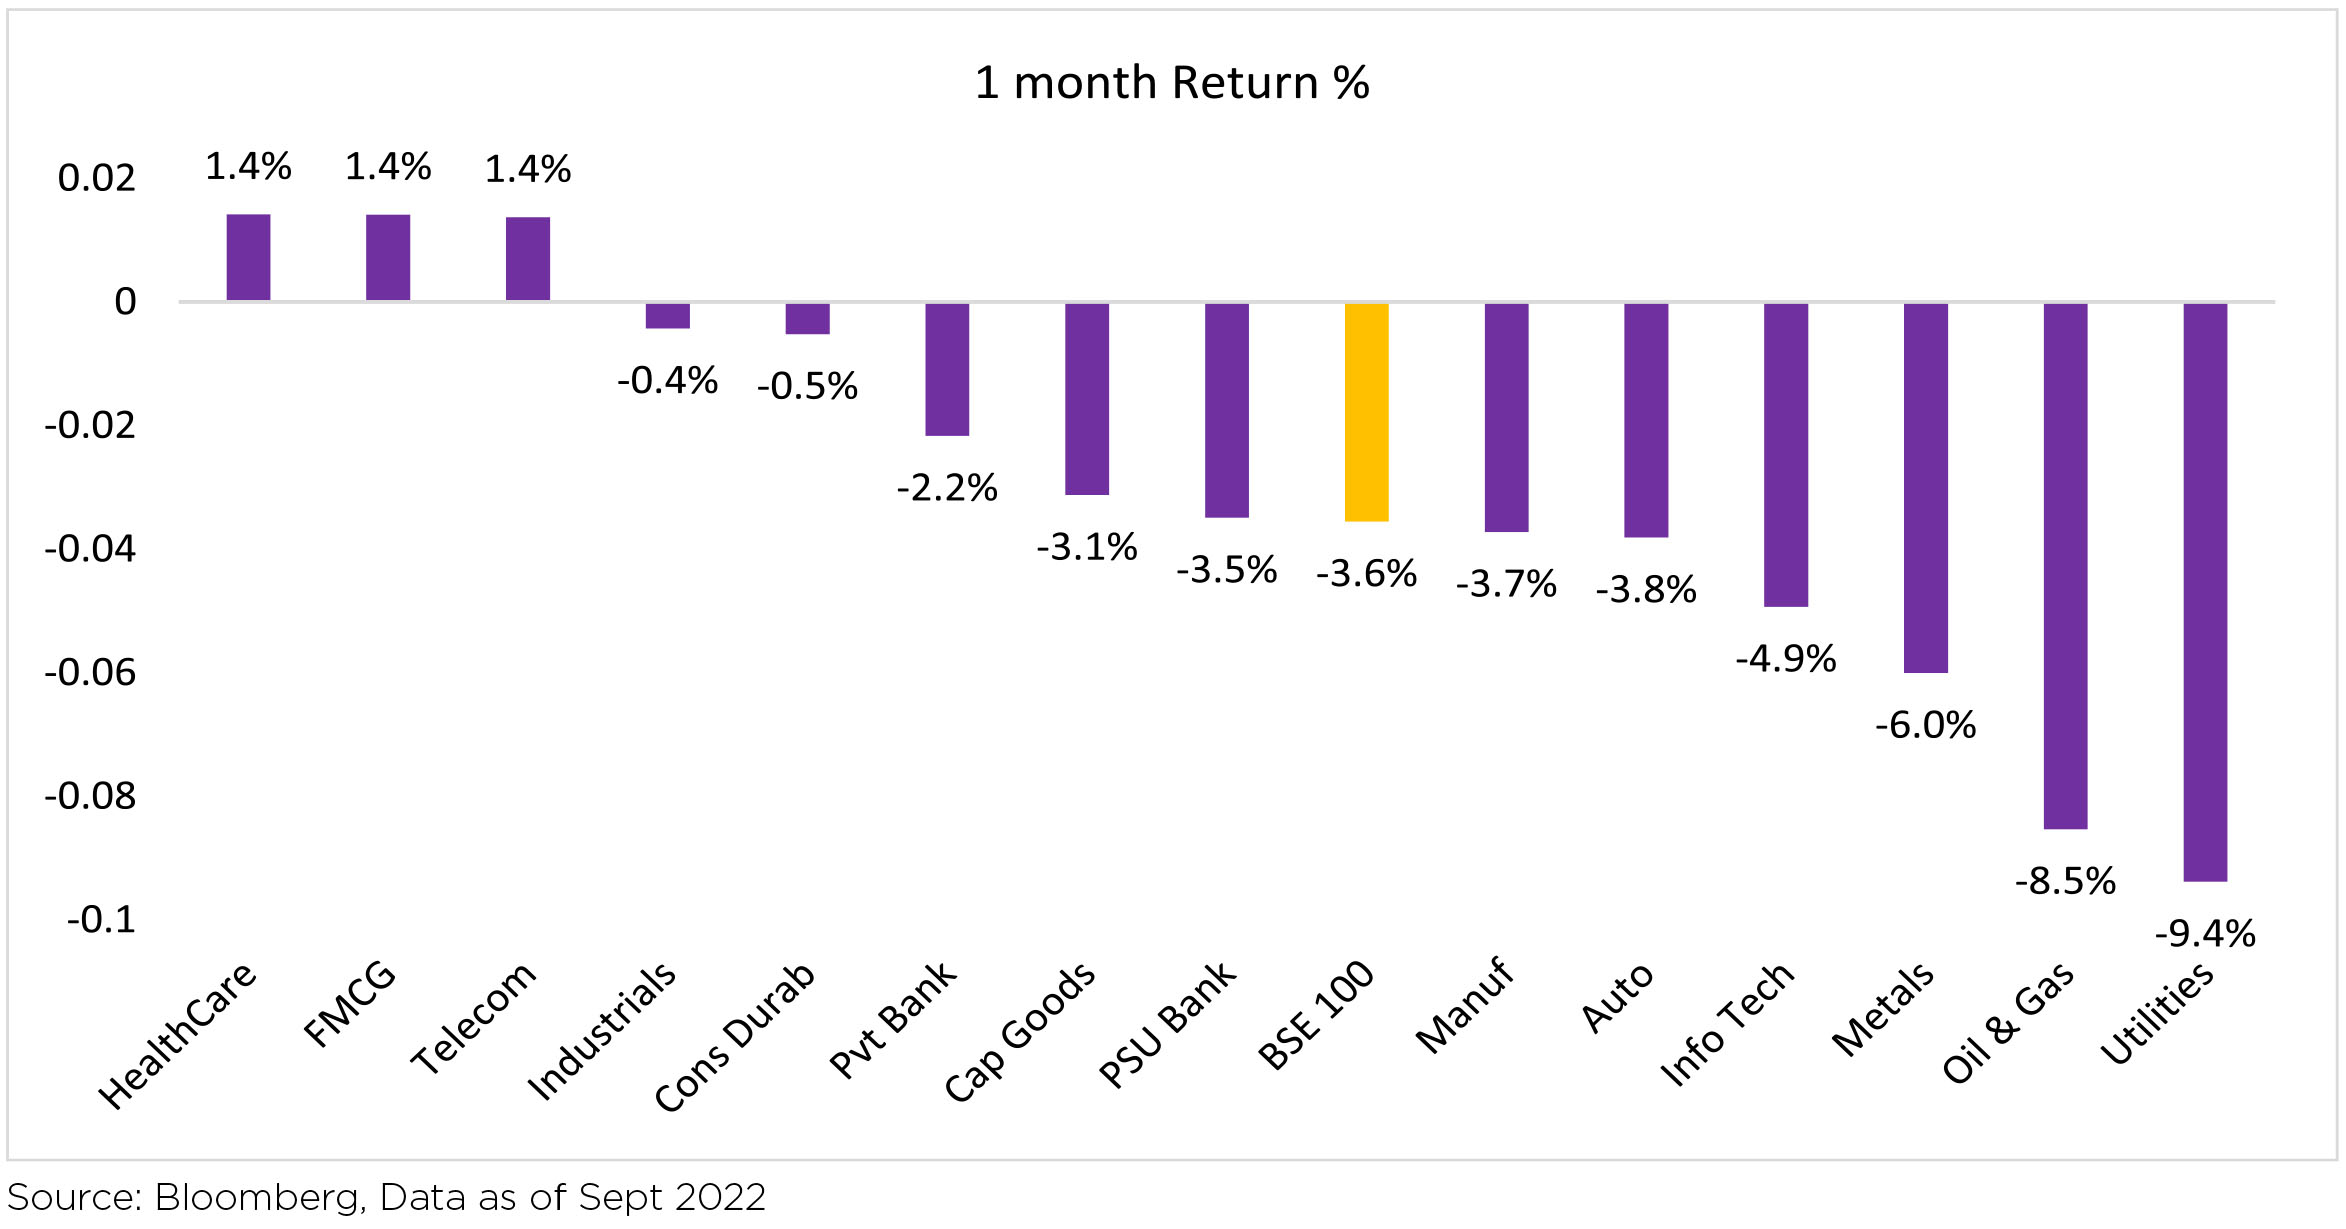
All sectors barring Healthcare, Communication Services and Consumer Staples ended the month in the red asBSE 100 declined (3.6% MoM). INR depreciated by 2.4% MoM, reaching ~81.35/USD in September. DXY (Dollar Index) strengthened +3.1% over the month.
Commodities, Interest rate and Inflation:
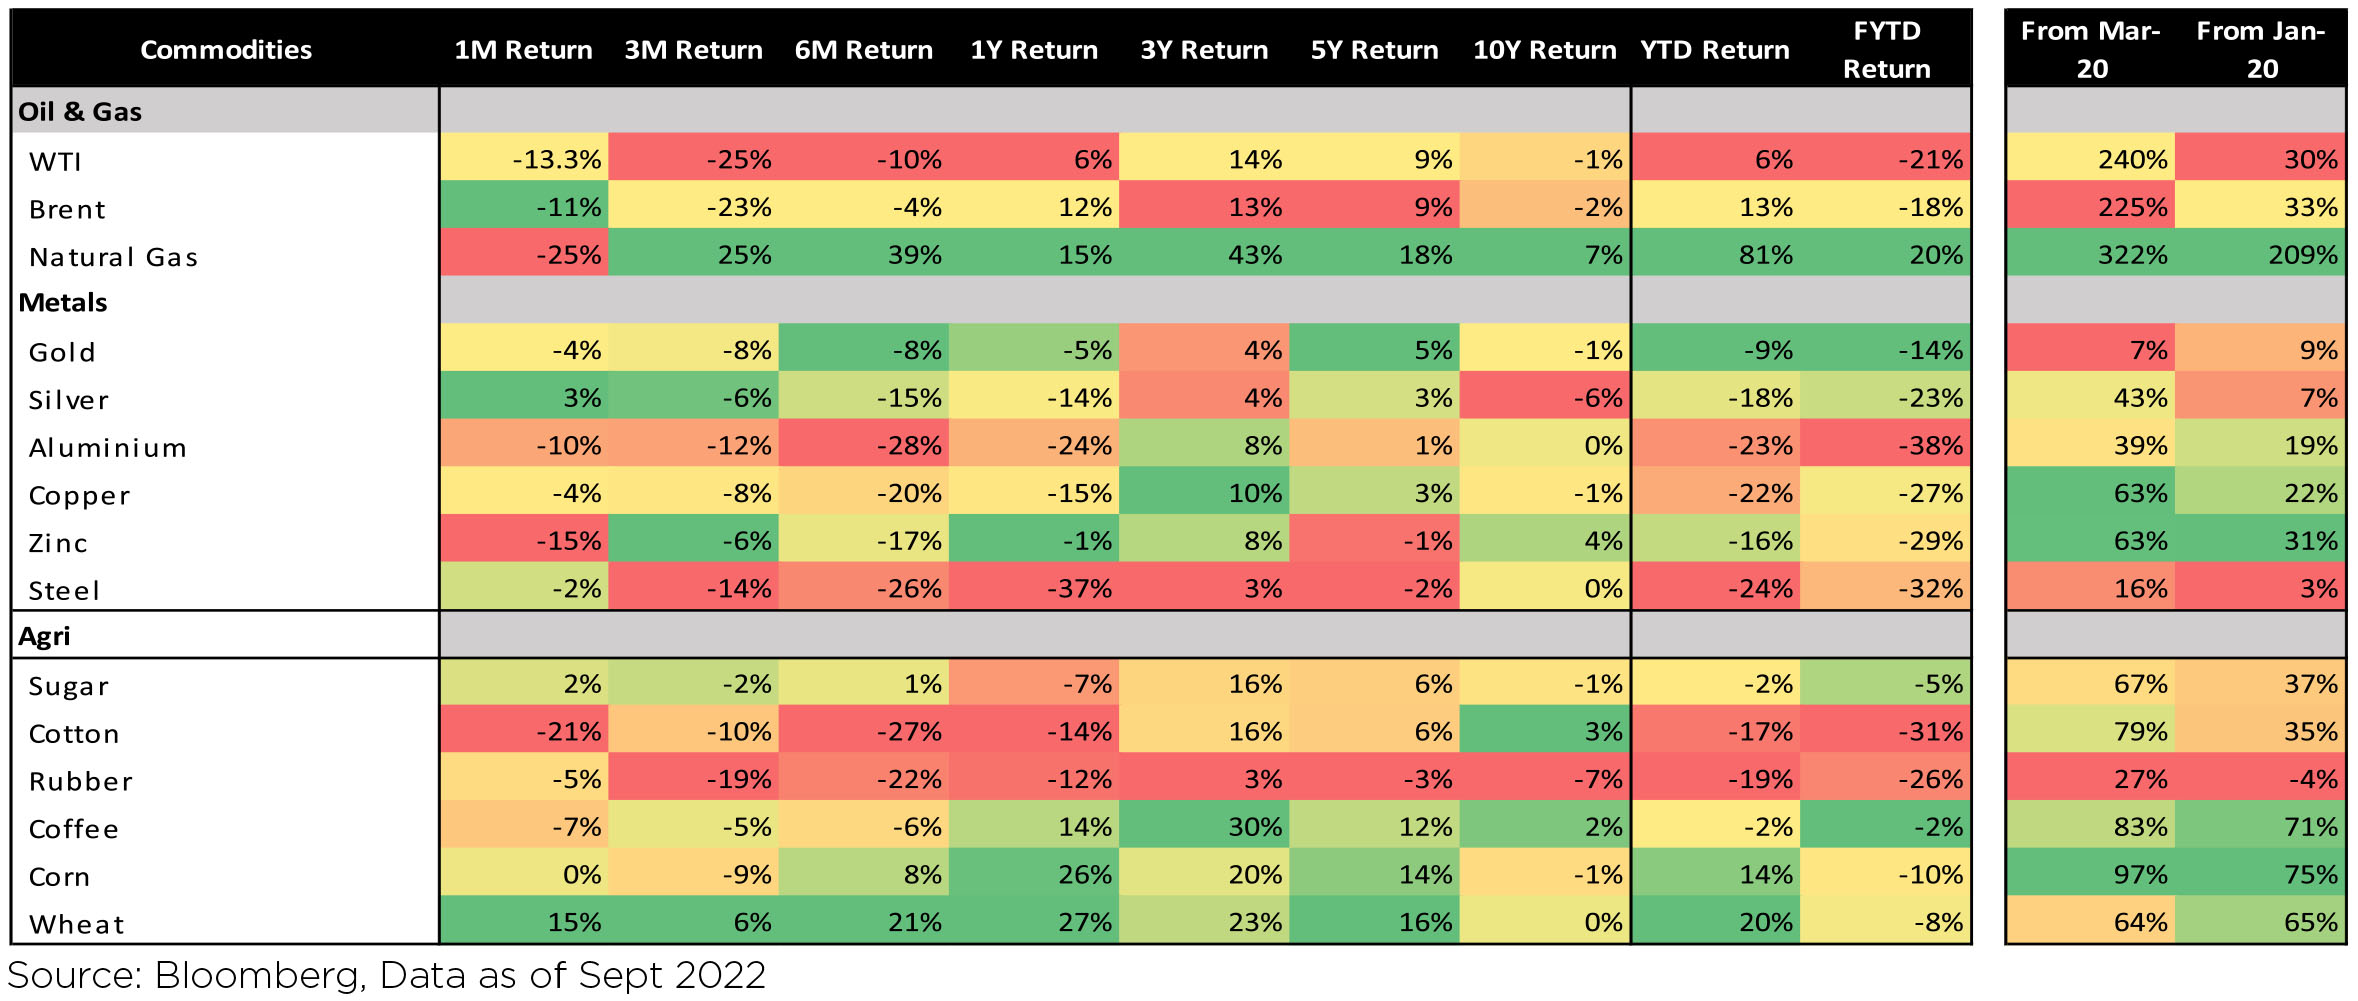
GoI Benchmark 10-year treasury yields averaged at 7.23% in September (2bps lower vs. August average). In the last 12 months, INR (-8.7%) though weaker, has performed better than the broader EM FX. Oil prices declined sharply by 10% MoM, following the decline of August.
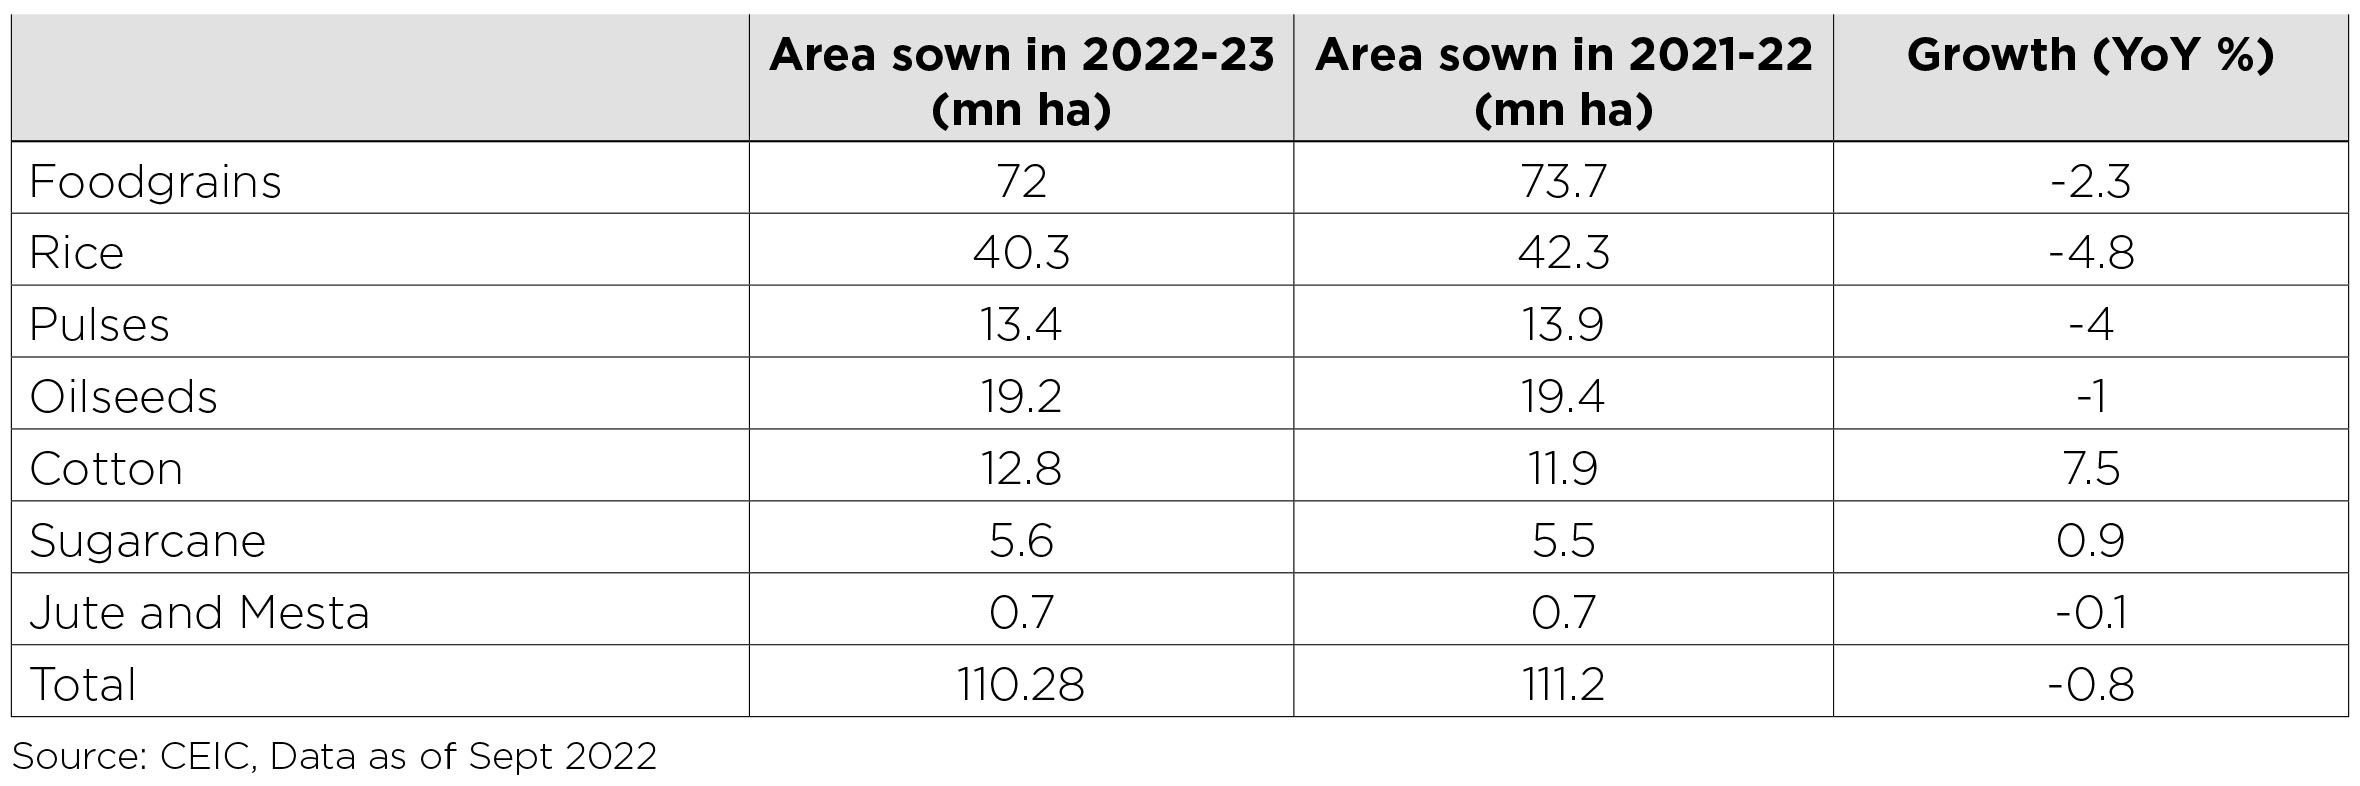
Cumulative rainfall till Sept was ~6% above long-term average. 6 out of 36 subdivisions are in the deficient zone, including regions like Gangetic West Bengal, Bihar, Jharkhand Uttar Pradesh and North East Region. Total Kharif sowing is tad lower from the last year levels. This is largely on account of deficient rainfall in the Eastern region, resulting in lower sowing for rice and pulses.
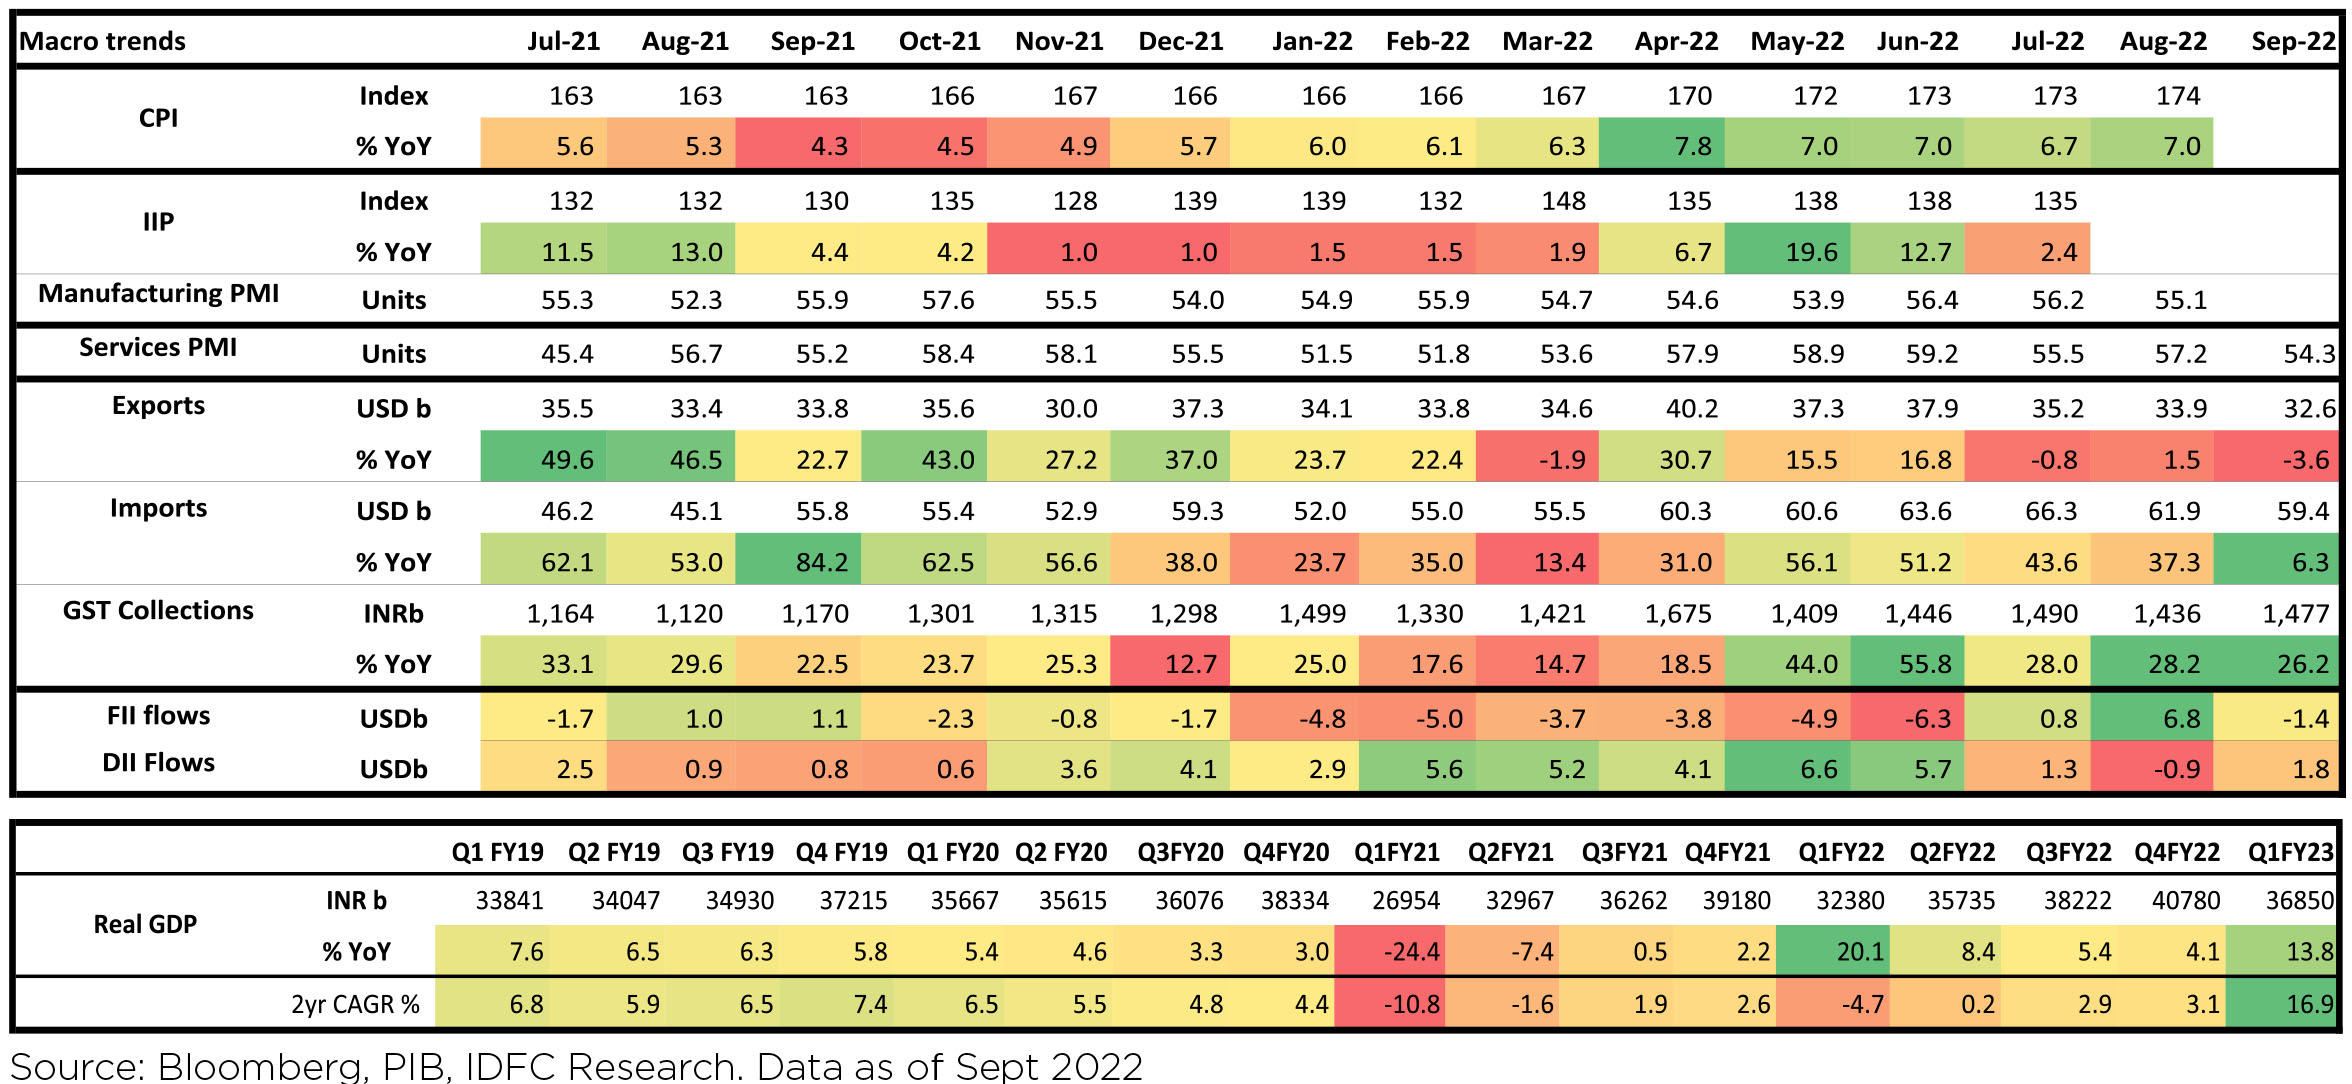
Macro prints improved: Domestic: GST, PMI data for September continues to remains strong
► August CPI maintained its flattish trend and came in at 7%, largely because food prices re-accelerated
► July's Industrial production growth fell sharply (+2.4% YoY). Manufacturing PMI remains stable indicating strong improvement in the health of the manufacturing sector.
► RBI hiked policy rates further by 50bps, with more normalization to come. The MPC has decided to remain focused on withdrawal of accommodation to ensure that inflation remains within the target going forward, while supporting growth
► CAD in 1QFY23 widened to US$23.9 bn (2.8% of GDP) (4QFY22: US$13.4 bn), mainly due to the widening of the trade deficit to US$68.6 bn (4QFY22: US$54.5 bn)
► PM Modi unveiled the National Logistics Policy (NLP) which aims at national level logistics planning, in-line with the Gatishakti announced in Oct'21. NLP targets dropping logistics costs to less than 10% of GDP from the current ~14-15%
FIIs again turned sellers of Indian equities in September (-$1.4bn, following +$6.8bn inflow in August). So far, India has seen YTD FII outflows of $22.4bn. DIIs saw buying of $1.8bn in September, with YTD inflows of $32.6bn. Mutual funds and Insurance funds were both net buyers in September with $0.8bn outflows and $0.9bn outflows respectively.
In the current episode of US Dollar strengthening, Emerging markets have remained largely unscathed, as compared to previous periods in 2008 & 2013. With US 2-year yields crossing 4%, the spreads between US 10-year and EM 10-year Bonds have remained stable. Thus, defying the "conventional" response of expanding spreads during phases of US$ strngthening. However, victory should not be declared in haste by the "decoupling" believers, as any slip up across Emerging Markets may still lead to creating ripples across "Lake Placid - EM currency & debt".
Domestic Markets
All sectors barring Healthcare, Communication Services and Consumer Staples ended the month in the red asBSE 100 declined (3.6% MoM). INR depreciated by 2.4% MoM, reaching ~81.35/USD in September. DXY (Dollar Index) strengthened +3.1% over the month.
Commodities, Interest rate and Inflation:
GoI Benchmark 10-year treasury yields averaged at 7.23% in September (2bps lower vs. August average). In the last 12 months, INR (-8.7%) though weaker, has performed better than the broader EM FX. Oil prices declined sharply by 10% MoM, following the decline of August.
Cumulative rainfall till Sept was ~6% above long-term average. 6 out of 36 subdivisions are in the deficient zone, including regions like Gangetic West Bengal, Bihar, Jharkhand Uttar Pradesh and North East Region. Total Kharif sowing is tad lower from the last year levels. This is largely on account of deficient rainfall in the Eastern region, resulting in lower sowing for rice and pulses.
Macro prints improved: Domestic: GST, PMI data for September continues to remains strong
► August CPI maintained its flattish trend and came in at 7%, largely because food prices re-accelerated
► July's Industrial production growth fell sharply (+2.4% YoY). Manufacturing PMI remains stable indicating strong improvement in the health of the manufacturing sector.
► RBI hiked policy rates further by 50bps, with more normalization to come. The MPC has decided to remain focused on withdrawal of accommodation to ensure that inflation remains within the target going forward, while supporting growth
► CAD in 1QFY23 widened to US$23.9 bn (2.8% of GDP) (4QFY22: US$13.4 bn), mainly due to the widening of the trade deficit to US$68.6 bn (4QFY22: US$54.5 bn)
► PM Modi unveiled the National Logistics Policy (NLP) which aims at national level logistics planning, in-line with the Gatishakti announced in Oct'21. NLP targets dropping logistics costs to less than 10% of GDP from the current ~14-15%
FIIs again turned sellers of Indian equities in September (-$1.4bn, following +$6.8bn inflow in August). So far, India has seen YTD FII outflows of $22.4bn. DIIs saw buying of $1.8bn in September, with YTD inflows of $32.6bn. Mutual funds and Insurance funds were both net buyers in September with $0.8bn outflows and $0.9bn outflows respectively.
Market Performance
Outlook
Emerging market indices continue to be "plagued" by the underperformance of China, the largest weight within MSCI EM Index (31.4%). Chinese markets for the month registered a decline of 14.3% as against EM declining by 11.8%. A country's outperformance is driven by a combination of superior earnings trajectory combined with mutiples re-rating. Viewed from the prism of valuations, Indian equities are trading at a record premium to MSCI EM valuations. On the earnings front, estimates have been downgraded since Jan'22, with Nifty 50 estimated to deliver growth of 13.8% for Cy 22 (as per FTSE) while CY23 esimated growth is more impressive at 18.1%. Not the highest within Asia but clearly superior to China (FTSE estimates of 4.5% growth for CY22 and 17.1% for CY23). While FIIs have been sellers over the last 12 months (though July & August saw positive inflows), the impressive earnings forecast and the increasing weight of India within MSCI EM Index (2nd highest country allocation), will keep them interested in India going ahead as well.
Globally markets are bracing for downward earnings revision post the September quarter results, as economic growth estimates have been slashed and US$ is at a multi year high - impacting international revenues and profitability of global majors like Apple, Microsoft, Google/Alphabet, Amazon etc. European earnings will be mostly impacted by the high energy costs, given the stratospheric prices levels touched for natural gas. As such, companies have been forced to curtail production, and demand too has become softer. This is putting pressure on markets in US & Europe. In India, September quarter earnings are expected to be weak. However, there is a strong anticipation of earnings revisions to be largely upwards, driven by the softening of commodity prices and the INR depreciation. In this context, corporate earnings cycle of US/ Europe & India appear to be on a divergent path - at least as per analysts forecasts. Will earnings forecast for H2 neutralise the softer H1 FY23 earnings? A key question, which may impact the market sentiment and trend in the coming quarter. We will wait and watch closely.
Wishing all our readers a Prosperous, Healthy and Joyful Diwali and festival season!!!
Note: The above graph is for representation purposes only and should not be used for the development or implementation of an investment strategy. Past performance may or may not be sustained in the future.
What Went By
Consumer Price Index (CPI) inflation in India was 7% y/y in August, up from 6.7% in July, as sequential momentum
in food inflation picked back up. Core inflation (CPI excluding food and beverages, fuel and light) was at 5.8%
in July and August after averaging 6% in FY22. Real time prices of edible oils have eased but that of cereals
and pulses have moved up although the pace of increase has moderated of late. Among vegetables, price of
tomatoes have picked up strongly again after the fall in July and August.
During April-August of FY23, central government net tax revenue growth was 8.6% y/y while total expenditure grew 8.9%. Fiscal deficit so far is thus 32.6% of FY23 budget estimate vs. 29.4% this time last year. Small savings inflow during April-August 2022 was almost same as that during the same period of last year but needs to be ~Rs. 55,000cr higher during the remaining fiscal year (vs. last year). GST collection continued to remain robust at Rs. 1.48 lakh crore and 26% y/y during September.
Industrial production (IP) growth was 2.4% y/y in July after 12.7% in June, the latter also driven by base effect. On a seasonally adjusted month-on-month basis, it was -4.6% in July after +1.1% in June. Output momentum turned weaker across all categories of consumer, primary, capital, intermediate, infrastructure and construction goods in July. Infrastructure Industries output (40% weight in IP) was up 1.6% m/m seasonally adjusted in August, after being negative for three months, driven by improvement in output of electricity, coal and crude oil.
Bank credit outstanding as on 09th September was up 16.2% y/y and has averaged 13% since April 2022 (up from 8% during January-March), likely also due to higher inflation and thus higher demand for working capital. Bank deposit growth was at 9.5%. Credit flow till date during the financial year has been positive and higher in FY22, vs. FY20 and FY21, while deposit flow has been lower. During FY22, overall bank credit flow so far has been the highest for personal loans and lowest for industries.
Merchandise trade deficit moderated mildly to USD 28bn in August and USD 26.7bn in September after picking up to USD 30bn in July. In September, non-oil exports continued to sequentially moderate for the third month but oil imports continued to fall (likely also price effect) and non-oil-non-gold imports moderated a bit further. Trade deficit has averaged USD 22.4bn since September 2021 vs. USD 10.8bn during April-August 2021. During the same periods, non-oil-non-gold imports picked up to an average of USD 38.5bn vs. USD 29.3bn.
Among higher-frequency variables, number of motor vehicles registered has moderated from May while energy consumption level has eased and is now close to previous year level. Monthly number of GST e-way bills generated continues to remain strong and picked up to 7.8cr in August from an average of 7.4cr in the June quarter.
US headline CPI eased to 8.3% y/y in August from 8.5% in July, with the sequential momentum being mild and driven by a drop in energy price. However, Core CPI was higher at 6.3% in August after 5.9% in July. Housing rent momentum picked further up and stayed high. US non-farm payroll addition in August (315,000 persons) was below that in July (526,000 persons) but was still above expectation. Unemployment rate inched up from 3.5% in July to 3.7% in August and sequential growth in average hourly earnings was lower. More recently, non-farm job openings as per the Job Openings and Labor Turnover Survey (JOLTS) fell sequentially by 1.1mn, the biggest drop since April 2020 and this was quite broad based across sectors. The FOMC (Federal Open Market Committee) raised the target range for the federal funds rate, by 75 bps for the third time and a total of 300bps so far in 2022, to the 3.00-3.25% range. The Summary of Economic Projections released increased the median federal funds rate projection to 4.4% for 2022 (from 3.4% in June) and to 4.6% for 2023 (from 3.8% in June). The Fed Governor, in his interaction after the FOMC meeting, continued to stress that restoring price stability will likely involve maintaining restrictive policy for some time, that historical record warns strongly against premature loosening of policy, that reducing inflation will involve a sustained period of below-trend growth and there will very likely be some softening of the labour market.
The European Central Bank's Governing Council, in its monetary policy decision on 08 September, raised all the three key interest rates by 75bps after 50bps in July. It said it is still so far away from the rate that will help return inflation to 2% and thus it will take further hikes in the next several (2 to 4) meetings of a magnitude and at a pace that will be determined meeting by meeting. It forecasts Euro Area inflation at 8.1% y/y in 2022, 5.5% in 2023 and 2.3% in 2024. Although its baseline GDP forecast is +0.9% for 2023, the downside scenario (which includes a total shutdown of all Russian gas supply and no other alternative sources of supply including that of LNG) projects a recession in 2023 (GDP forecast of -0.9%).
China has been facing several domestic economic issues since 2021 - a property sector meltdown which started with the payment default by a major property developer, power crunch due to coal shortage last year, multiple and extensive lockdowns as part of its Zero Covid Strategy and the more recent power rationing as a severe drought impacted hydropower generation. Policy response to the issues so far has been measured, including cuts to Required Reserve Ratio & Loan Prime Rate, additional quota for policy banks (to channeltargeted loans) & local government special bonds, and a focus on the time-tested mode of infrastructure investment.
Earlier this month, it also announced an easing of the lower bound of mortgage rate for first time home buyers, tax rebates and rate cuts to Housing Provident Fund to further support home purchases.
Outlook
The 30th September'22 RBI policy was along expected lines in terms of action with the MPC delivering a 50 bps hike, taking the repo rate to 5.90%. Within the MPC itself there is one argument on appropriate stance linked to the level of repo rate achieved and another around absorption of liquidity. The clarification from the Governor in some sense combined the two. When the stance of monetary policy was moved from neutral to accommodative in June 2019 the repo rate was at 5.75%; lower than what it is today. However, inflation was sub 4% on near projections and liquidity was mildly deficit. Today, near projections on inflation are still around 6% and liquidity (when adjusted for very high government balances part of which will be spent going ahead) is still in surplus. Hence both on 'real' policy rate in the near term as well as on current liquidity situation monetary policy is deemed to be more accommodative today. This definition, alongside a refusal to get drawn into a debate on terminal policy rates, keeps monetary policy flexibility alive in the face of a very hostile global situation.
We expect the repo rate to peak at 6.15 - 6.25% in this cycle with the final hike likely in the upcoming December policy. This is higher than our earlier expectation of 6% and reflects changes to DM rate forecasts by a very sharp extent lately, something that we weren't expecting earlier (https://idfcmf.com/article/9551). This still means that we don't have to follow the US Fed lockstep, even as some upward adjustment is prudent given the latest aggressive changes in Fed (and other DM central banks') terminal pricing lately.
The anchor to our view has been that India's total fiscal and monetary accommodation over the past 2 years has been very much more modest than many other economies. Not just that, monetary normalisation has been relatively quick and proactive here as well. While central bank's balance sheet reductions are still at a nascent stage in DMs, RBI's balance sheet is already lower by approximately 9% over the past 11 months.
The recent domestic growth acceleration has to be looked at in context: As of FY 22, we had barely crossed pre-pandemic levels on real GDP, which itself was the culmination of some years of slowdown. Also, while the concurrent resilience in domestic economic indicators is a source of great comfort, the global slowdown will take its toll via the export channel.
Assuming a normal monsoon, a progressive normalisation of supply chains, and no further exogenous or policy shocks, structural model estimates indicate that inflation will average 5.2%. If this holds true going forward in the general thinking of MPC as well, then a 6.25% terminal would yield a 100 bps real positive policy rate on a forward looking basis. Given the context on growth as described above, this should be more than enough from a macro stability and formation of inflation expectations standpoint.
The argument around hiking to 'maintain' interest rate differentials vis-à-vis say the Fed has to be tread upon carefully. The Fed, and for that matter some other DM central banks, are hiking because they have a run away inflation problem locally. This in turn is owing to an irresponsibly large stimulus post the pandemic in these economies that caused severe local imbalances. While RBI has to guard against the volatility that DM action is now bringing, managing these spill-overs can manifest as somewhat tighter policy locally than otherwise would have been the case.
Our current account deficit (CAD) is an issue, but it is on account of two factors: One, the commodity shock emanating from the Russia-Ukraine conflict was in effect a forced exporting of savings for a commodity importing nation such as India. However, this shock is unwinding in a host of commodities and this should have a salutary effect on our CAD with a lag. Two, for a variety of reasons India's near growth trajectory has become somewhat de-synchronised with many other nations of the world (we are accelerating while many others are deaccelerating). This is also causing additional pressures on CAD. Thus some amount of patience on CAD is probably logical especially given the correction in commodities. If temporary measures are required eventually on currency they should rather be administrative given this context.
The bond curve has flattened aggressively. We think this is excessive, and makes the relative value in 3 - 5 years maturity government bonds all the more appealing. With a terminal overnight rate of around 6.25%, there is more than adequate cushion on 3 - 5 year rates and we expect the same to start to get factored into the shape of the curve as market's peak rate expectations begin stabilising again over the next few months. Also very importantly, the government borrowing calendar for second half of the financial year is quite light on supply in the 5 year segment when compared with longer duration. Finally, gross supply of state development loans (SDLs) will likely pick up meaningfully in H2 vs H1. This will alleviate some of the 'scarcity' in duration supply that has been plaguing longer term investors like PFs and insurers, and thereby help steepen the curve somewhat as we go ahead. Thus both reflecting the shape of the curve as well as our view on terminal policy rate, we continue to find the most value in 3 - 5 year government bonds. That said, shorter end rates have also repriced significantly thereby making money market products relatively well placed provided the investment horizon here is kept somewhat longer than earlier accounting for the larger volatility generally in markets in the current state of the world.
