Commentary

Commentary
|
|
|
|
|

|


Global Markets
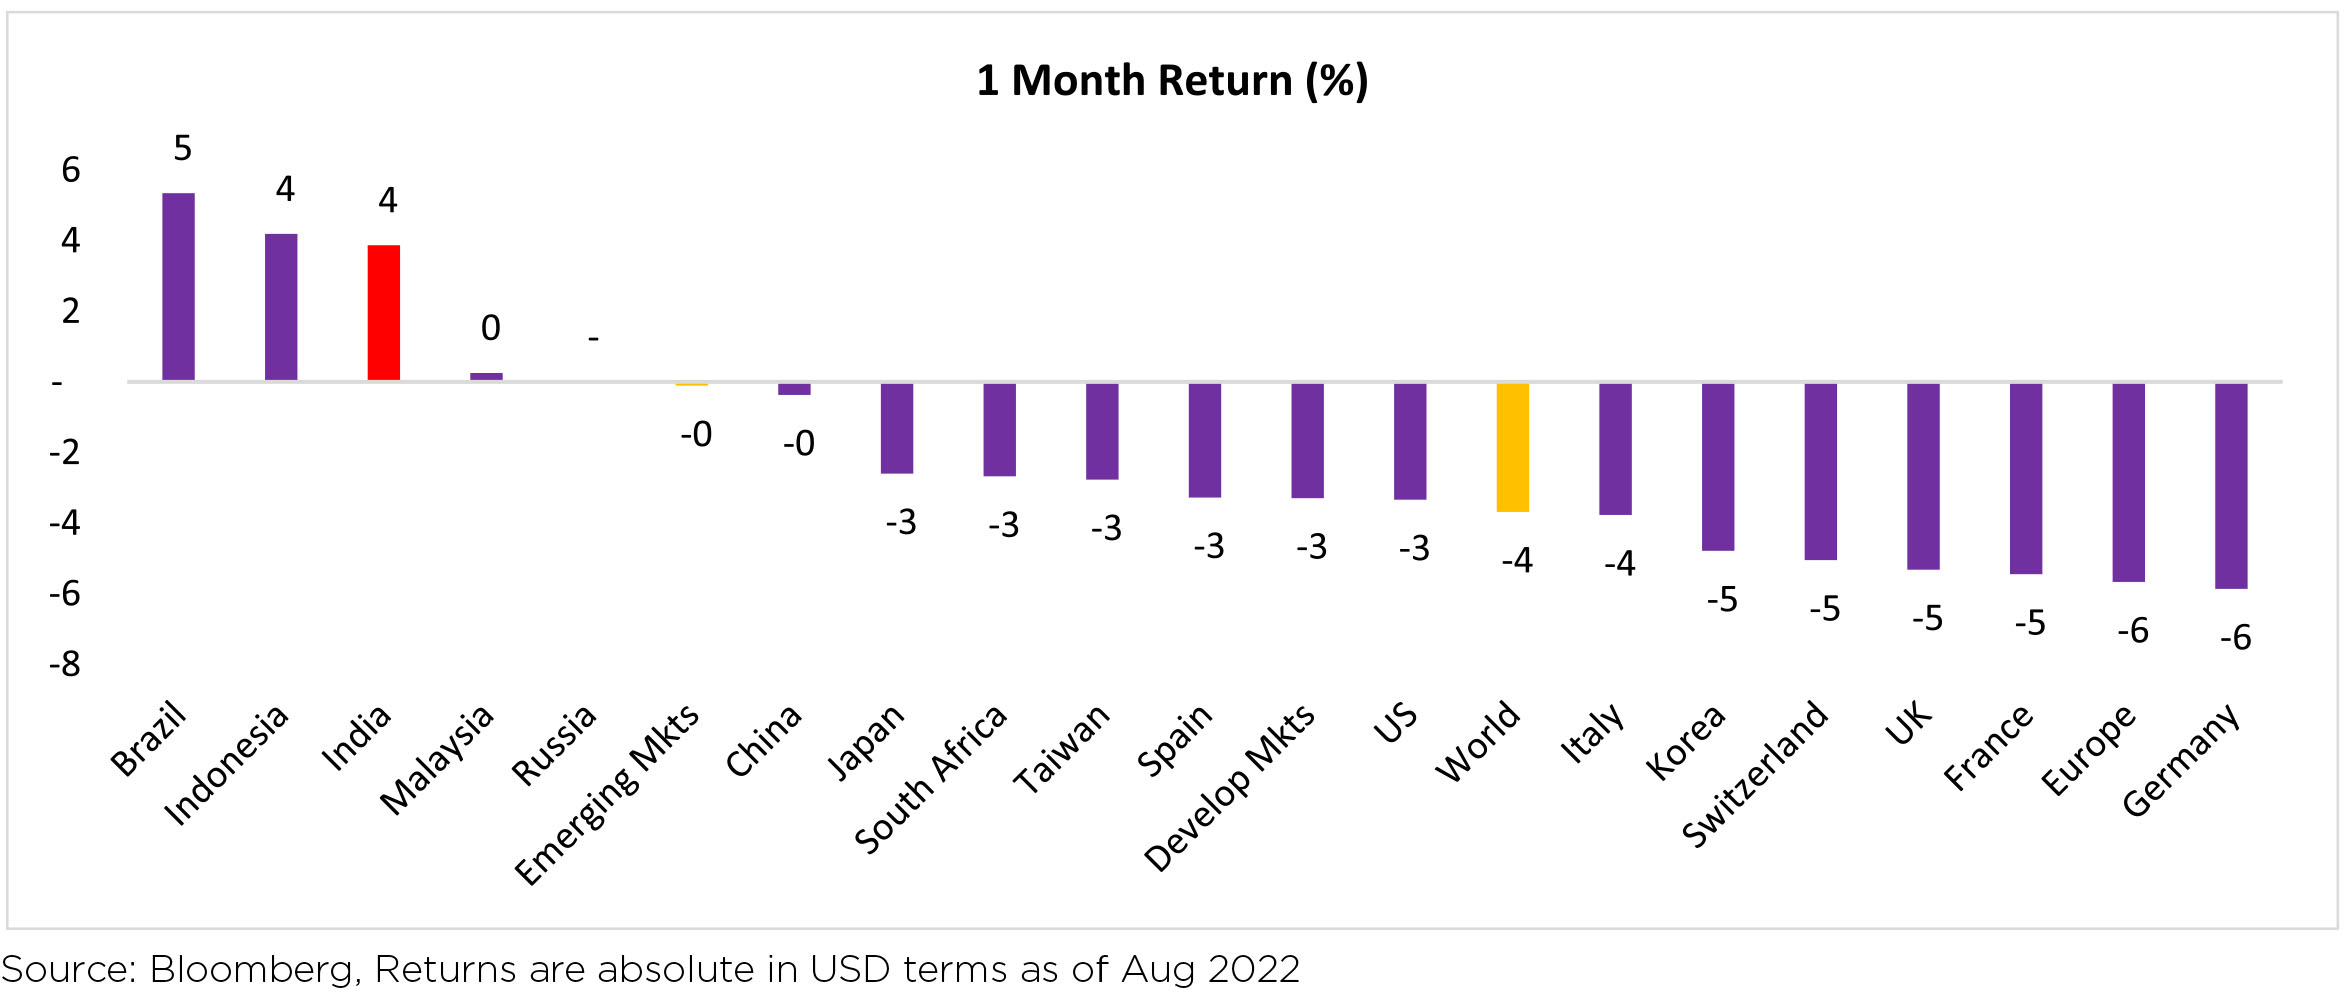
Global equities weakened across regions (-4% MoM/ -18.1% YTD). India, Brazil and China were outliers
while all other regions declined (US -3.3%/Euro area -5.7%). S&P 500 declined -4.2% MoM after the strong
rally in the first half of August.
The moderation in global oil and agricultural commodity prices has become a near-term disinflationary tailwind. There has also been a moderation in core goods price gains. The economic growth- central bank policy focus is likely to improve through 2H.
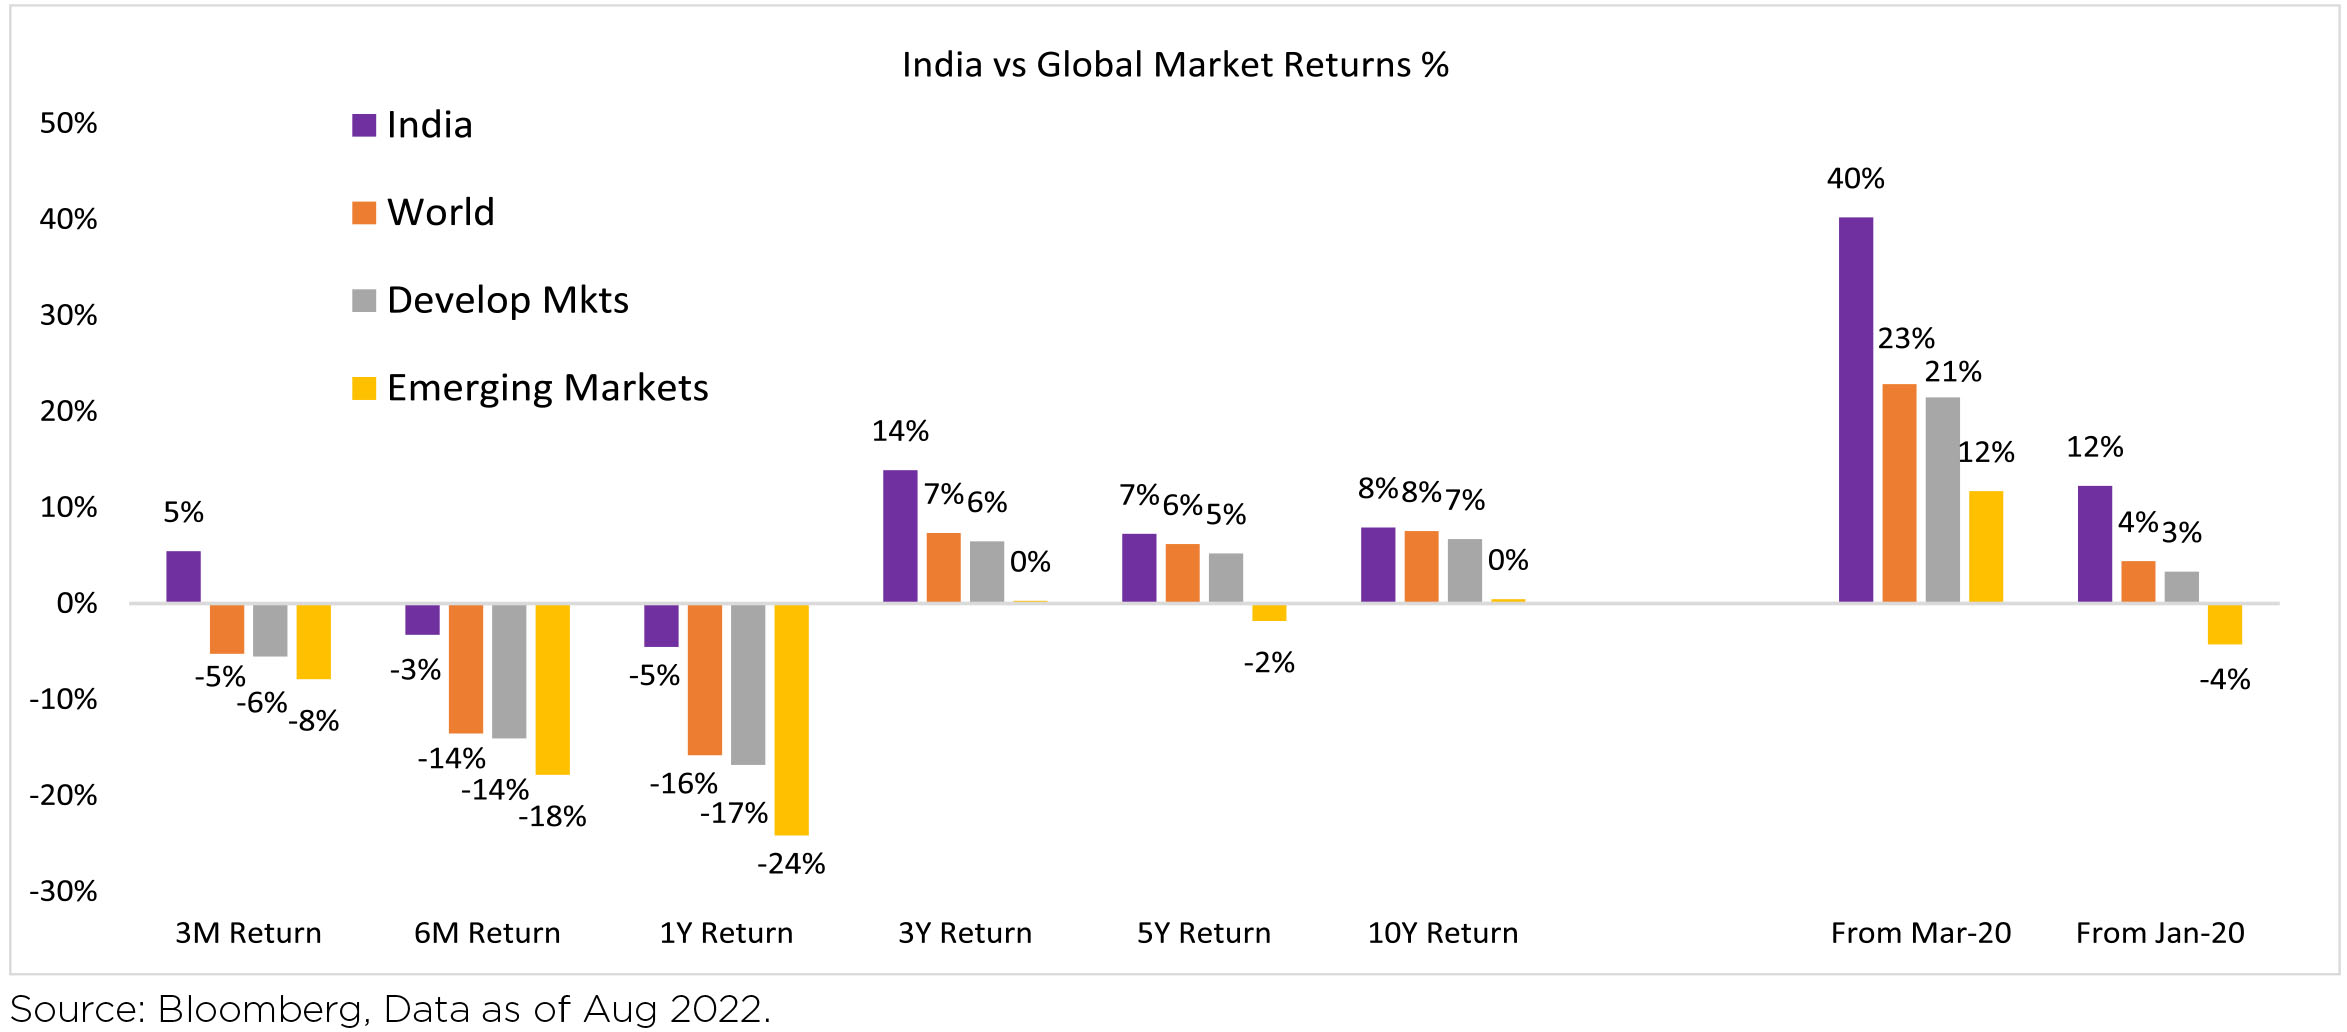
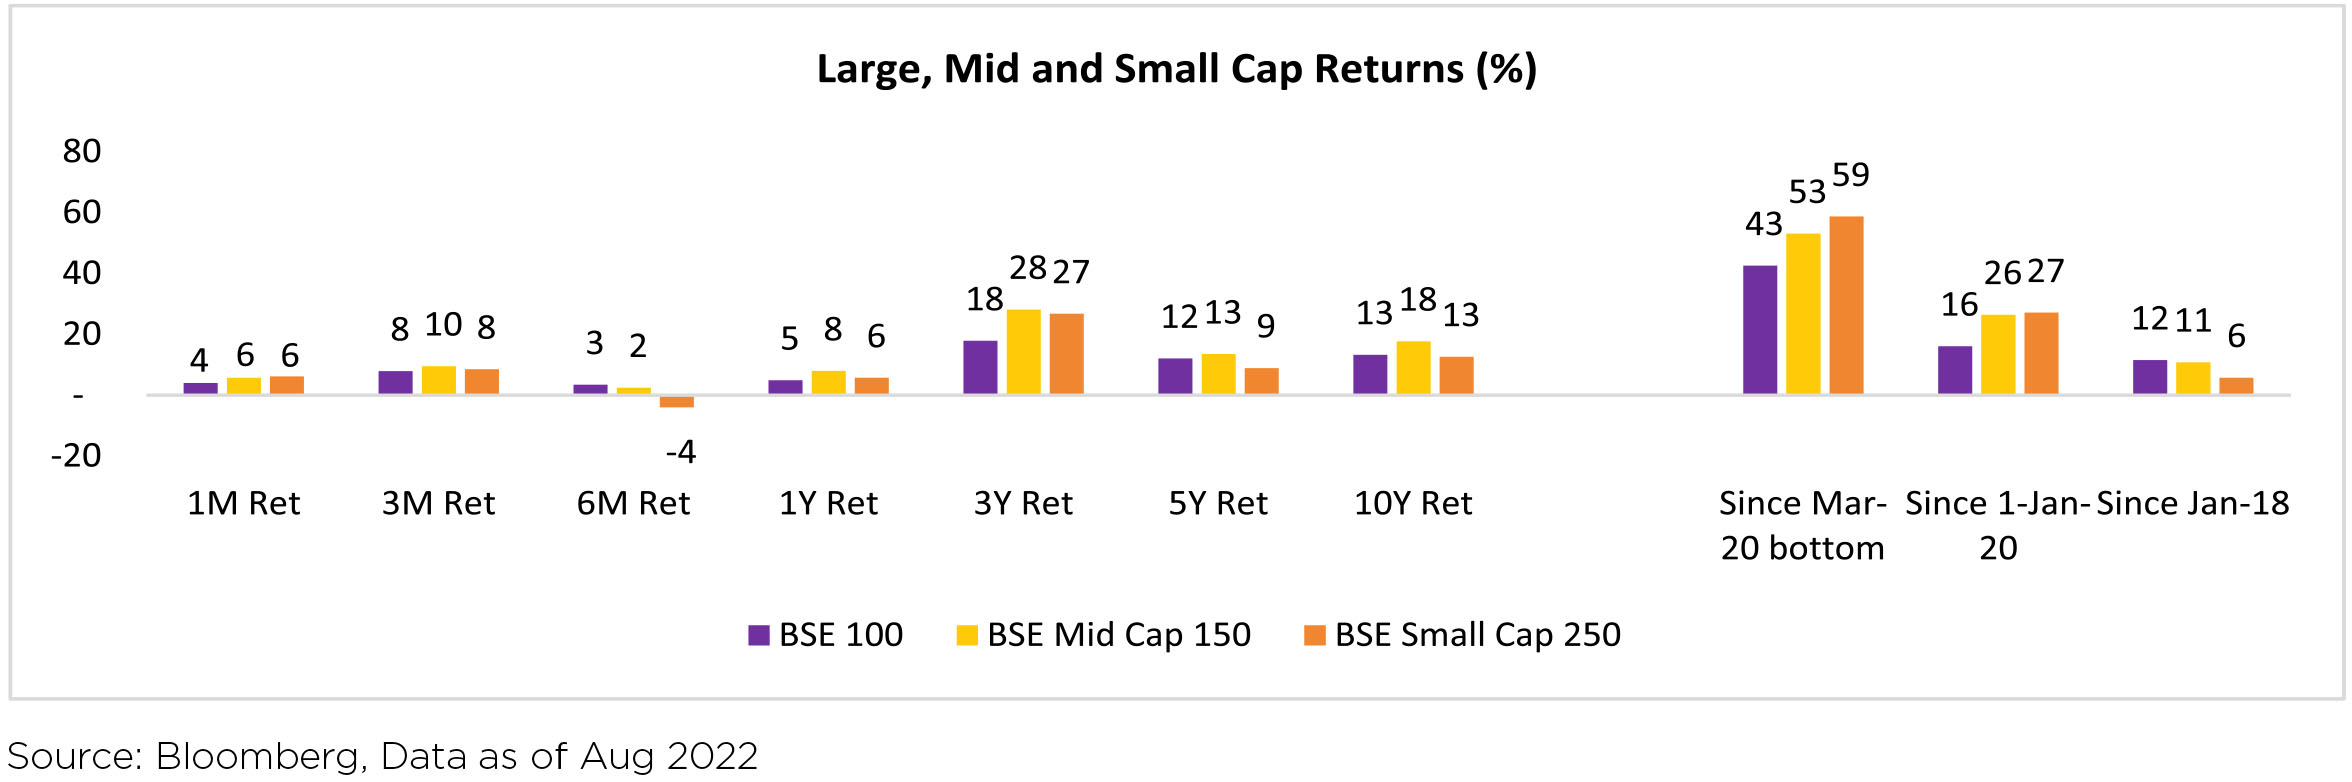
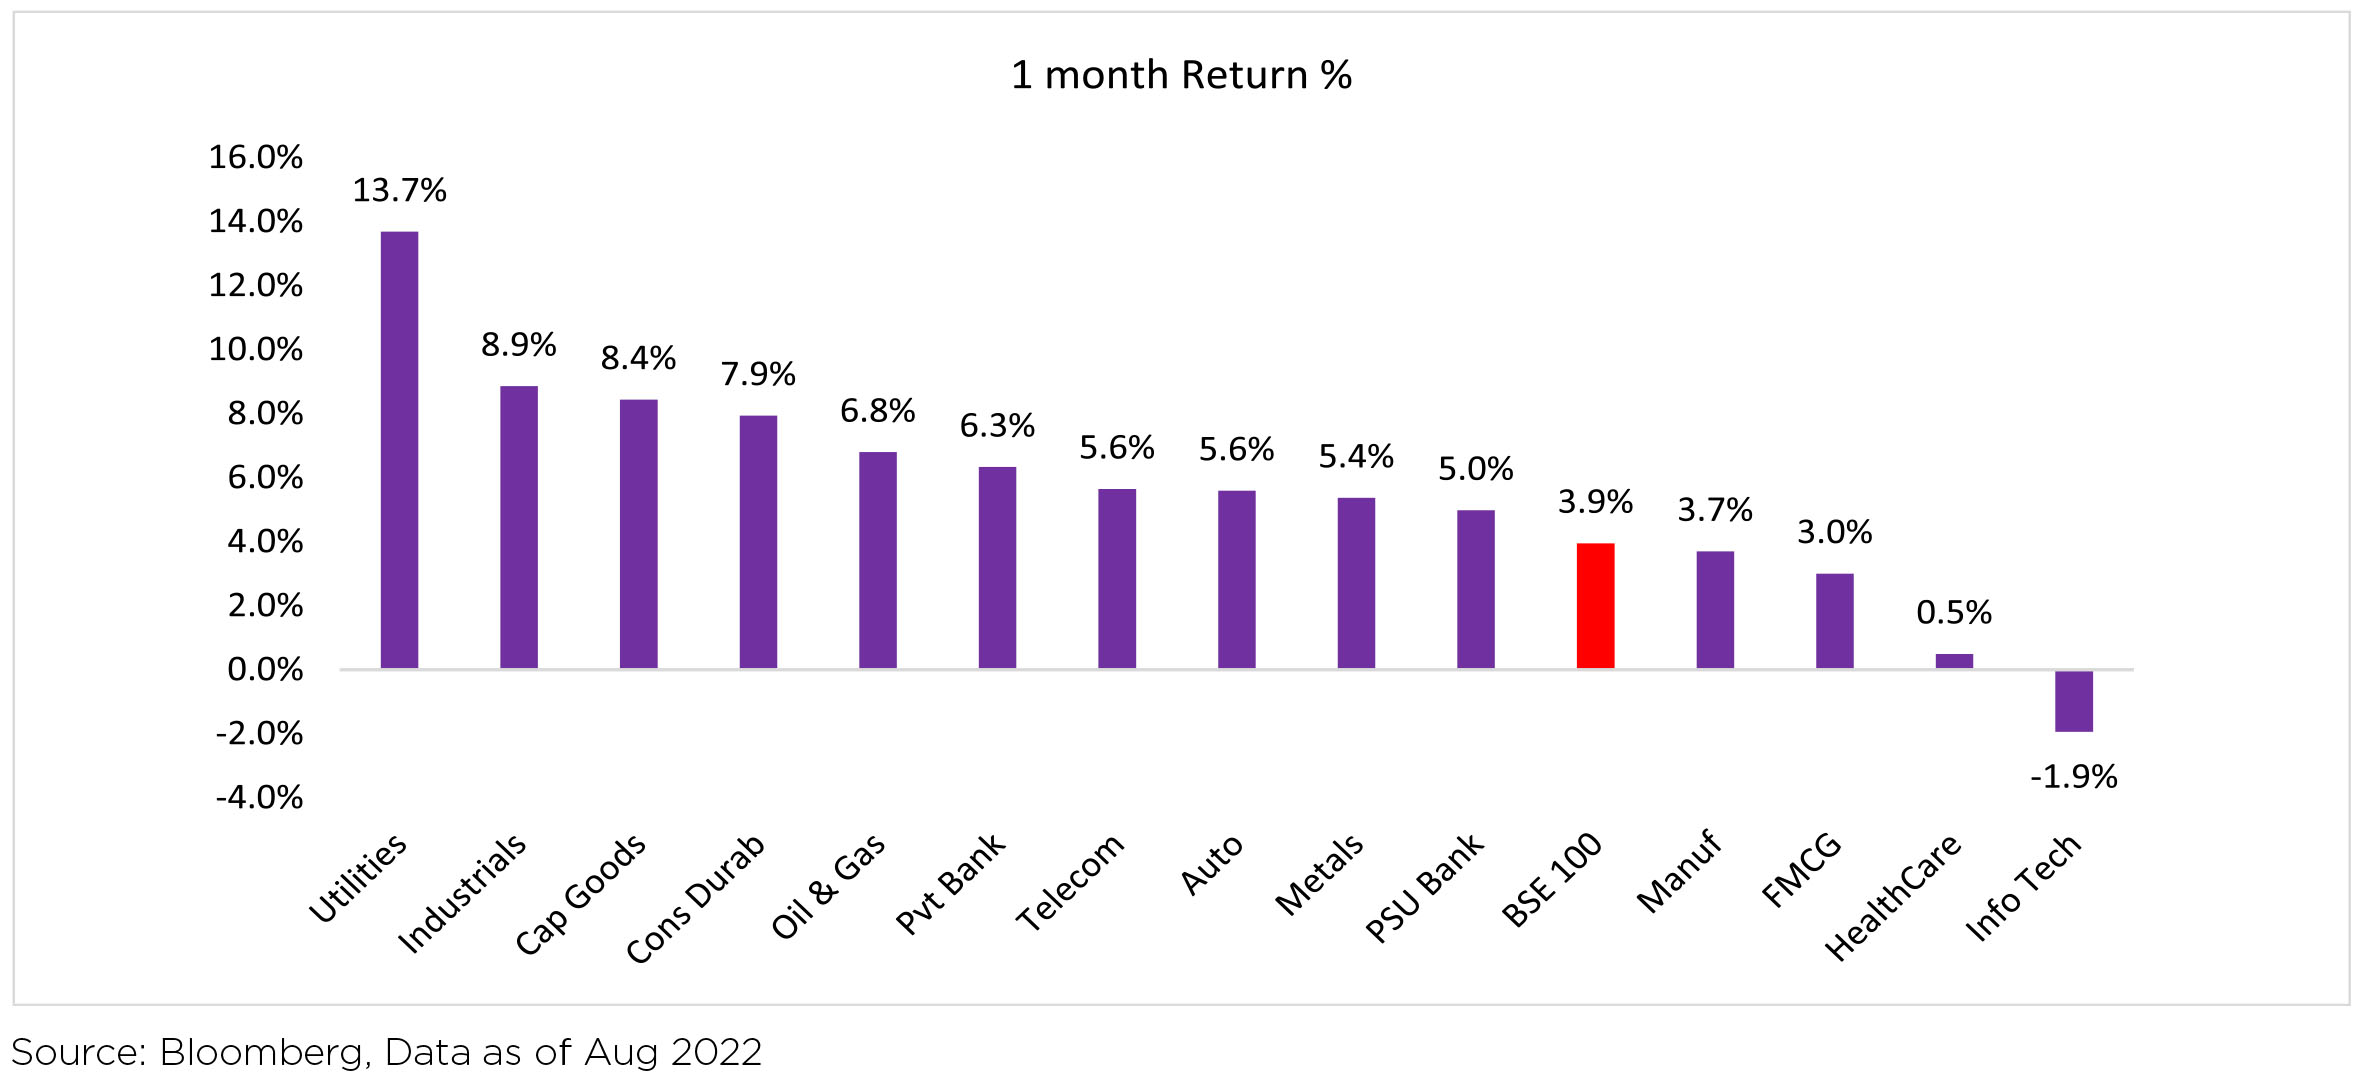
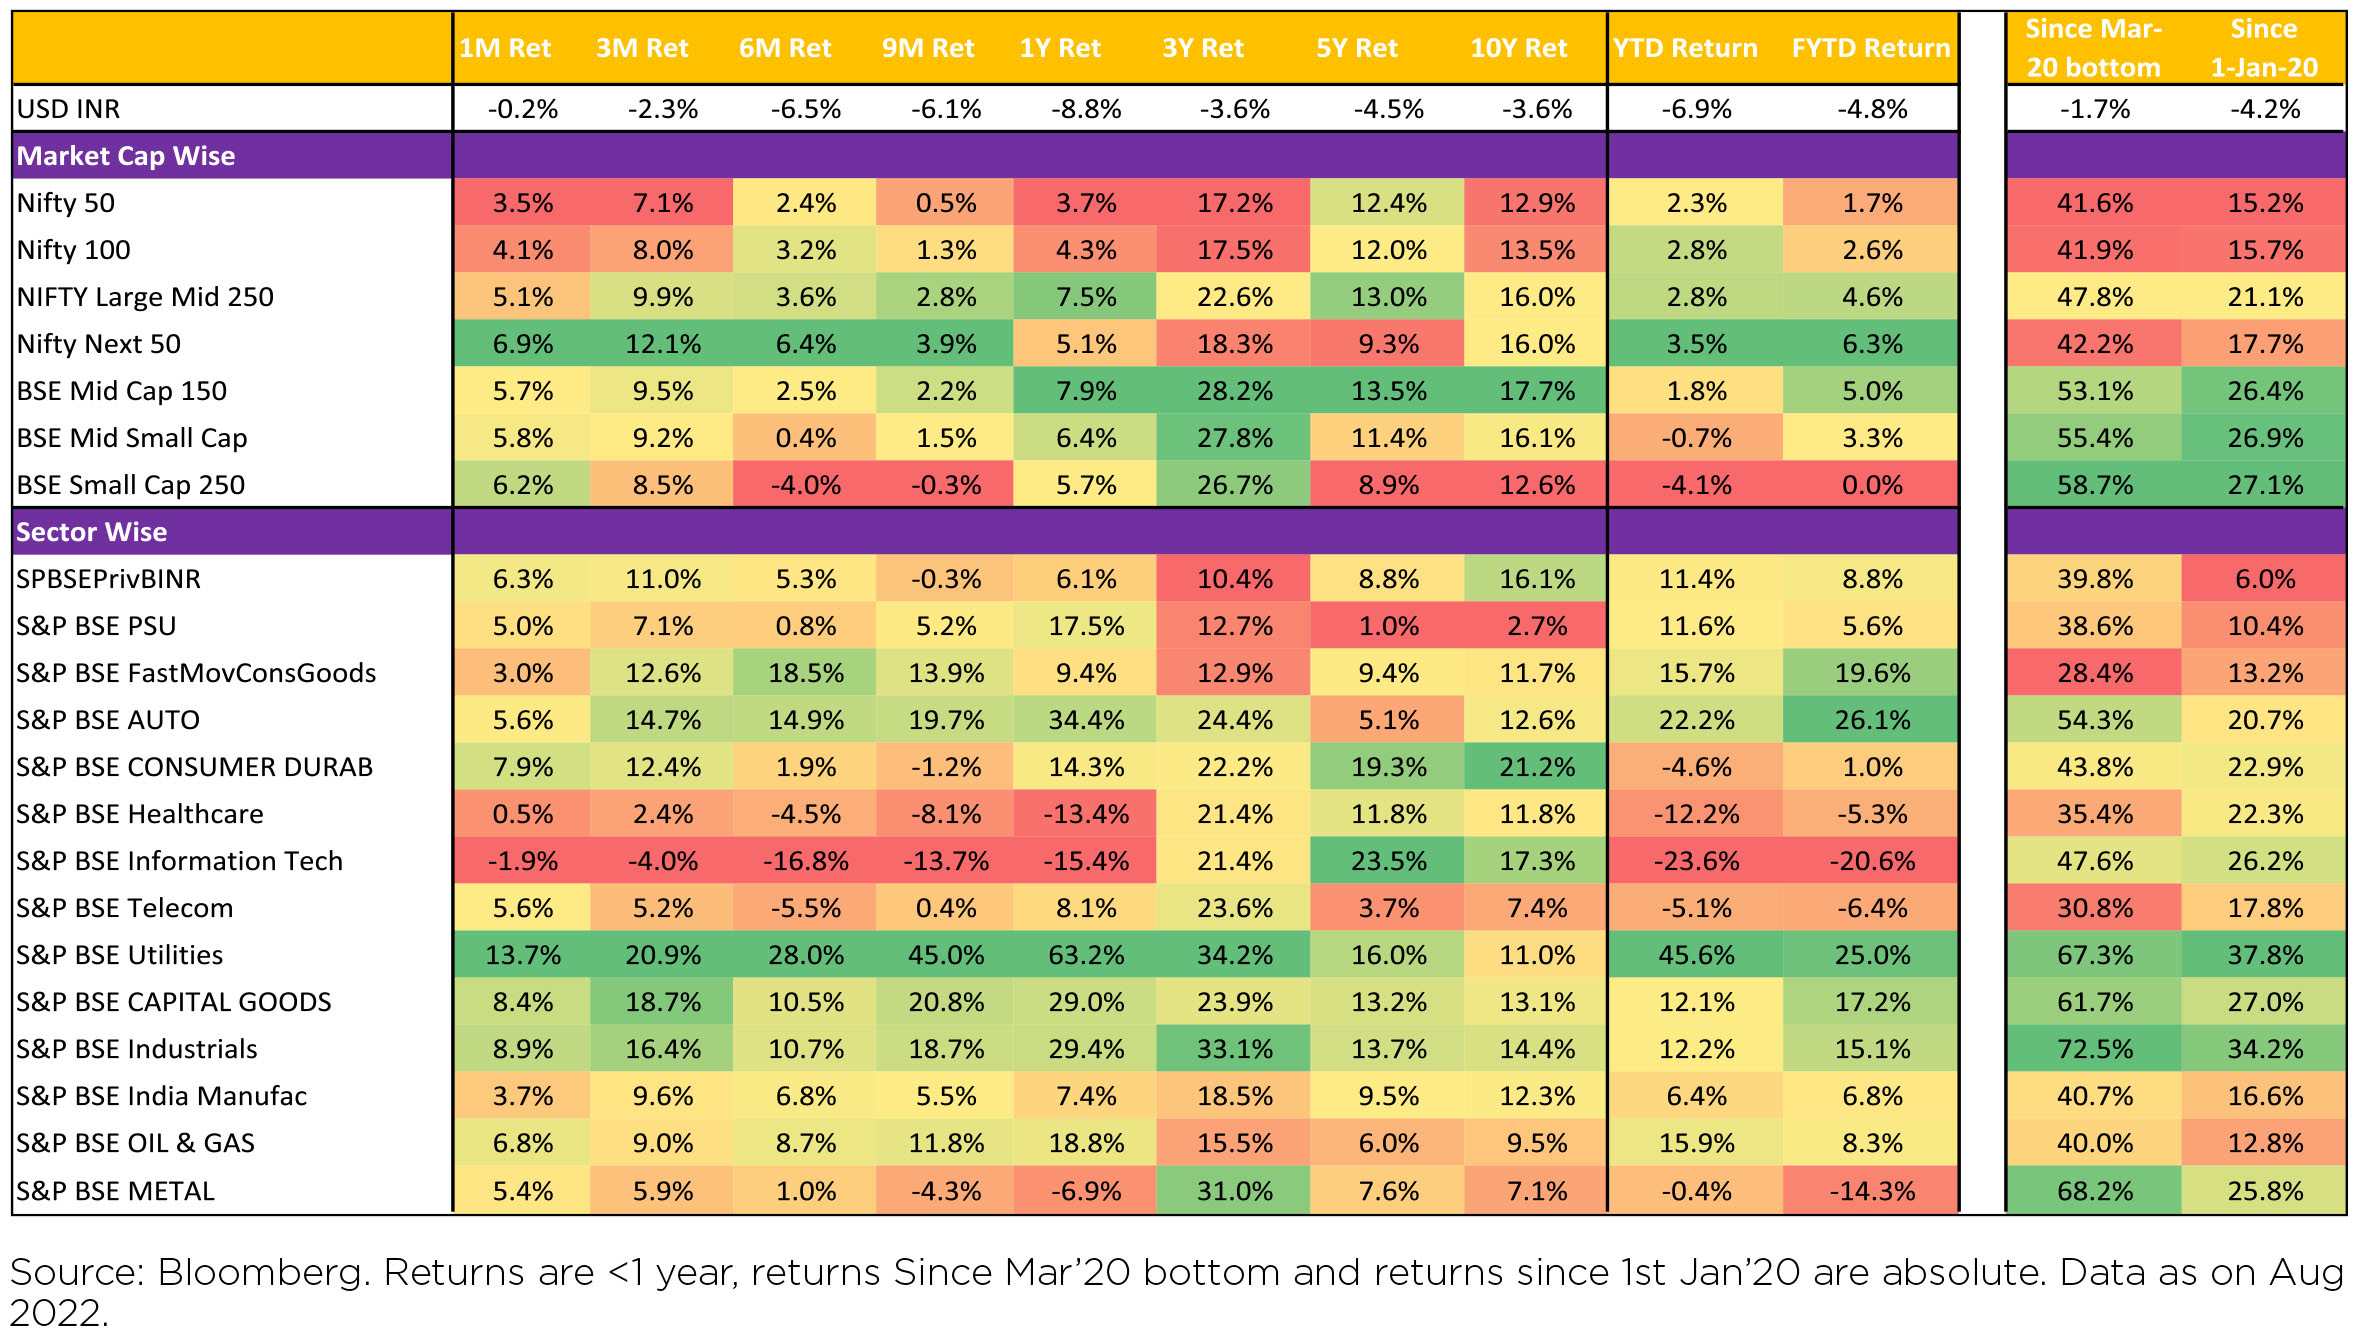
Indian equities gained 3.9% MoM ($ terms) outperforming the broader markets in August (MSCI APxJ/
EM: -0.5%/flat). Performance of both mid-caps (+6.2% MoM) and small caps (+6.1% MoM) was better than
large caps (+4.2% MoM). All sectors barring IT ended the month in the green as NIFTY improved (+3.5%
MoM), currently above 17K level.
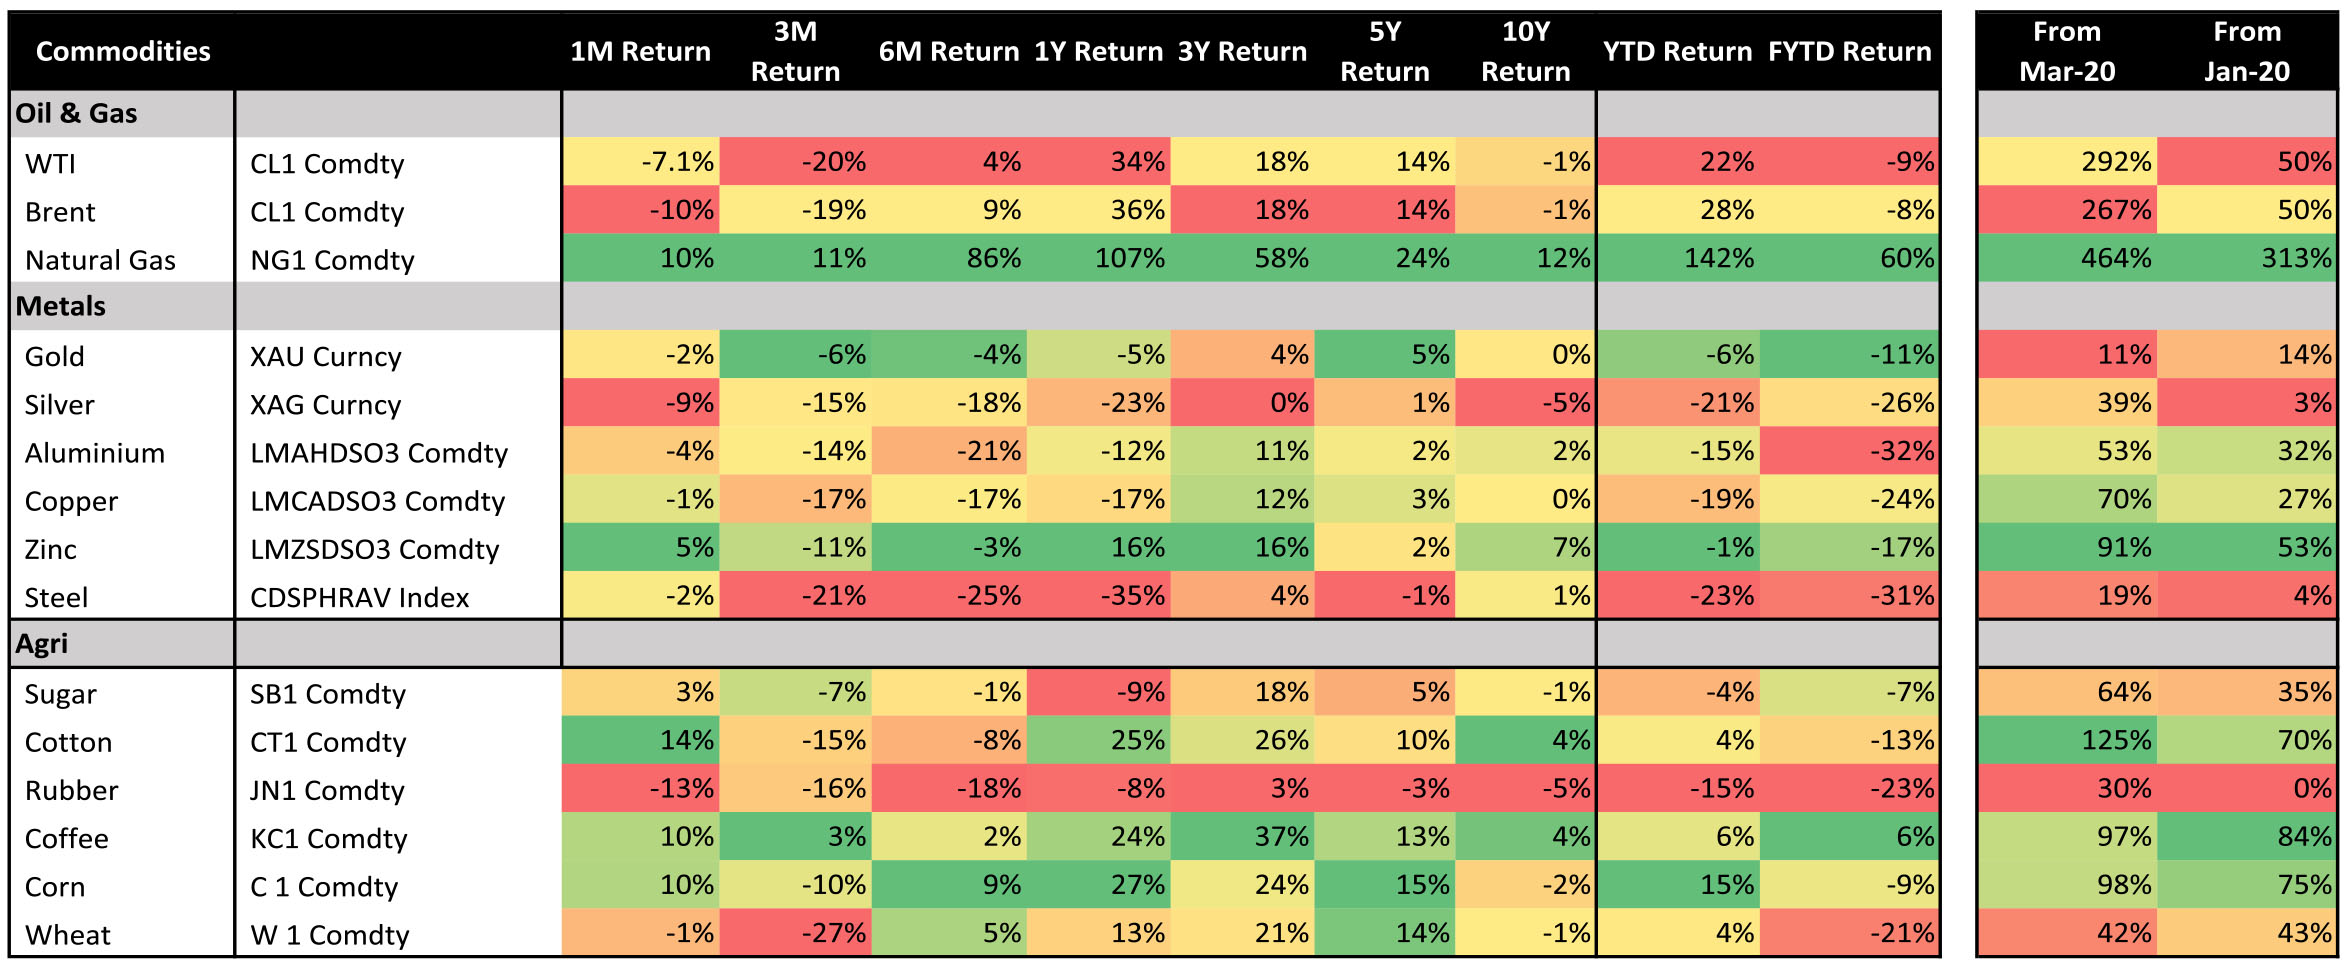
Commodities and Inflation:
Benchmark 10-year treasury yields averaged at 7.25% in August (14bps lower vs. July average). On month end values, the 10Y yield was up and ended the month at 7.18% (down 13bps MoM). US 10Y yield is at 3.12% (+47bps MoM, +181bps YoY). Oil prices (Brent Crude) declined sharply (-10%) over the month of July, following the decline of June.
US Fed Chair Jerome Powell, in his Jackson Hole speech, squarely focused on fighting inflation and stated that higher interest rates will persist for some time and that the current rate was no place to stop or pause the rate hike cycle. Powell remarked that higher interest rates, slower growth, and softer labor markets will bring down inflation and it will also cause "some pain" to households and businesses.
Domestic: GST, PMI data for August remains strong
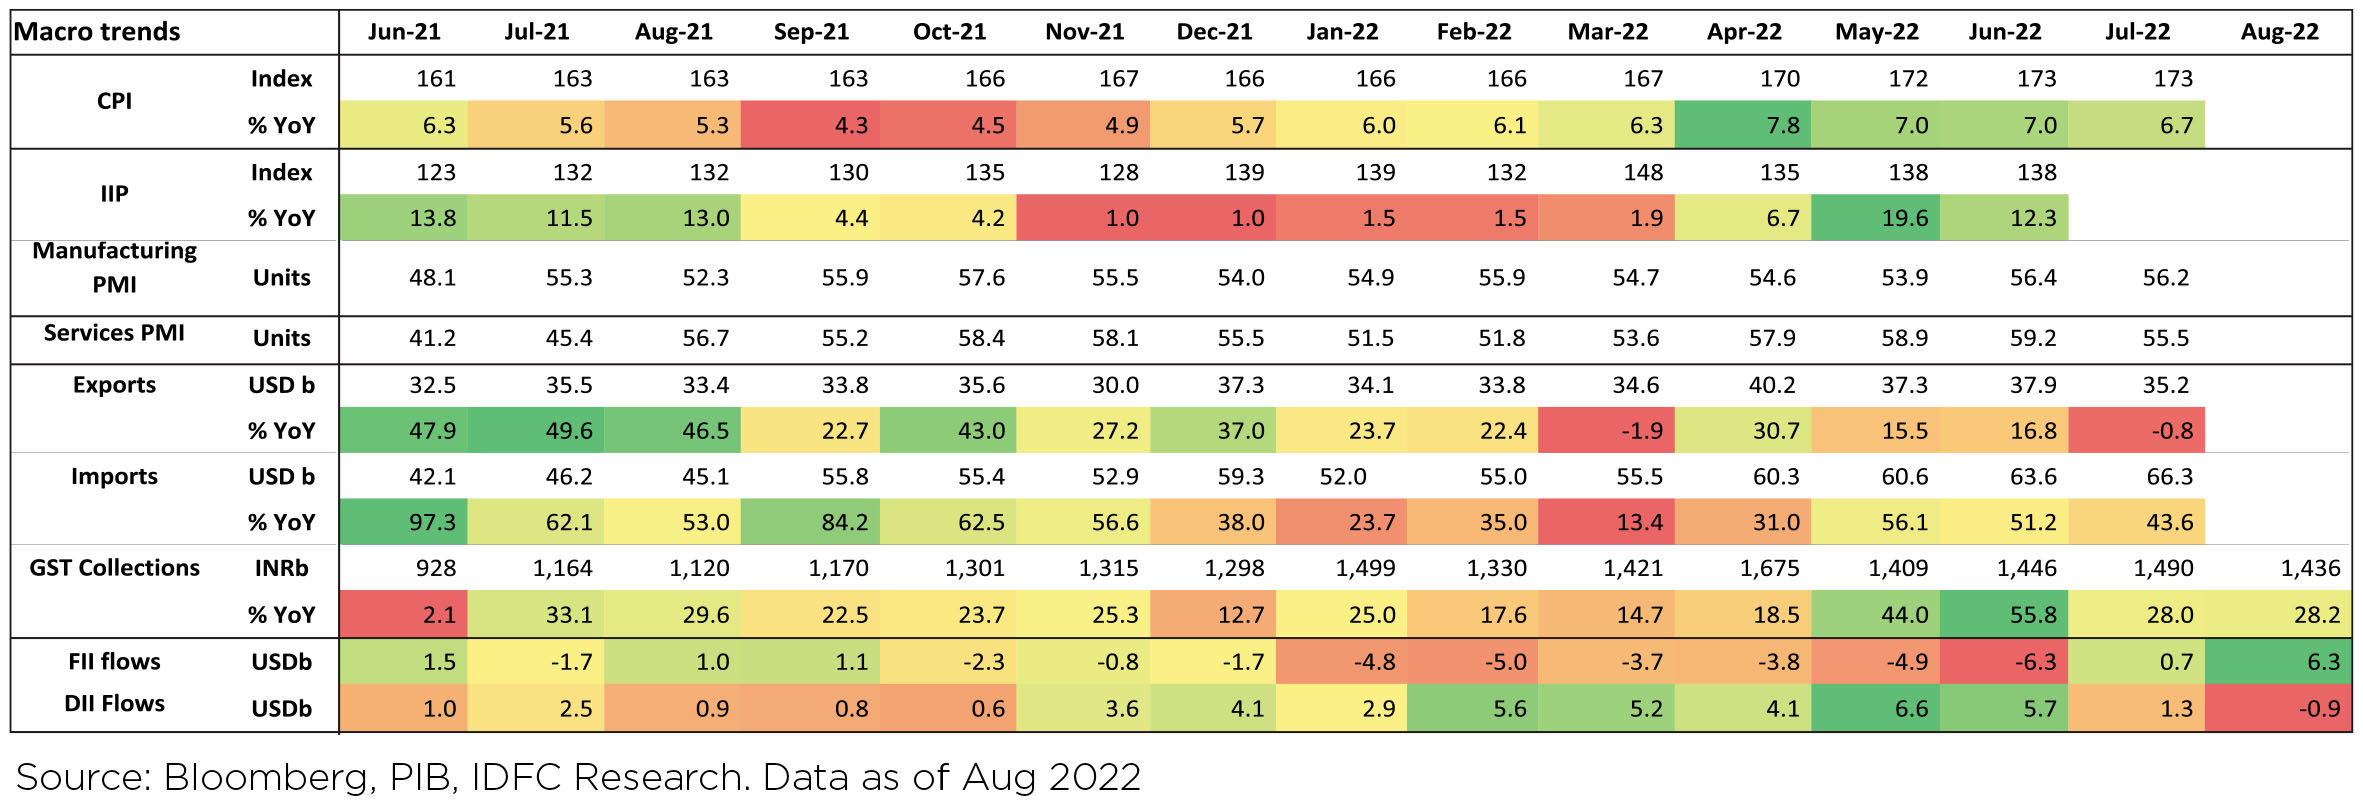
► Headline CPI momentum continued to soften in August +6.7% YoY and WPI remained firm +13.9% YoY in July (versus +15.2% YoY in June).
► IIP also continued to show strength with +12.3% YoY in June and 1.3% MoM over May. Consumption, which has been a laggard in the recovery, has been making up lost ground in recent months.
► RBI hiked policy rates by 50bps to 5.4% in the August MPC review and continued its inflation targeting focus.
► The Indian Department of Telecom auctioned spectrum for Rs1,500bn largely at reserve prices.
► SC lifted a 10-year ban on iron ore mining, raising production cap on iron ore mining in Karnataka. The judgement aligns with India's efforts to boost iron ore supply for its domestic steel mills as it embarks on an ambitious plan to increase capacity to 300mm tons by the end of the decade.
► Center's fiscal deficit in FYTD23 has been controlled with expenditure being kept in check and strong support for the revenue side. GST collections for July (collected in August) came in at Rs1,436 bn (June: Rs1,490 bn). GST collections are on track to achieve its FY2023BE target (current run-rate of Rs1.3 tn v/s to required run-rate of Rs1.26 tn).
► However, India's trade deficit continues to widen to record levels, as exports fall off - mainly led by decline ($3.2 billion) in oil exports and engineering goods. With the export taxes largely reversed since then, the coming months should see some mean-reversion of oil exports.
► Cumulative rainfall till Sept was ~6% above long-term average while weekly rainfall was 16% below longterm average. On a cumulative basis, rainfall was excess in southern India and central India, while much weaker in north west India, east and north east India. La Nina conditions are strengthening suggesting a repeat of FY11, FY12 and FY16 when India's solid agricultural output buoyed private consumption.
► DXY (Dollar Index) strengthened +2.5% over the month. INR depreciated by 0.2% MoM, reaching ~79.46/ USD in August.
FIIs were again buyers of Indian equities in August (+$6.3bn, following +$0.8bn in July). So far, India has seen YTD FII outflows of $21.5bn. FIIs turned buyers in the debt market after 6 months (+$539mn, following -$291mn selling in July). DIIs saw selling of $0.9bn in August, reversing the buying trend observed since March 2021.
The moderation in global oil and agricultural commodity prices has become a near-term disinflationary tailwind. There has also been a moderation in core goods price gains. The economic growth- central bank policy focus is likely to improve through 2H.
Domestic Markets
Commodities and Inflation:
Benchmark 10-year treasury yields averaged at 7.25% in August (14bps lower vs. July average). On month end values, the 10Y yield was up and ended the month at 7.18% (down 13bps MoM). US 10Y yield is at 3.12% (+47bps MoM, +181bps YoY). Oil prices (Brent Crude) declined sharply (-10%) over the month of July, following the decline of June.
US Fed Chair Jerome Powell, in his Jackson Hole speech, squarely focused on fighting inflation and stated that higher interest rates will persist for some time and that the current rate was no place to stop or pause the rate hike cycle. Powell remarked that higher interest rates, slower growth, and softer labor markets will bring down inflation and it will also cause "some pain" to households and businesses.
Domestic: GST, PMI data for August remains strong
► Headline CPI momentum continued to soften in August +6.7% YoY and WPI remained firm +13.9% YoY in July (versus +15.2% YoY in June).
► IIP also continued to show strength with +12.3% YoY in June and 1.3% MoM over May. Consumption, which has been a laggard in the recovery, has been making up lost ground in recent months.
► RBI hiked policy rates by 50bps to 5.4% in the August MPC review and continued its inflation targeting focus.
► The Indian Department of Telecom auctioned spectrum for Rs1,500bn largely at reserve prices.
► SC lifted a 10-year ban on iron ore mining, raising production cap on iron ore mining in Karnataka. The judgement aligns with India's efforts to boost iron ore supply for its domestic steel mills as it embarks on an ambitious plan to increase capacity to 300mm tons by the end of the decade.
► Center's fiscal deficit in FYTD23 has been controlled with expenditure being kept in check and strong support for the revenue side. GST collections for July (collected in August) came in at Rs1,436 bn (June: Rs1,490 bn). GST collections are on track to achieve its FY2023BE target (current run-rate of Rs1.3 tn v/s to required run-rate of Rs1.26 tn).
► However, India's trade deficit continues to widen to record levels, as exports fall off - mainly led by decline ($3.2 billion) in oil exports and engineering goods. With the export taxes largely reversed since then, the coming months should see some mean-reversion of oil exports.
► Cumulative rainfall till Sept was ~6% above long-term average while weekly rainfall was 16% below longterm average. On a cumulative basis, rainfall was excess in southern India and central India, while much weaker in north west India, east and north east India. La Nina conditions are strengthening suggesting a repeat of FY11, FY12 and FY16 when India's solid agricultural output buoyed private consumption.
► DXY (Dollar Index) strengthened +2.5% over the month. INR depreciated by 0.2% MoM, reaching ~79.46/ USD in August.
FIIs were again buyers of Indian equities in August (+$6.3bn, following +$0.8bn in July). So far, India has seen YTD FII outflows of $21.5bn. FIIs turned buyers in the debt market after 6 months (+$539mn, following -$291mn selling in July). DIIs saw selling of $0.9bn in August, reversing the buying trend observed since March 2021.
Market Performance
Outlook
In the recently concluded earnings season, earnings growth was driven by strong sales momentum while margins contracted mainly on account of higher raw material prices. OMC (oil marketing cos) losses were a key drag. 1QFY23 EBITDA and Net Profits of the Nifty-50 Index increased 20% and 24% YoY respectively which was mostly in-line with the consensus expectations. Among sectors which dragged profit growth during the quarter, were commodity (metals) and Oil Marketing companies (OMCs), on the other hand PSU banks (Public sector banks), Metals and private banks reported strong earnings growth.
Looking forward, FY23 Earnings have been cut by ~4% post Q1 FY23 earnings, the downgrades are broad based across sectors. As such, FY23 earnings growth rate is expected to fall from 16% to 12%. FY24E EPS estimates have largely been retained - as analysts' expectations of pressures on gross margins to reduce given the softening in commodity prices since June'22. While FY23E numbers were downgraded, upgrade cycle (Earnings upgrade to downgrade ratio) showed improvement with 38% of BSE 200 companies seeing upgrade as compared to 30% in the previous quarter.
Monsoon rainfall at ~6% above long-term average is trending well so far. Though spatial distribution of monsoon would be the key, good monsoons and a normal festive season after two years impacted by COVID, should augur well for Consumption oriented sectors. However, the earnings growth is still lopsided with BFSI being the dominant contributor. As the benefit of the recent moderation in commodity cost starts to accrue in 2HFY23E, we expect other sectors like Consumer, Autos and Cement to contribute too.
FY23E Earnings are expected to be led by strong sales growth but with margin headwinds, whereas in FY24E Sales growth is expected to moderate but margin expansion is expected to drive earnings. On a sectoral basis, Auto, Industrials and Discretionary are expected to report the highest PAT/ earnings growth whereas Commodity segment is expected to see a PAT de-growth.
In the past 2 months, Indian market shown a strong 13% return and has significantly outperformed the world and developing markets which have moved up by 4% and 3% respectively. Even on a 1year basis, Indian markets (in USD terms) have shown a 2% return while MSCI World Index is down 11%. Valuations, post the recent push, are again flirting around Oct-Dec'21 elevated levels. Stocks, it seems to have priced in all the "good news", and may be susceptible to unexpected "bad news" - rebound in crude oil; sharper than expected drop in economic metrices in the US; continued strengthening of US$ & sharper rise in US 10-year bond yields - in the near term. Tread with caution, for the near term.
Note: The above graph is for representation purposes only and should not be used for the development or implementation of an investment strategy. Past performance may or may not be sustained in the future.
What Went By
Consumer Price Index (CPI) inflation in India was 6.7% y/y in July, down from 7.8% in April, as sequential
momentum in food inflation eased. Core inflation (CPI excluding food and beverages, fuel and light) was at
5.8% in July after averaging 6% in FY22. Real time prices of edible oils have eased but that of cereals, pulses
and some vegetables are moving up.
During April-July of FY23, central government net tax revenue growth was 26% y/y while total expenditure grew 12% and capital expenditure has remained buoyant. Fiscal deficit so far is thus 20.5% of FY23 budget estimate. Small savings inflow during April-July 2022 was Rs. 4,271cr higher than that during the same period of last year. GST collection remained robust at Rs. 1.44 lakh crore and 28% y/y during August.
Industrial production (IP) growth was 12.3% y/y in June after 19.6% in May. On a seasonally adjusted monthon- month basis, it was 1.3% in June after 0.4% in May. Output momentum turned strong for consumer durable and non-durable goods categories while it weakened for the rest. Infrastructure Industries output (40% weight in IP) was again down 3.2% m/m seasonally adjusted in July, after falling 2% in May and 0.5% in June, with sequential output growth in all categories except that of steel being negative.
Bank credit outstanding as on 12th August was up 15.3% y/y and has averaged 12.2% in the latest ten fortnights (up from 8% during January-March), likely also due to higher inflation and thus higher demand for working capital. Bank deposit growth was at 8.8%. Credit flow till date during the financial year has been higher in FY22 than in FY20 and FY21 while deposit flow has been much lower. During FY22, overall bank credit flow was the highest for personal loans and lowest for industries.
Merchandise trade deficit moderated mildly to USD 28.7bn in August, after rising for four consecutive months to USD 30bn in July. While both oil and non-oil exports fell sequentially, non-oil-non-gold imports remain elevated despite some moderation in August. Trade deficit has averaged USD 22.2bn during September- August vs. USD 10.8bn during April-August 2021. During the same period, non-oil-non-gold imports picked up to an average of USD 38.3bn from USD 29.3bn.
Among higher-frequency variables, number of motor vehicles registered has moderated since May and energy consumption level is close to 2021 although it has eased after June. Monthly number of GST e-way bills generated has stayed robust.
US headline CPI eased to 8.5% y/y in July from 9.1% in June while Core CPI stayed flat at 5.9%. Sequential momentum in headline CPI was flat, driven by a drop in energy prices but also by other durable goods and services. However, housing rent momentum stayed high. US non-farm payroll addition in August (315,000 persons) was below that in July (526,000 persons) but was still above expectation. Unemployment rate inched up from 3.5% in July to 3.7% in August and sequential growth in average hourly earnings was lower. However, labour force participation rate and employment-population ratio ticked up. The FOMC (Federal Open Market Committee) increased the target range for the federal funds rate by 75bps for the second time in July, a total of 225bps since March. The Fed Governor, in his recent speech at the Jackson Hole symposium, stressed on the need to restore price stability by maintaining a restrictive policy stance for some time and that this could involve a sustained period of below-trend growth and softer labour markets.
Manufacturing PMI for China stayed in the non-expansionary territory (i.e. below 50 reading) in July and August. Total credit flow (except government bonds) and fixed asset investments continue to remain soft while consumer confidence and property market indicators (like prices, floor space under construction, etc.) remain very weak. China recently cut its five-year Loan Prime Rate by 15bps to 4.3%. However, power outages due to heat waves in certain parts of the country and renewed lockdowns in various districts, as part of China's Zero Covid Strategy, have increased risks to the growth outlook which was already expected to slow.
Outlook
1. More pronounced signs of economic breakage
It is evident now that economic growth is slowing appreciably around the world. While this is widely acknowledged by now, one suspects the extent of the eventual slowdown is still not. There seems to be momentum to the slowdown given the context of more restrictive fiscal policy now and the fact that central banks will widely keep monetary conditions tighter for longer. While China is loosening policy on the margin, there are multiple constraints here both on the quantum of easing possible and the net effect of the same. Thus the only (temporary) respite to the downward momentum to global growth could potentially be from a possible cessation of war and a consequent sharp correction in energy prices (this is mentioned as a possible scenario here and not a view). Barring that, one would expect the higher momentum data slowdown to eventually feed into the 'stickier' parts of the world economy.
In India, have two distinct advantages going for us. One, a long period issue on local corporate and bank balance sheets is now behind us. This has been a significant cyclical drag over the past many years which has now turned into a tailwind. Two, India's total monetary and fiscal policy response to Covid has been measured and responsible. This implies that there is very little overhang to deal with of excess stimulus from the past unlike in the case of many developed economies. This is also the main reason behind our view that India needn't follow the US lockstep in monetary tightening and that we can afford for our effective overnight rate to peak below 6% in this cycle. Returning to point, however, the cycle and policy tailwinds are ensuring that we now grow more robustly than many other nations around the world. The relative growth advantage will likely sustain going forward. However, the absolute growth acceleration that we have witnessed over the past few months will have to slow reflecting the weakening global growth. This starts through the export channel, as it already has, and then proceeds to impact local consumption and investments down the line.
2. Stabler rate hike expectations in DMs from here
Global rate hike expectations were in constant iteration mode (read being continually revised upwards) for most of this year till mid-June. Post that things took a breather. For a while as signs of economic breakage started to become clearer, markets began running somewhat ahead of themselves by not just lowering their terminal rate forecasts but in some cases even building significant rate cuts for late 2023 in some developed markets. As an example, around mid-July approximately 80 bps rate cuts were being priced in for the US next year. Over the past few weeks, on the back of active central bank pushes against this idea helped with continued upward pressure on European inflation, 'sense' seems to have returned. This has been evidenced in both terminal rate pricing going up as well as an expectation now that they will be at higher levels for longer. This is now more consistent with the message delivered, as an example, by Fed Chair Powell in his recent Jackson Hole speech. In Europe, policy tightening expectations had built in significantly till mid -June but then unwound appreciably on the back of weaker economic data. However, with inflation concerns going up further and with ECB seemingly showing firm resolve to contain it, rate hike expectations have sharply risen again. These gyrations are best reflected in the movement of German 2-year bond yields over the past few months. The UK has also seen very sharp recent additions to rate hike expectations from the market.
Given all of the recent building back of rate hike expectations, and with clear signs of economic breakage becoming more pronounced, it is unlikely that incoming data leads to more than, say, a 25 bps upward change in expectations from the current levels in most major DMs. Pricing is already for peak rates in this cycle being significantly higher than what are termed as long term neutral rates and thus incoming data needs to very sharply surprise for this to move even higher by a significant step.
Turning home, rate hike expectations with respect to RBI seem to also now be stabilising. To recap, these expectations had become quite unanchored post the inter-meeting hike in May. While we had held on to our view of peak effective rates in this cycle at sub-6% (basis our reading of the current global macro cycle as well as India's total, relatively modest, post Covid policy response), market pricing was far in excess of this at 'peak fear' after the May event. However, now here as well market seems to be converging towards a peak repo rate of 6 - 6.25% which is much closer to what we have been thinking. Our view of peak effective overnight rate of 5.75% is consistent with a terminal repo of 6% with overnight rates round the SDF, 25 bps below.
3. Tighter global financial conditions and possible implications
While DM sovereign rates may be more range bound from here, this doesn't mean that we are done with tightening in global financial conditions. As rates stay tighter for longer in the face of economic breakage, this may get evidenced more in the usual risk off trades like stronger DM currencies and wider corporate bond spreads (DM corporate bond spreads are still relatively well behaved and seem to have significant room to expand). Many emerging market (EM) bond yields are also like 'spread' assets for global capital. Thus, a tighter for longer policy environment in DMs will entail stricter financial conditions and hence a widening of spreads. This may impact yields in many EMs as well.
Over the first half of the year when the world was readjusting its expectation of global monetary tightening, the linkage to Indian bonds was largely through interest rate swaps rather than outright bond selling by foreign investors in a big way. Most of the capital outflows were instead from the equities markets. This probably reflects the fact that active foreign interest has been missing from Indian bonds over the past few years and hence the amount of rebalancing out may also consequently be lower. Portfolio rebalancing on possible another bout of risk aversion ahead may not impact India's bonds significantly. Also, with spread between bond and swap having opened up (5 year government bond yields were around 60 bps over 5 year swap yields at the time of writing), there is room for this to compress without significantly impacting underlying bond yields.
However, this doesn't mean that local bonds are immune to global financial conditions tightening. This needs to be still respected, in our view. As an example, lately the local bond market is abuzz with expectations that India is on the cusp of being included in at least one of the large global sovereign bond indices. The argument heard is that this time around this is on 'pull' from investors desiring some diversification to their EM exposures. Hence it may go through even without associated facilitators that required leeway on taxation which apparently our policymakers were against. The expectation is that the while flows associated with actual index inclusion may take some time, and the weight assigned to Indian bonds in the index itself would only gradually go up, other 'fast money' flow may pre-empt this and already start coming in. Basis this expectation, one has seen a bull flattening over the past few sessions thereby further flattening the 5 to 10 year yield spread, as local participants have taken positions in longer duration bonds anticipating this announcement.
We have no idea how far this can stretch in the near term. However, nothing changes to our underlying view that if there's one point of concern that bond markets ought to have over the medium term, it is the amount of duration supply. This is both on account of higher than pre-pandemic averages on likely fiscal deficit over the next few years as well as a shift higher in annual bond maturities over the next many years from what was the case in the past. Even adjusted for nominal growth in participant balance sheets, this is a significant step up in duration supply and likely needs support from a demand standpoint. Absent offshore investors, RBI would have eventually stepped in to buy bonds as a means to expand its balance sheet. With index inclusion, offshore investors will buy bonds and RBI will get the dollars to expand balance sheet. Then RBI wouldn't need to buy bonds. Either way, over the medium term, the eventual effect on bond yields may be similar.
Thus, the issue of duration absorption may still persist after the initial euphoria on index inclusion subsides. Also, this would be in what is a tighter global financing environment. In India too even as our peak rate expectations are in place, we would expect RBI to hold them there for longer. Thus investors should continue to want higher risk premia from yields for holding higher duration over the medium term. Also given how unforgiving the global environment is, we don't want to be too 'tactical' with our portfolio strategies by trying to chase the bull flattening. All told then, we continue to find the most value in 4-5 year government bonds.
