
IDFC DYNAMIC EQUITY FUND

|
|
|
|
|
IDFC DYNAMIC EQUITY FUND
An open ended dynamic asset allocation fund
FUND PHILOSOPHY*
IDFC Dynamic Equity Fund is a hybrid fund with active equity
allocation changing based on the trailing P/E of Nifty 50 index.
The fund has a pre-defined model which indicates the range of
active equity allocation based on P/E levels, and there are 6
different range of equity allocation possible. Higher the P/E
band, lower will be the active equity allocation and vice versa.
Change of bands happen once a month while changes within
the band happen dynamically on a day to day basis. The active
equity portfolio is managed like a diversified fund. Active stock
selection philosophy combines quality stocks with good
growth potential. The quality filters for the fund are –
conversion of EBIDTA to operating cash – OCF as % of EBIDTA
> 33%; Moderate leverage: Debt EBIDTA <3x; Profitability:
EBIDTA / Net operating Assets >30%. Thus, companies which
qualify these parameters and have higher visibility of growth
versus peers will form the core portfolio. Depending on P/E
levels, the fund can have more large or mid/small cap names.
The fund will also use Nifty futures to dynamically manage
active equity allocation within a month.
The debt portion of the fund is actively managed. The portfolio
emphasizes on maintaining high credit quality and currently
has 100% in AAA or equivalent instruments. Further the
portfolio is oriented towards short-to-medium duration
strategies.
Bloomberg Nifty P/E data as on 31st July 2020 indicates a value
of 23.6 and equity band for the month will change from
55-65% to 40-55%..
OUTLOOK
Indian equities continued their upward momentum in July with
markets rebounding by 46% from March lows despite the
relentless increase in daily new Covid cases and sharp earnings
downgrades.
Going forward, the pace of economic recovery would depend
largely on the extent of local lockdowns on account of spread of
Covid-19. Markets seems to have run ahead of fundamentals and
are less than 10% lower than all-time highs. Global and domestic
liquidity seems to have played a significant part in the sharp
upmove seen in the markets. Investors should tread with caution
as the number of cases and deaths in India continue to rise. Also,
earnings uncertainty for FY21 is fairly high with a wide range of
analyst estimates. Various valuation parameters after dropping
to an “attractive” zone in April’20 have moved into the
“expensive” zone. Investors need to be cautious at current levels
given the combination of higher valuation and a possibility of a
slower than expected earnings recovery in FY21.
FUND FEATURES: (Data as on 31st July'20)
Category: Dynamic Asset Allocation or Balanced Advantage
Monthly Avg AUM: Rs903.24 Crores
Inception Date: 10th October 2014
Fund Manager:
Equity Portion : Mr. Arpit Kapoor and
Mr. Sumit Agrawal (w.e.f. 01/03/17)
Debt Portion : Mr. Arvind Subramanian
(w.e.f. 09/11/2015)
Standard Deviation (Annualized): 13.86%
Modified Duration: 2.52 years*
Average Maturity: 3.32 years*
Yield to Maturity: 4.82%*
*Of Debt Allocation Only
Benchmark: 50% S&P BSE 200 TRI + 50%
NIFTY AAA Short Duration Bond Index
(w.e.f 11/11/2019)
Asset allocation:
Gross Equity (including Arbitrage): 67.11%
Debt: 32.89%
Net Equity: 54.27%
Market Cap Split:
Large Cap: 77.76%
Mid and Small Cap: 22.24%
Minimum Application Amount: Rs5,000/- and any amount thereafter.
Exit Load: In respect of each purchase of Units:
- For 10% of investment: Nil
- For remaining investment: 1% if
redeemed/ switched out within 1 year
from the date of allotment (w.e.f. July 5,2017)
SIP Frequency Monthly (Investor may
choose any day of the month except 29th,
30th and 31st as the date of instalment.)
Options Available: Growth, Dividend
(Payout, Reinvestment and Sweep (from
Equity Schemes to Debt Schemes only))
| PLAN | DIVIDEND RECORD DATE | ₹/UNIT NAV | NAV |
| REGULAR | 15-Jun-20 | 0.10 | 10.4300 |
| 28-Jan-20 | 0.15 | 11.3200 | |
| 23-Oct-19 | 0.14 | 11.0300 | |
| DIRECT | 15-Jun-20 | 0.11 | 11.1900 |
| 28-Jan-20 | 0.16 | 12.0800 | |
| 23-Oct-19 | 0.15 | 11.7300 |
Dividend is not guaranteed and past performance may or may not be sustained in future. Pursuant to payment of dividend, the NAV of the scheme would fall to the extent of payout and statutory levy (as applicable).
| PORTFOLIO | (31 July 2020) |
| Name | Ratings | % of NAV |
| Equity and Equity related Instruments | 67.11% | |
| Net Equity Exposure | 54.27% | |
| Pharmaceuticals | 8.35% | |
| Cipla | 2.13% | |
| Cipla - Equity Futures | -1.67% | |
| Aurobindo Pharma | 2.12% | |
| Divi's Laboratories | 1.83% | |
| IPCA Laboratories | 1.82% | |
| Alkem Laboratories | 1.43% | |
| Lupin | 0.82% | |
| Lupin - Equity Futures | -0.12% | |
| Software | 7.79% | |
| Infosys | 4.73% | |
| Tech Mahindra | 1.83% | |
| Tata Consultancy Services | 0.61% | |
| HCL Technologies | 0.61% | |
| Finance | 6.99% | |
| Muthoot Finance | 2.95% | |
| SBI Life Insurance Company | 1.18% | |
| Bajaj Finserv | 1.14% | |
| Bajaj Finserv - Equity Futures | -0.25% | |
| ICICI Lombard General Insurance Company | 0.98% | |
| Bajaj Finance | 0.61% | |
| Bajaj Finance - Equity Futures | -0.61% | |
| Mas Financial Services | 0.51% | |
| ICICI Securities | 0.49% | |
| Banks | 6.59% | |
| HDFC Bank | 4.15% | |
| HDFC Bank - Equity Futures | -0.37% | |
| ICICI Bank | 3.47% | |
| ICICI Bank - Equity Futures | -0.67% | |
| Axis Bank | 0.92% | |
| Axis Bank - Equity Futures | -0.92% | |
| Kotak Mahindra Bank | 0.66% | |
| Kotak Mahindra Bank - Equity Futures | -0.65% | |
| Consumer Non Durables | 5.46% | |
| Hindustan Unilever | 2.45% | |
| Nestle India | 2.22% | |
| Dabur India | 0.90% | |
| Dabur India - Equity Futures | -0.90% | |
| Britannia Industries | 0.41% | |
| Prataap Snacks | 0.37% | |
| Asian Paints | 0.17% | |
| Asian Paints - Equity Futures | -0.17% | |
| Petroleum Products | 4.77% | |
| Reliance Industries | 6.46% | |
| Reliance Industries - Equity Futures | -1.70% | |
| Telecom - Services | 4.18% | |
| Bharti Airtel | 4.18% | |
| Name | Ratings | % of NAV |
| Auto Ancillaries | 3.42% | |
| Minda Industries | 0.93% | |
| Sandhar Technologies | 0.74% | |
| MRF | 0.66% | |
| Balkrishna Industries | 0.57% | |
| Tube Investments of India | 0.52% | |
| Cement | 2.97% | |
| JK Cement | 1.34% | |
| UltraTech Cement | 1.33% | |
| Sagar Cements | 0.30% | |
| Industrial Products | 2.89% | |
| SRF | 0.82% | |
| AIA Engineering | 0.80% | |
| Supreme Industries | 0.69% | |
| Shaily Engineering Plastics | 0.57% | |
| Retailing | 1.12% | |
| Avenue Supermarts | 0.89% | |
| Aditya Birla Fashion and Retail | 0.23% | |
| Construction Project | 0.78% | |
| Larsen & Toubro | 1.77% | |
| Larsen & Toubro - Equity Futures | -1.35% | |
| KEC International | 0.36% | |
| Pesticides | 0.76% | |
| PI Industries | 0.76% | |
| Construction | 0.40% | |
| PNC Infratech | 0.40% | |
| Chemicals | 0.34% | |
| Rossari Biotech | 0.34% | |
| Consumer Durables | 0.13% | |
| Khadim India | 0.13% | |
| Gas | 0.02% | |
| Indraprastha Gas | 0.80% | |
| Indraprastha Gas - Equity Futures | -0.78% | |
| Index | -2.69% | |
| Nifty 50 Index - Equity Futures | -2.69% | |
| Corporate Bond | 14.55% | |
| Reliance Industries | AAA | 4.33% |
| Indian Railway Finance Corporation | AAA | 2.89% |
| LIC Housing Finance | AAA | 2.83% |
| Power Finance Corporation | AAA | 2.79% |
| REC | AAA | 1.68% |
| NTPC | AAA | 0.03% |
| Certificate of Deposit | 5.36% | |
| ICICI Bank | A1+ | 2.69% |
| Axis Bank | A1+ | 2.67% |
| Treasury Bill | 3.75% | |
| 182 Days Tbill - 2020 | SOV | 3.75% |
| Net Cash and Cash Equivalent (including Margin FD) | 9.24% | |
| Grand Total | 100.00% |
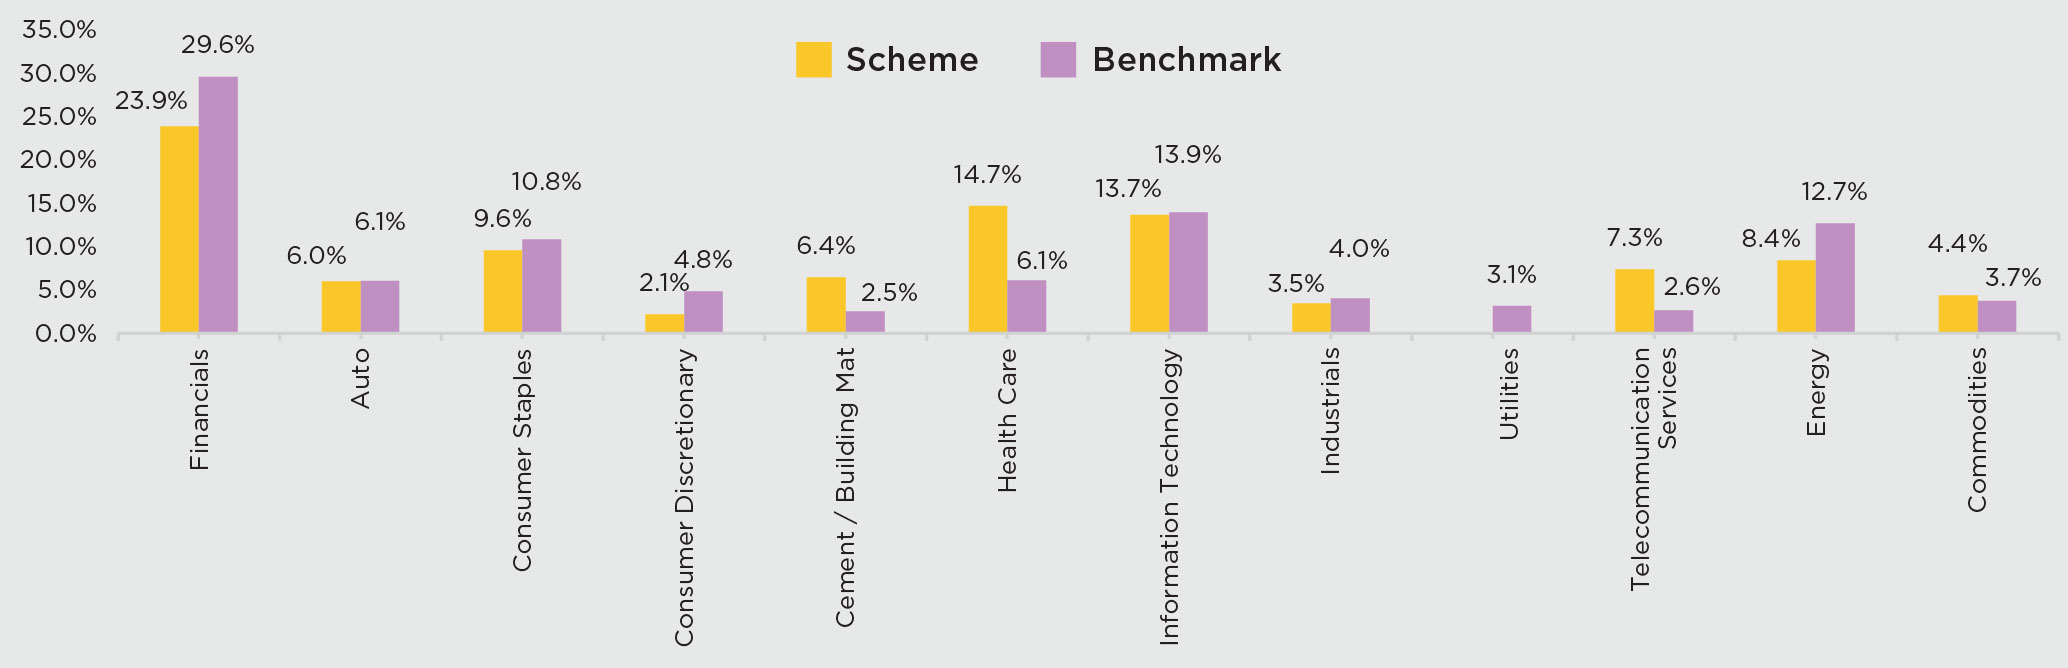
SECTOR ALLOCATION
RISKOMETER
This product is suitable for investors who are seeking*:
• To create wealth over long term
• Dynamic allocation towards equity, derivatives, debt and money market instruments
*Investors should consult their financial advisors if in doubt about
whether the product is suitable for them.
|
|
The above mentioned is the current strategy of the Fund Manager. However, asset allocation and investment strategy shall be within broad parameters of Scheme Information Document.
 | Contact your Financial Advisor |
 | Call toll free 1800-2-6666-88 |
| Contact your Financial Advisor | Call toll free 1800-2-6666-88 |
 Invest online at www.idfcmf.com |  www.facebook.com/idfcamc |
 @IDFCMF | |