
IDFC STERLING VALUE FUND

|
|
|
|
|
IDFC STERLING VALUE FUND
(Previously known as IDFC Sterling Equity Fund w.e.f. May 28, 2018)
An open ended equity scheme following a value investment strategy
IDFC Sterling Value Fund is a value
oriented fund with the current focus on
the mid and small cap segment*.
FUND PHILOSOPHY*
The focus of IDFC Sterling Value Fund has been on building a portfolio of Leader/Challengers and Emerging businesses with an emphasis on bottom up stock selection. As part of the current strategy, the portfolio looks to build on the leaders/challengers – these are the market leaders in the Non-Nifty sectors (like Tyres, Bearings) or Top Challengers in the Nifty sectors (such as FMCG, Banks). The key parameters that we look at while selecting the companies here are low debt to operating cash flow and ROIC (Return on Invested Capital) greater than the Cost of Capital (CoC). The other part of the portfolio focuses on the Emerging Businesses. These are businesses in down cycles or where scale is yet to be achieved or where companies can fund growth without repeated dilutions. Many a times, earnings do not capture fair value of the businesses in down cycles or that are yet to achieve scale and hence popular ratios such as P/E ratio might not be the relevant metric to value the company. Thus, we believe that a better parameter for relative value evaluation could be the Enterprise Value (EV)/Sales ratio & Price/Book (P/B). We also filter stocks for Sustained improvement in RoE (Return on Equity) and RoCE (Return on Capital Employed) and those with Earnings Growth higher than Nifty. This segregation helps in easy management of risk & liquidity aspects of the portfolio.
OUTLOOK
Indian equities continued their upward momentum in August
following the trend in global markets, even as India continues
to see a sharp increase in daily new Covid-19 cases. In August
and over the last 3-month basis, Small Caps significantly
outperformed Mid and Large Caps. Since the bottom in
March-20, Large, Mid and Small Caps have bounced 50%, 52%
and 66% respectively.
Going forward, the pace of economic recovery would depend
largely on the extent of local lockdowns on account of spread
of Covid-19. Markets seems to have run ahead of fundamentals
and are less than 10% lower than all-time highs. Global and
domestic liquidity seems to have played a significant part in
the sharp up move seen in the markets. Investors should tread
with caution as the number of cases and deaths in India
continue to rise. Also, earnings uncertainty for FY21 is fairly
high with a wide range of analyst estimates.
FUND FEATURES: (Data as on 31st August'20)
Category: Value
Monthly Avg AUM: Rs2,577.05 Crores
Inception Date: 7th March 2008
Fund Manager:
Mr. Anoop Bhaskar (w.e.f. 30/04/2016) & Mr. Daylynn Pinto (w.e.f. 20/10/2016)
Beta: 1.03
R Square: 0.96
Standard Deviation (Annualized): 28.74%
Benchmark: S&P BSE 400 MidSmallCap
TRI (w.e.f 11/11/2019)
Minimum Investment Amount: Rs5,000/- and any amount thereafter.
Exit Load:
• If redeemed/switched out within 365
days from the date of allotment:
➧ Upto 10% of investment:Nil,
➧ For remaining investment: 1% of
applicable NAV.
•If redeemed / switched out after 365
days from date of allotment: Nil. (w.e.f.
May 08, 2020)
SIP Frequency Monthly (Investor
may choose any day of the month
except 29th, 30th and 31st as the date
of instalment.)
Options Available: Growth, Dividend
(Payout, Reinvestment and Sweep
(from Equity Schemes to Debt
Schemes only))
| PLAN | DIVIDEND RECORD DATE | ₹/UNIT | NAV |
| REGULAR | 20-Mar-20 | 0.73 | 12.8800 |
| 16-Feb-18 | 1.38 | 23.2025 | |
| 10-Mar-17 | 1.31 | 18.6235 | |
| DIRECT | 10-Mar-17 | 1.37 | 19.3894 |
| 21-Mar-16 | 1.50 | 16.3433 | |
| 16-Mar-15 | 2.00 | 20.8582 |
Dividend is not guaranteed and past performance may or may not be sustained in future. Pursuant to payment of dividend, the NAV of the scheme would fall to the extent of payout and statutory levy (as applicable).
| PORTFOLIO | (31 August 2020) |
| Name of the Instrument | % of NAV |
| Equity and Equity related Instruments | 98.12% |
| Auto Ancillaries | 11.25% |
| o MRF | 2.31% |
| Minda Industries | 1.81% |
| Exide Industries | 1.50% |
| Tube Investments of India | 1.23% |
| Wheels India | 1.05% |
| Asahi India Glass | 1.03% |
| WABCO India | 0.98% |
| Bosch | 0.97% |
| Sterling Tools | 0.36% |
| Cement | 9.16% |
| o JK Cement | 3.06% |
| o The Ramco Cements | 2.63% |
| ACC | 1.91% |
| Prism Johnson | 1.08% |
| Sagar Cements | 0.48% |
| Pharmaceuticals | 7.92% |
| o IPCA Laboratories | 3.59% |
| Aurobindo Pharma | 2.31% |
| Dishman Carbogen Amcis | 1.14% |
| Alembic Pharmaceuticals | 0.89% |
| Finance | 7.20% |
| ICICI Securities | 2.27% |
| Mas Financial Services | 2.19% |
| ICICI Lombard General Insurance Company | 2.15% |
| Magma Fincorp | 0.59% |
| Banks | 6.94% |
| o ICICI Bank | 3.60% |
| Axis Bank | 2.08% |
| RBL Bank | 1.27% |
| Consumer Non Durables | 6.17% |
| o Emami | 2.31% |
| Tata Consumer Products | 1.92% |
| Radico Khaitan | 1.68% |
| Procter & Gamble Hygiene and Health Care | 0.27% |
| Consumer Durables | 6.17% |
| Voltas | 2.17% |
| Crompton Greaves Consumer Electricals | 1.91% |
| Greenply Industries | 1.01% |
| Greenpanel Industries | 0.56% |
| Butterfly Gandhimathi Appliances | 0.52% |
| Software | 5.15% |
| Birlasoft | 2.26% |
| Persistent Systems | 1.64% |
| KPIT Technologies | 1.25% |
| Construction Project | 4.50% |
| o KEC International | 3.27% |
| NCC | 1.23% |
| Ferrous Metals | 4.25% |
| o Jindal Steel & Power | 2.88% |
| Maharashtra Seamless | 0.79% |
| Kirloskar Ferrous Industries | 0.57% |
| Retailing | 3.98% |
| V-Mart Retail | 1.31% |
| Future Retail | 1.23% |
| Aditya Birla Fashion and Retail | 0.86% |
| Future Lifestyle Fashions | 0.57% |
| Industrial Products | 3.67% |
| Bharat Forge | 1.73% |
| Polycab India | 1.22% |
| Graphite India | 0.72% |
| Chemicals | 3.51% |
| o Deepak Nitrite | 3.51% |
| Gas | 2.60% |
| o Gujarat Gas | 2.60% |
| Industrial Capital Goods | 2.48% |
| Bharat Electronics | 1.61% |
| CG Power and Industrial Solutions | 0.54% |
| Skipper | 0.32% |
| Hotels, Resorts And Other Recreational Activities | 2.39% |
| The Indian Hotels Company | 1.85% |
| EIH | 0.53% |
| Textiles - Cotton | 1.92% |
| Vardhman Textiles | 1.53% |
| Nitin Spinners | 0.39% |
| Pesticides | 1.84% |
| PI Industries | 0.95% |
| Rallis India | 0.89% |
| Petroleum Products | 1.84% |
| Hindustan Petroleum Corporation | 1.84% |
| Power | 1.81% |
| Kalpataru Power Transmission | 1.11% |
| Nava Bharat Ventures | 0.70% |
| Transportation | 1.69% |
| VRL Logistics | 1.31% |
| Future Supply Chain Solutions | 0.38% |
| Textile Products | 1.51% |
| K.P.R. Mill | 1.13% |
| Dollar Industries | 0.38% |
| Media & Entertainment | 0.19% |
| Entertainment Network (India) | 0.19% |
| Net Cash and Cash Equivalent | 1.88% |
| Grand Total | 100.00% |
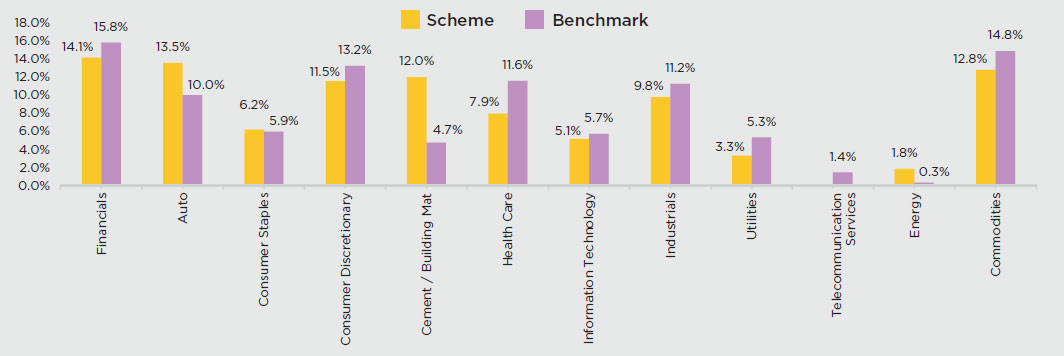
SECTOR ALLOCATION
RISKOMETER
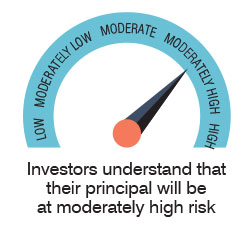
This product is suitable for investors who are seeking*:
• To create wealth over long term
• Investment predominantly in equity and equity related instruments
following a value investment strategy
*Investors should consult their financial advisors if in doubt about
whether the product is suitable for them.
|
|
The above mentioned is the current strategy of the Fund Manager. However, asset allocation and investment strategy shall be within broad parameters of Scheme Information Document.
MUTUAL FUND INVESTMENTS ARE SUBJECT TO MARKET RISKS, READ ALL SCHEME RELATED DOCUMENTS CAREFULLY.
 | Contact your Financial Advisor |
 | Call toll free 1800-2-6666-88 |
| Contact your Financial Advisor | Call toll free 1800-2-6666-88 |
 Invest online at www.idfcmf.com |  www.facebook.com/idfcamc |
 @IDFCMF | |