
IDFC FOCUSED EQUITY FUND

|
|
|
|
|
IDFC FOCUSED EQUITY FUND
An open ended equity scheme investing in maximum 30 stocks with multi cap focus
IDFC Focused Equity Fund is a concentrated portfolio of up to 30 stocks with the flexibility to invest across sectors and across market cap.
FUND PHILOSOPHY*
IDFC Focused Equity Fund is an equity oriented fund
investing across the market cap curve. It holds a
concentrated portfolio comprising of a mix of core and
tactical ideas limited to a maximum of 30 stocks. The core
portfolio of the fund primarily invests in businesses that are
growth oriented and have superior quality characteristics.
The tactical part of the portfolio largely comprises of
businesses that have the potential to turnaround driven by
change in internal/external environment.
Under the SEBI scheme classification, IDFC Focused Equity
Fund is categorized under “Focused” Funds. At an industry
level, while these funds are classified as “Focused”, their
market cap orientation is not defined clearly and by this
nature they are also “Multi-Cap”.
OUTLOOK
Three key drivers of Equity markets are 1) Earnings 2)
Interest Rates and 3) Valuations.
Earnings - For the first time since the 2008 GFC, India has
seen 4 consecutive quarters where BSE200 2-year
Forward EPS has been upgraded. Sustained momentum in
earnings resulting in a cycle of earnings upgrades can help
drives markets higher.
Interest Rates - Interest Rates, both in India and globally
are trending upwards on account of higher inflation and
faster than expected economic recovery. Higher interest
rates are generally negative for Valuations.
Valuation - Indian markets have significantly outperformed
global markets since the pandemic bottom. The scope for
valuation rerating driven market move is limited.
FUND FEATURES: (Data as on 31st October'21)
Category: Focused
Monthly Avg AUM: Rs1,459.50 Crores
Inception Date: 16th March 2006
Fund Manager:
Mr Sumit Agarwal
(w.e.f 20/10/2016)
Other Parameters:
Beta: 0.89
R Square: 0.89
Standard Deviation (Annualized): 20.68%
Benchmark: S&P BSE 500 TRI
(w.e.f 11/11/2019)
Minimum Investment Amount: Rs5,000/- and any amount thereafter.
Exit Load: • If redeemed/switched out within 365
days from the date of allotment:
➧ Upto 10% of investment:Nil,
➧ For remaining investment: 1% of
applicable NAV.
• If redeemed / switched out after 365
days from date of allotment: Nil. (w.e.f.
May 08, 2020)
Minimum SIP Amount: Rs1,00/-
SIP Frequency Monthly (Investor may
choose any day of the month except
29th, 30th and 31st as the date of instalment.)
Options Available: Growth, IDCW@ -
(Payout, Reinvestment and Sweep (from
Equity Schemes to Debt Schemes only))
| PLAN | IDCW@ RECORD DATE | ₹/UNIT | NAV |
| REGULAR | 22-Jul-21 | 0.77 | 15.4500 |
| 16-Mar-20 | 0.67 | 10.7600 | |
| 26-Mar-18 | 0.83 | 13.4883 | |
| DIRECT | 22-Jul-21 | 1.29 | 25.8900 |
| 26-Mar-18 | 0.25 | 19.0688 | |
| 24-Jan-17 | 1.20 | 14.6625 |
Income Distribution cum capital withdrawal is not guaranteed and past performance may or may not be sustained in future. Pursuant to payment of Income Distribution cum capital withdrawal, the NAV of the scheme would fall to the extent of payout and statutory levy (as applicable). @Income Distribution cum capital withdrawal
| PORTFOLIO | (31 October 2021) |
| Name of the Instrument | % of NAV |
| Equity and Equity related Instruments | 97.35% |
| Banks | 31.13% |
| ICICI Bank | 10.23% |
| State Bank of India | 9.83% |
| HDFC Bank | 7.46% |
| Axis Bank | 3.62% |
| Software | 16.56% |
| Infosys | 7.98% |
| Tata Consultancy Services | 4.47% |
| L&T Technology Services | 2.17% |
| Coforge | 1.94% |
| Pharmaceuticals | 8.30% |
| Divi's Laboratories | 3.06% |
| Natco Pharma | 2.70% |
| Gland Pharma | 2.54% |
| Petroleum Products | 6.48% |
| Reliance Industries | 6.48% |
| Auto | 5.62% |
| Maruti Suzuki India | 3.13% |
| TVS Motor Company | 2.49% |
| Finance | 5.00% |
| Bajaj Finance | 5.00% |
| Consumer Non Durables | 4.57% |
| Prataap Snacks | 2.37% |
| 3M India | 2.20% |
| Consumer Durables | 4.32% |
| Bata India | 2.22% |
| Voltas | 2.10% |
| Cement & Cement Products | 3.83% |
| UltraTech Cement | 3.83% |
| Industrial Products | 3.13% |
| Bharat Forge | 3.13% |
| Construction Project | 2.73% |
| Larsen & Toubro | 2.73% |
| Non - Ferrous Metals | 2.06% |
| Hindalco Industries | 2.06% |
| Healthcare Services | 2.05% |
| Max Healthcare Institute | 2.05% |
| Chemicals | 1.58% |
| Anupam Rasayan India | 1.58% |
| Net Cash and Cash Equivalent | 2.65% |
| Grand Total | 100.00% |
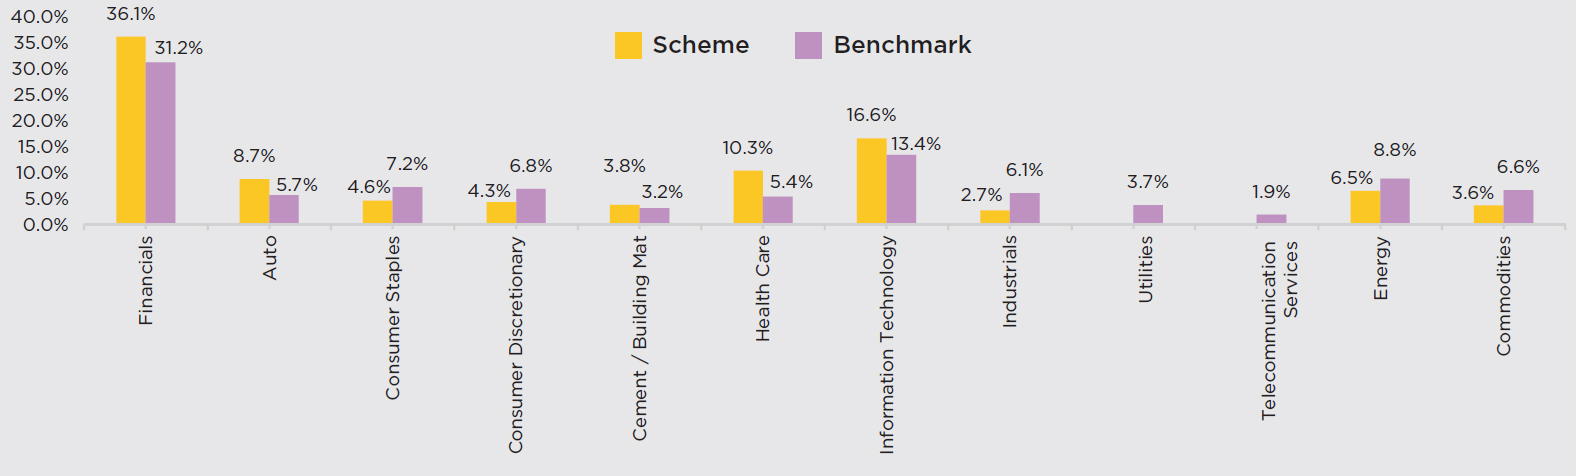
SECTOR ALLOCATION
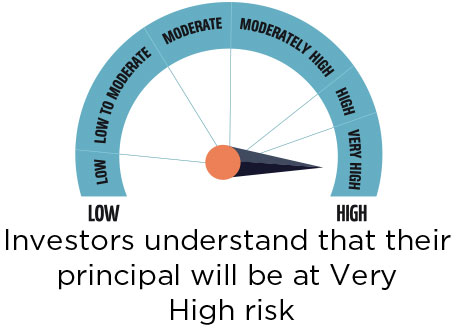
RISKOMETER
Scheme risk-o-meter
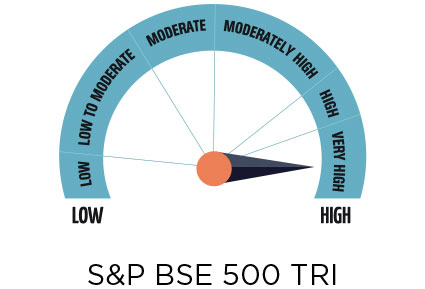
Benchmark risk-o-meter
This product is suitable for investors who are seeking*:
• To create wealth over long term
• Investment in a concentrated portfolio of equity and equity
related instruments of up to 30 companies.
*Investors should consult their financial advisors if in doubt about
whether the product is suitable for them.
|
|
The above mentioned is the current strategy of the Fund Manager. However, asset allocation and investment strategy shall be within broad parameters of Scheme Information Document.
MUTUAL FUND INVESTMENTS ARE SUBJECT TO MARKET RISKS, READ ALL SCHEME RELATED DOCUMENTS CAREFULLY.
 | Contact your Financial Advisor |
 | Call toll free 1800-2-6666-88 |
| Contact your Financial Advisor | Call toll free 1800-2-6666-88 |
 Invest online at www.idfcmf.com |  www.facebook.com/idfcamc |
 @IDFCMF | |