
IDFC STERLING VALUE FUND

|
|
|
|
|
IDFC STERLING VALUE FUND
An open ended equity scheme following a value investment strategy
IDFC Sterling Value Fund is a value
oriented fund with the current focus on
the mid and small cap segment*.
FUND PHILOSOPHY*
The focus of IDFC Sterling Value Fund has been on building a portfolio of Leader/Challengers and Emerging businesses with an emphasis on bottom up stock selection. As part of the current strategy, the portfolio looks to build on the leaders/challengers – these are the market leaders in the Non-Nifty sectors (like Tyres, Bearings) or Top Challengers in the Nifty sectors (such as FMCG, Banks). The key parameters that we look at while selecting the companies here are low debt to operating cash flow and ROIC (Return on Invested Capital) greater than the Cost of Capital (CoC). The other part of the portfolio focuses on the Emerging Businesses. These are businesses in down cycles or where scale is yet to be achieved or where companies can fund growth without repeated dilutions. Many a times, earnings do not capture fair value of the businesses in down cycles or that are yet to achieve scale and hence popular ratios such as P/E ratio might not be the relevant metric to value the company. Thus, we believe that a better parameter for relative value evaluation could be the Enterprise Value (EV)/Sales ratio & Price/Book (P/B). We also filter stocks for Sustained improvement in RoE (Return on Equity) and RoCE (Return on Capital Employed) and those with Earnings Growth higher than Nifty. This segregation helps in easy management of risk & liquidity aspects of the portfolio.
OUTLOOK
Q3 FY22 results have been largely encouraging, demand
remained strong while, EBIDTA margin has compressed largely
on account of the inflation across commodities. However, lower
finance costs and robust cash generation has boosted
profitability. Indian corporates, including Banks, enter FY23
with the strongest balance sheet probably since FY12.
Near term worries post the Ukraine-Russia conflict have stoked
fears of further dislocation in supply chain, especially Gas, key
industrial Metals and Agri Commodities. As a result, commodity
prices have soared, with Brent crossing $110/barrel levels. This
could affect inflation in the coming months. In this context, a
swift resolution to peace could be critical, as levers to boost
supply of these commodities from RoW remain limited. The
ferocity of the move in inflation could dampen investor
sentiments. For equity investors, conflicts and wars have been
phases of mixed emotion – during the crisis, regret of being
fully invested (RoFI) and once past the crisis, regret of missed
opportunities (FOMO). Looking back, continuing with one’s
equity investments through such crisis generally has been the
ideal strategy.
FUND FEATURES: (Data as on 28th February'22)
Category: Value
Monthly Avg AUM: Rs4,433.72 Crores
Inception Date: 7th March 2008
Fund Manager:
Mr. Anoop Bhaskar (w.e.f. 30/04/2016) & Mr. Daylynn Pinto (w.e.f. 20/10/2016)
Other Parameters:
Beta: 1.27
R Square: 0.88
Standard Deviation (Annualized): 29.85%
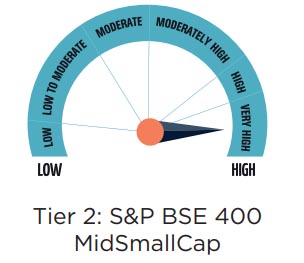
Benchmark: Tier 1: S&P BSE 500 TRI
(w.e.f. 28th Dec, 2021) Tier 2: S&P BSE
400 MidSmallCap TRI
Minimum Investment Amount: Rs5,000/- and any amount thereafter.
Exit Load:
• If redeemed/switched out within 365
days from the date of allotment:
➧ Upto 10% of investment:Nil,
➧ For remaining investment: 1% of
applicable NAV.
•If redeemed / switched out after 365
days from date of allotment: Nil. (w.e.f.
May 08, 2020)
SIP Frequency Monthly (Investor
may choose any day of the month
except 29th, 30th and 31st as the date
of instalment.)
Options Available: Growth, IDCW@
(Payout, Reinvestment and Sweep (from
Equity Schemes to Debt Schemes only))
| PLAN | IDCW@ RECORD DATE | ₹/UNIT | NAV |
| REGULAR | 26-Aug-21 | 1.46 | 28.4600 |
| 20-Mar-20 | 0.73 | 12.8800 | |
| 16-Feb-18 | 1.38 | 23.2025 | |
| DIRECT | 26-Aug-21 | 1.83 | 35.7600 |
| 10-Mar-17 | 1.37 | 19.3894 | |
| 21-Mar-16 | 1.50 | 16.3433 |
Face Value per Unit (in ₹) is 10
Income Distribution cum capital withdrawal is not guaranteed and past performance may or may not be sustained in future. Pursuant to payment of Income Distribution cum capital withdrawal, the NAV of the scheme would fall to the extent of payout and statutory levy (as applicable).
| PORTFOLIO | (28 February 2022) |
| Name of the Instrument | % of NAV |
| Equity and Equity related Instruments | 94.56% |
| Banks | 12.17% |
| ICICI Bank | 4.58% |
| Axis Bank | 3.04% |
| State Bank of India | 2.83% |
| Bank of Baroda | 1.37% |
| HDFC Bank | 0.33% |
| Consumer Non Durables | 9.29% |
| Radico Khaitan | 1.99% |
| ITC | 1.72% |
| Tata Consumer Products | 1.68% |
| Avanti Feeds | 1.43% |
| Emami | 1.28% |
| Godrej Consumer Products | 1.19% |
| Software | 7.70% |
| Tata Consultancy Services | 2.71% |
| HCL Technologies | 2.38% |
| Persistent Systems | 1.48% |
| Zensar Technologies | 1.14% |
| Consumer Durables | 7.27% |
| Greenpanel Industries | 3.09% |
| Voltas | 2.00% |
| Butterfly Gandhimathi Appliances | 1.46% |
| Mayur Uniquoters | 0.73% |
| Pharmaceuticals | 6.90% |
| Cipla | 2.17% |
| Sun Pharmaceutical Industries | 1.58% |
| IPCA Laboratories | 1.54% |
| Laurus Labs | 1.33% |
| Alembic Pharmaceuticals | 0.28% |
| Auto Ancillaries | 6.53% |
| Minda Industries | 2.69% |
| Bosch | 1.73% |
| Wheels India | 1.18% |
| Tube Investments of India | 0.92% |
| Industrial Products | 5.04% |
| Polycab India | 1.84% |
| Bharat Forge | 1.67% |
| Graphite India | 1.53% |
| Cement & Cement Products | 4.89% |
| JK Cement | 1.60% |
| The Ramco Cements | 1.48% |
| Nuvoco Vistas Corporation | 1.18% |
| Sagar Cements | 0.64% |
| Ferrous Metals | 4.18% |
| Jindal Steel & Power | 3.38% |
| Kirloskar Ferrous Industries | 0.80% |
| Leisure Services | 3.54% |
| The Indian Hotels Company | 2.48% |
| EIH | 1.06% |
| Finance | 3.24% |
| Poonawalla Fincorp | 2.31% |
| Mas Financial Services | 0.93% |
| Chemicals | 2.53% |
| Deepak Nitrite | 2.53% |
| Gas | 2.46% |
| Gujarat Gas | 2.46% |
| Industrial Capital Goods | 2.41% |
| CG Power and Industrial Solutions | 2.41% |
| Power | 2.40% |
| KEC International | 2.40% |
| Textile Products | 2.28% |
| K.P.R. Mill | 2.28% |
| Transportation | 2.27% |
| VRL Logistics | 2.27% |
| Insurance | 2.08% |
| SBI Life Insurance Company | 1.19% |
| ICICI Lombard General Insurance Company | 0.89% |
| Auto | 1.81% |
| Tata Motors | 1.81% |
| Petroleum Products | 1.66% |
| Reliance Industries | 1.66% |
| Construction Project | 1.55% |
| NCC | 1.55% |
| Retailing | 1.31% |
| V-Mart Retail | 1.31% |
| Textiles - Cotton | 0.60% |
| Vardhman Textiles | 0.60% |
| Entertainment | 0.46% |
| PVR | 0.46% |
| Net Cash and Cash Equivalent | 5.44% |
| Grand Total | 100.00% |
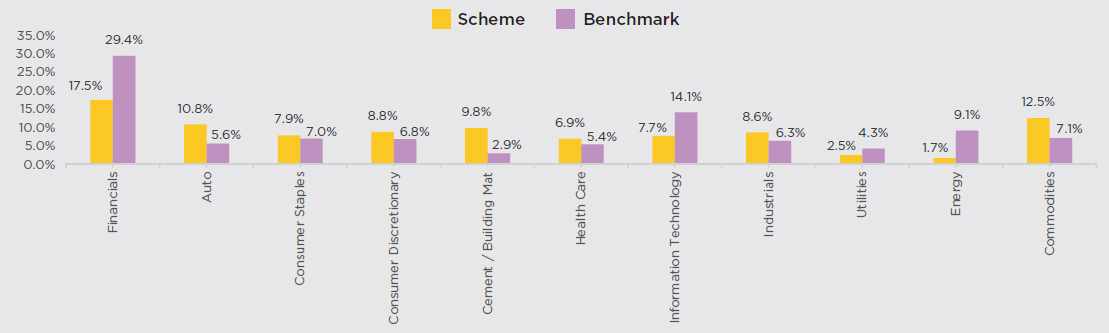
SECTOR ALLOCATION
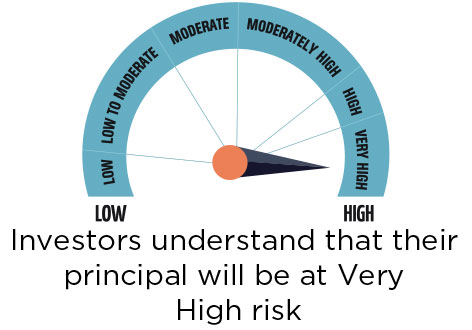
RISKOMETER
Scheme risk-o-meter
Benchmark risk-o-meter

Benchmark risk-o-meter
This product is suitable for investors who are seeking*:
• To create wealth over long term
• Investment predominantly in equity and equity related instruments
following a value investment strategy
*Investors should consult their financial advisors if in doubt about
whether the product is suitable for them.
|
|
*The above mentioned is the current strategy of the Fund Manager. However, asset allocation and investment strategy shall be within broad parameters of Scheme Information Document.
MUTUAL FUND INVESTMENTS ARE SUBJECT TO MARKET RISKS, READ ALL SCHEME RELATED DOCUMENTS CAREFULLY.
 | Contact your Financial Advisor |
 | Call toll free 1800-2-6666-88 |
| Contact your Financial Advisor | Call toll free 1800-2-6666-88 |
 Invest online at www.idfcmf.com |  www.facebook.com/idfcamc |
 @IDFCMF | |